


 |
市場調查報告書
商品編碼
2124576
光收發器:市場佔有率分析、產業趨勢與統計、成長預測(2026-2031)Optical Transceiver - Market Share Analysis, Industry Trends & Statistics, Growth Forecasts (2026 - 2031) |
||||||

※ 本網頁內容可能與最新版本有所差異。詳細情況請與我們聯繫。
根據 Mordor Intelligence 預測,光收發器市場預計將在 2026 年達到 154.2 億美元,並在 2031 年擴大到 292.6 億美元,複合年成長率高達 13.67%。
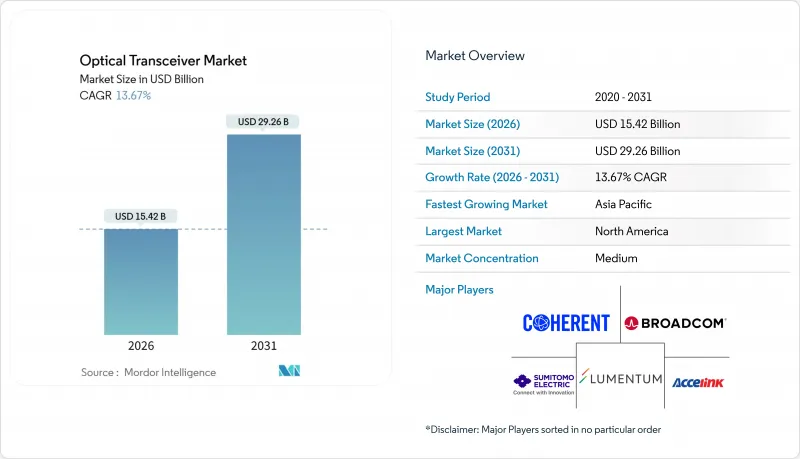
本報告按協定(乙太網路、InfiniBand 及其他)、資料速率(低於 10 Gbps、10–40 Gbps 及其他)、外形尺寸(SFP/SFP+、OSFP 及其他)、光纖類型(單模、多模)、傳輸距離(短距離、中型距離、長距離)、應用領域(單模、多模)和地區通訊區等區域通訊區。市場預測以美元計價。
全球光收發器市場趨勢及洞察
超大規模資料中心的擴張
Meta、Google、微軟和亞馬遜網路服務(AWS)等公司的創紀錄資本支出推動了400G和800G模組出貨量的成長,因為訓練叢集集中的每個圖形處理器(GPU)都需要多條高速鏈路。電信業者正在推動OSFP封裝的標準化,以確保更大的散熱空間。快速擴展給供應商帶來了降低每位元功耗的壓力,加速了矽光電整合技術的創新。依賴400ZR和800ZR連貫介面的區域間可用性架構進一步提升了對支援城域傳輸的插件模組的需求。隨著超大規模資料中心業者將推理工作負載更靠近終端用戶,短距離線性光元件也越來越受歡迎,以最大限度地降低機架中的功耗。
向 400G 和 800G 乙太網路遷移
IEEE 802.3df 標準建立了 800 Gbps 的實體層,為主流部署鋪平了道路。博通公司在 2024 年出貨了超過 50 萬顆支援 800G 的交換器 ASIC,證實價格已降至關鍵的普及閾值以下。光網際網路論壇 (OIF) 800ZR 規格使營運商無需外部轉發器即可傳輸超過 120 公里的城域網路線路,從而將總擁有成本 (TCO) 降低約四分之一。早期現場測試已證實其性能達到商用級別,營運商正在加快升級藍圖。能夠將八條 100 Gbps 電通道和先進的前向糾錯技術整合到風冷機殼中的供應商,最有可能獲得市場認可。
超過 800G 的模組功耗很高
一個 800 Gbps 的 OSFP 模組會散發 50 W 的熱量,而一個配備八個此類模組的機架式交換器則消耗近 800 W 的功率,這已經接近風冷散熱的極限。採用液冷散熱將使每個機架額外增加 500 至 1000 美元的成本,從而延長預算緊張的電信業者的投資回收期。開放式運算專案 (OCP) 已將每 100 Gbps 的功耗限制在 15 W,但目前的設計功耗往往超出此目標高達 40%。線性可插拔光模組 (LPO) 可將功耗降低至約 12 W,但其傳輸距離限制在 2 公里以內,因此只能用於園區或單一站點網路。此外,目前長達九個月的認證週期也延遲了小型供應商的收入累計。
細分市場分析
到2025年,乙太網路將佔據光收發器市場45.79%的佔有率,這反映出其在葉脊式網路架構和匯聚層中的廣泛應用。目前規模較小的連貫DWDM解決方案預計到2031年將以14.88%的複合年成長率成長,這主要得益於城域網路和長途營運商不斷擴大400ZR和800ZR插件模組的量產。 InfiniBand在高效能運算(HPC)領域保持著獨特的地位,因為RDMA延遲在該領域至關重要。同時,光纖通道正在儲存區域網路(SAN)中向第七代(Gen 7)速度演進。無源光纖網路模組在寬頻部署中仍然必不可少,尤其是在監管機構強制推行光纖到府(FTTH)的地區。
乙太網路的覆蓋範圍從 25G 園區上行鏈路延伸至 800G 超大規模骨幹網,實現了規模經濟並降低了單埠成本。連貫波分複用 (DWDM) 技術發展迅猛,營運商發現其頻譜效率比離散轉發器提高了 25% 至 40%。 InfiniBand 的 1.6 Tbps EDR藍圖保持了其性能優勢,使其高價位物有所值。光纖通道透過精心設計的頻寬擴展,保持了對關鍵任務型 SAN 的向下相容性。 PON光學模組為供應商提供了穩定的收入來源,即使資料中心支出波動,也能將已投入光纖最後一公里建設的土木工程成本變現。
預計到2025年,在QSFP28和QSFP-DD出貨量的推動下,100 Gbps至400 Gbps的收發器將佔據39.16%的市場。受IEEE 802.3df和即將推出的802.3dj標準的支持,400 Gbps以上光收發器模組市場預計將以14.69%的複合年成長率成長。 40 Gbps以下細分市場的出貨量保持穩定,因為企業傾向於最大限度地利用現有資產,而不是進行全面升級。
400 Gbps 的成本曲線已大幅下降,以至於一些超大規模資料中心業者資料中心在新資料中心中完全跳過了 100 Gbps 的頻寬。採用 200 Gbps 電通道的 1.6 Tbps 插件模組的早期工程樣品將於 2026 年出現在實驗室測試中。同時,基於 SFP 的 1 Gbps 和 10 Gbps 模組仍在為工業和寬頻 CPE 市場持續出貨數百萬個。整體而言,光收發器市場延續了以往每五到六年頻寬成長四倍的趨勢,而矽光電和先進的 DSP 技術將進一步推動這一發展。
區域分析
預計到2025年,北美將佔全球營收的33.91%,這得益於2025年至2026年間超過2,000億美元的超大規模資本投資。光是Meta一家公司就計畫部署超過100萬個GPU,每個GPU都連接到多個400G或800G連結。亞馬遜網路服務(AWS)正在推動共封裝光模組認證,以降低約30%的功耗,迫使供應商進行更緊密的整合。 AT&T和Verizon等一級營運商正在城域環網中部署400ZR,從而無需外部轉發器,並降低了配置成本。由於遍遠地區寬頻部署的強制性要求以及5G獨立組網的早期部署,加拿大和墨西哥的需求正在進一步成長。
亞太地區是成長最快的地區,預計到2031年複合年成長率將達到14.66%。 InnoLite在2024年上半年出貨了超過50萬個400G模組,證實了國內超大規模網路的強勁需求。中國OEM廠商正加速800G QSFP-DD模組的量產,領先全球同業;同時,印度電信業者正在全國部署數萬個25G去程傳輸模組,以推動5G網路的部署。在日本、韓國和澳大利亞,核心網路向連貫技術的升級正在穩步推進,通常直接跳過100Gbps階段。
由於批發接入價格上限的限制,歐洲的成長速度有所放緩,但採用 800 Gbps連貫光學模組的海底光纜計畫為其提供了支撐。德國電信正在推動對 XGS-PON 收發器的需求,目標是在 2024 年底前將 1,000 萬戶家庭連接到光纖到府 (FTTH)。在中東,各國正在發展各自的雲端基礎設施,阿拉伯聯合大公國和沙烏地阿拉伯的電信業者運作400G 城域環網。南美洲面臨貨幣貶值的壓力,但聖保羅和布宜諾斯艾利斯的 FTTH 部署維持了對 PON 的需求。非洲仍處於發展階段,南非和奈及利亞的電信業者優先考慮用於開放式無線存取網路 (RAN)去程傳輸的光纖通訊設備。
其他好處:
- Excel格式的市場預測(ME)表
- 3個月的分析師支持
目錄
第1章:引言
- 研究假設和市場定義
- 調查範圍
第2章:調查方法
第3章執行摘要
第4章 市場狀況
- 市場概覽
- 市場促進因素
- 超大規模資料中心擴建
- 5G去程傳輸與回程傳輸光纖網路的開發
- 向 400G 和 800G 乙太網路遷移
- 雲端 AI/ML叢集正在擴展以採用 CPO
- 用於低地球軌道(LEO)衛星的耐熱模組
- 線性可插拔光學元件的興起降低了功耗和成本。
- 市場限制因素
- 升級老舊光纖工廠相關的資本投資負擔
- 雷射二極體和數位訊號處理器的供應限制
- 800G 或以上模組的高功耗
- 第二來源供應商的智慧財產權授權障礙
- 產業價值鏈分析
- 監理情勢
- 技術展望
- 波特五力分析
- 宏觀經濟因素對市場的影響
- 投資分析
第5章 市場規模與成長預測
- 根據協議
- Ethernet
- InfiniBand
- 光纖通道
- CWDM/DWDM
- FTTx/PON
- 其他協議
- 按數據速率
- 小於 10 Gbps
- 10~40 Gbps
- 40~100 Gbps
- 100~400 Gbps
- 超過 400 Gbps
- 按外形規格
- SFP/SFP+
- QSFP/QSFP+
- QSFP28/QSFP-DD
- CFP/CFP2/CFP4
- OSFP
- 其他外形規格
- 依纖維類型
- 單模
- 多模式
- 觸及距離
- 短距離(小於10公里)
- 中距離(10-40公里)
- 長途(>40公里)
- 透過使用
- 資料中心
- 電訊
- 企業/園區
- 工業及其他應用
- 按地區
- 北美洲
- 美國
- 加拿大
- 墨西哥
- 歐洲
- 德國
- 英國
- 法國
- 俄羅斯
- 其他歐洲國家
- 亞太地區
- 中國
- 日本
- 印度
- 韓國
- 澳洲
- 其他亞太國家
- 中東和非洲
- 中東
- 沙烏地阿拉伯
- 阿拉伯聯合大公國
- 其他中東國家
- 非洲
- 南非
- 埃及
- 其他非洲國家
- 中東
- 南美洲
- 巴西
- 阿根廷
- 其他南美國家
- 北美洲
第6章 競爭情勢
- 市場集中度
- 策略趨勢
- 市佔率分析
- 公司簡介
- Coherent Corp.
- Lumentum Holdings
- Broadcom Inc.
- Accelink Technologies
- Sumitomo Electric Industries
- Fujitsu Optical Components
- Source Photonics
- Huawei Technologies
- Cisco Systems(Acacia)
- Innolight Technology
- Hisense Broadband
- Eoptolink Technology
- Applied Optoelectronics
- Marvell Technology
- Credo Technology
- Ciena Corp.
- HUBER+SUHNER Cube Optics
- POET Technologies
- Molex LLC
- Lumentum Holdings Inc.
第7章 市場機會與未來展望
According to Mordor Intelligence, the optical transceiver market size reached USD 15.42 billion in 2026 and is projected to climb to USD 29.26 billion by 2031, reflecting a brisk 13.67% CAGR.
This report is Segmented by Protocol (Ethernet, Infiniband, and More), Data Rate (Less Than 10 Gbps, 10-40 Gbps, and More), Form Factor (SFP/SFP+, OSFP, and More), Fiber Type (Single-Mode, and Multi-Mode), Reach Distance (Short-Reach, Medium-Reach, Long-Reach), Application (Telecommunications, Enterprise/Campus, and More), and Geography. The Market Forecasts are Provided in Terms of Value (USD).
Global Optical Transceiver Market Trends and Insights
Hyperscale Data-Center Expansion
Record capital expenditures by Meta, Google, Microsoft, and Amazon Web Services are lifting unit volumes for 400G and 800G modules, as each graphics processing unit in training clusters demands multiple high-speed links. Operators are standardizing on OSFP packages to unlock additional thermal headroom. Rapid scaling places pressure on suppliers to deliver lower power per bit, which, in turn, accelerates innovation in silicon photonics integration. Inter-availability-zone fabrics that rely on 400ZR and 800ZR coherent interfaces further boost demand for metro-reach pluggables. As hyperscalers move inference workloads closer to end users, short-reach linear optics are also gaining favor to minimize energy draw inside racks.
Migration to 400G and 800G Ethernet
The IEEE 802.3df standard finalized 800 Gbps physical layers, setting the stage for mainstream deployments. Broadcom shipped more than 500,000 800G-capable switch ASICs in 2024, confirming that price points have fallen below key adoption thresholds. The Optical Internetworking Forum's 800ZR specification allows operators to light 120 km metro spans without external transponders, cutting the total cost of ownership by roughly one-quarter. Early field trials show revenue-grade performance, prompting carriers to pull forward upgrade roadmaps. Module vendors able to package 8 X 100 Gbps electrical lanes and advanced forward-error correction inside an air-cooled envelope are best positioned to win design slots.
High Power Consumption of greater than 800G Modules
An 800 Gbps OSFP can dissipate 50 W, and a fully populated top-of-rack switch with eight such modules approaches 800 W, pushing the limits of air cooling. Liquid cooling adds USD 500-1,000 per rack, stretching payback periods for operators on tight budgets. The Open Compute Project set a 15 W per 100 Gbps ceiling, a target that current designs exceed by up to 40%. While linear pluggable optics cut draw to roughly 12 W, their 2 km reach confines them to campus or single-site fabrics. Prolonged qualification cycles, now trending at nine months, slow revenue recognition for smaller vendors.
Other drivers and restraints analyzed in the detailed report include:
- 5G Fronthaul and Backhaul Fiber Build-Out
- Growing Cloud AI/ML Clusters Adopting CPO
- CAPEX Burden to Upgrade Legacy Fiber Plants
For complete list of drivers and restraints, kindly check the Table Of Contents.
Segment Analysis
Ethernet accounted for 45.79% of the optical transceiver market share in 2025, reflecting its ubiquity across leaf-spine fabrics and aggregation layers. Coherent DWDM solutions, though smaller today, are forecast to register a 14.88% CAGR through 2031, propelled by metro and long-haul operators extending 400ZR and 800ZR pluggables into production. InfiniBand retains a niche in high-performance computing where RDMA latency is critical, while Fibre Channel evolves to Gen 7 speeds in storage-area networks. Passive optical network modules remain essential in broadband rollouts, particularly where regulators mandate fiber-to-the-home coverage.
Ethernet's breadth spans 25G campus uplinks to 800G hyperscale backbones, creating economies of scale that depress per-port pricing. Coherent DWDM climbs faster because carriers see spectral efficiency gains of 25-40% compared with discrete transponders. InfiniBand's roadmap toward 1.6 Tbps EDR maintains a performance moat that justifies premium pricing. Fibre Channel's carefully staged bandwidth jumps keep backward compatibility for mission-critical SANs. PON optics monetize civil works already sunk into last-mile fiber, giving suppliers a stable revenue stream even as data center spending fluctuates.
Transceivers between 100 Gbps and 400 Gbps held a 39.16% share in 2025, underpinned by QSFP28 and QSFP-DD volumes. The optical transceiver market for modules above 400 Gbps is on track for a 14.69% CAGR, aided by IEEE 802.3df and the forthcoming 802.3dj frameworks. Below 40 Gbps, shipments stabilize as enterprises sweat legacy assets rather than undertake wholesale upgrades.
Cost curves for 400 Gbps have fallen sufficiently that some hyperscalers skip 100 Gbps altogether in new halls. Early engineering samples of 1.6 Tbps pluggables appear in 2026 lab trials, leveraging 200 Gbps electrical lanes. At the opposite end, SFP-based 1 Gbps and 10 Gbps modules still ship in millions to industrial and broadband CPE markets. Overall, the optical transceiver market continues its historical cadence of quadrupling bandwidth every five to six years, with silicon photonics and advanced DSPs extending that trendline.
Complete Report Scope:
- By Protocol
- Ethernet
- InfiniBand
- Fibre Channel
- CWDM / DWDM
- FTTx / PON
- Other Protocols
- By Data Rate
- Less than 10 Gbps
- 10 - 40 Gbps
- 40 - 100 Gbps
- 100 - 400 Gbps
- Greater than 400 Gbps
- By Form Factor
- SFP / SFP+
- QSFP / QSFP+
- QSFP28 / QSFP-DD
- CFP / CFP2 / CFP4
- OSFP
- Other Form Factors
- By Fiber Type
- Single-Mode
- Multi-Mode
- By Reach Distance
- Short-Reach (Less than 10 km)
- Medium-Reach (10 - 40 km)
- Long-Reach (Greater than 40 km)
- By Application
- Data Centers
- Telecommunications
- Enterprise / Campus
- Industrial and Other Applications
- By Geography
- North America
- United States
- Canada
- Mexico
- Europe
- Germany
- United Kingdom
- France
- Russia
- Rest of Europe
- Asia-Pacific
- China
- Japan
- India
- South Korea
- Australia
- Rest of Asia-Pacific
- Middle East and Africa
- Middle East
- Saudi Arabia
- United Arab Emirates
- Rest of Middle East
- Africa
- South Africa
- Egypt
- Rest of Africa
- Middle East
- South America
- Brazil
- Argentina
- Rest of South America
- North America
Geography Analysis
North America accounted for 33.91% of 2025 revenue, anchored by hyperscale capital outlays exceeding USD 200 billion across 2025-2026. Meta alone plans to deploy over 1 million GPUs, each tied to multiple 400G or 800G links. Amazon Web Services is qualifying co-packaged optics to trim power by roughly 30%, pushing component vendors toward tighter integration. Tier-1 carriers such as AT&T and Verizon have deployed 400ZR in metro rings, eliminating the need for external transponders and reducing provisioning costs. Canada and Mexico contribute incremental volume through rural broadband mandates and early 5G standalone builds.
Asia-Pacific is the fastest-growing region, with a 14.66% CAGR projection through 2031. Innolight shipped more than 500,000 400G modules in the first half of 2024, underscoring domestic hyperscale demand. Chinese OEMs ramp 800G QSFP-DD ahead of global peers, while Indian operators deploy tens of thousands of 25G fronthaul modules during nationwide 5G rollouts. Japan, South Korea, and Australia press forward with coherent upgrades in core networks, often leapfrogging 100 Gbps stages entirely.
Europe grows at a moderate pace, constrained by wholesale access price caps but bolstered by submarine cable projects that specify 800 Gbps coherent optics. Deutsche Telekom connected 10 million premises to FTTH by year-end 2024, driving demand for XGS-PON transceivers. The Middle East pursues sovereign cloud builds, with UAE and Saudi operators lighting 400G metro rings. South America faces currency pressure yet relies on FTTH deployments in Sao Paulo and Buenos Aires to sustain PON volumes. Africa remains nascent, with South African and Nigerian carriers prioritizing open-RAN fronthaul optics.
- Coherent Corp.
- Lumentum Holdings
- Broadcom Inc.
- Accelink Technologies
- Sumitomo Electric Industries
- Fujitsu Optical Components
- Source Photonics
- Huawei Technologies
- Cisco Systems (Acacia)
- Innolight Technology
- Hisense Broadband
- Eoptolink Technology
- Applied Optoelectronics
- Marvell Technology
- Credo Technology
- Ciena Corp.
- HUBER+SUHNER Cube Optics
- POET Technologies
- Molex LLC
- Lumentum Holdings Inc.
Additional Benefits:
- The market estimate (ME) sheet in Excel format
- 3 months of analyst support
TABLE OF CONTENTS
1 INTRODUCTION
- 1.1 Study Assumptions and Market Definition
- 1.2 Scope of the Study
2 RESEARCH METHODOLOGY
3 EXECUTIVE SUMMARY
4 MARKET LANDSCAPE
- 4.1 Market Overview
- 4.2 Market Drivers
- 4.2.1 Hyperscale Data-Center Expansion
- 4.2.2 5G Fronthaul and Backhaul Fiber Build-Out
- 4.2.3 Migration to 400G and 800G Ethernet
- 4.2.4 Growing Cloud AI / ML Clusters Adopting CPO
- 4.2.5 Temperature-Hardened Modules for LEO Satellites
- 4.2.6 Rise of Linear Pluggable Optics Reducing Power and Cost
- 4.3 Market Restraints
- 4.3.1 CAPEX Burden to Upgrade Legacy Fiber Plants
- 4.3.2 Laser-Diode and DSP Supply Constraints
- 4.3.3 High Power Consumption of greater than 800 G Modules
- 4.3.4 IP Licensing Barriers for Second-Source Vendors
- 4.4 Industry Value Chain Analysis
- 4.5 Regulatory Landscape
- 4.6 Technological Outlook
- 4.7 Porter's Five Forces Analysis
- 4.7.1 Bargaining Power of Suppliers
- 4.7.2 Bargaining Power of Buyers
- 4.7.3 Threat of New Entrants
- 4.7.4 Threat of Substitutes
- 4.7.5 Intensity of Competitive Rivalry
- 4.8 Impact of Macroeconomic Factors on the Market
- 4.9 Investment Analysis
5 MARKET SIZE AND GROWTH FORECASTS (VALUE)
- 5.1 By Protocol
- 5.1.1 Ethernet
- 5.1.2 InfiniBand
- 5.1.3 Fibre Channel
- 5.1.4 CWDM / DWDM
- 5.1.5 FTTx / PON
- 5.1.6 Other Protocols
- 5.2 By Data Rate
- 5.2.1 Less than 10 Gbps
- 5.2.2 10 - 40 Gbps
- 5.2.3 40 - 100 Gbps
- 5.2.4 100 - 400 Gbps
- 5.2.5 Greater than 400 Gbps
- 5.3 By Form Factor
- 5.3.1 SFP / SFP+
- 5.3.2 QSFP / QSFP+
- 5.3.3 QSFP28 / QSFP-DD
- 5.3.4 CFP / CFP2 / CFP4
- 5.3.5 OSFP
- 5.3.6 Other Form Factors
- 5.4 By Fiber Type
- 5.4.1 Single-Mode
- 5.4.2 Multi-Mode
- 5.5 By Reach Distance
- 5.5.1 Short-Reach (Less than 10 km)
- 5.5.2 Medium-Reach (10 - 40 km)
- 5.5.3 Long-Reach (Greater than 40 km)
- 5.6 By Application
- 5.6.1 Data Centers
- 5.6.2 Telecommunications
- 5.6.3 Enterprise / Campus
- 5.6.4 Industrial and Other Applications
- 5.7 By Geography
- 5.7.1 North America
- 5.7.1.1 United States
- 5.7.1.2 Canada
- 5.7.1.3 Mexico
- 5.7.2 Europe
- 5.7.2.1 Germany
- 5.7.2.2 United Kingdom
- 5.7.2.3 France
- 5.7.2.4 Russia
- 5.7.2.5 Rest of Europe
- 5.7.3 Asia-Pacific
- 5.7.3.1 China
- 5.7.3.2 Japan
- 5.7.3.3 India
- 5.7.3.4 South Korea
- 5.7.3.5 Australia
- 5.7.3.6 Rest of Asia-Pacific
- 5.7.4 Middle East and Africa
- 5.7.4.1 Middle East
- 5.7.4.1.1 Saudi Arabia
- 5.7.4.1.2 United Arab Emirates
- 5.7.4.1.3 Rest of Middle East
- 5.7.4.2 Africa
- 5.7.4.2.1 South Africa
- 5.7.4.2.2 Egypt
- 5.7.4.2.3 Rest of Africa
- 5.7.4.1 Middle East
- 5.7.5 South America
- 5.7.5.1 Brazil
- 5.7.5.2 Argentina
- 5.7.5.3 Rest of South America
- 5.7.1 North America
6 COMPETITIVE LANDSCAPE
- 6.1 Market Concentration
- 6.2 Strategic Moves
- 6.3 Market Share Analysis
- 6.4 Company Profiles (includes Global-level Overview, Market-level Overview, Core Segments, Financials as available, Strategic Information, Market Rank / Share for key companies, Products and Services, Recent Developments)
- 6.4.1 Coherent Corp.
- 6.4.2 Lumentum Holdings
- 6.4.3 Broadcom Inc.
- 6.4.4 Accelink Technologies
- 6.4.5 Sumitomo Electric Industries
- 6.4.6 Fujitsu Optical Components
- 6.4.7 Source Photonics
- 6.4.8 Huawei Technologies
- 6.4.9 Cisco Systems (Acacia)
- 6.4.10 Innolight Technology
- 6.4.11 Hisense Broadband
- 6.4.12 Eoptolink Technology
- 6.4.13 Applied Optoelectronics
- 6.4.14 Marvell Technology
- 6.4.15 Credo Technology
- 6.4.16 Ciena Corp.
- 6.4.17 HUBER+SUHNER Cube Optics
- 6.4.18 POET Technologies
- 6.4.19 Molex LLC
- 6.4.20 Lumentum Holdings Inc.
7 MARKET OPPORTUNITIES AND FUTURE OUTLOOK
- 7.1 White-Space and Unmet-Need Assessment

 光收發器:全球市場
 全球5G光收發器市場規模、佔有率、趨勢和成長分析報告(2026-2034年)
 光收發器市場-2026-2032年全球市場預測第三方光收發器市場:2026-2032年全球市場預測(按外形尺寸、連接器類型、光纖模式、協定係列、光纖數量、應用和最終用戶分類)
 全球光收發器及測試儀銷售市場報告、競爭分析及區域商機(2026-2032年)全球光收發器市場(2026-2036 年)
 光收發器市場規模、佔有率和成長分析:按外形尺寸、資料速率、光纖類型、傳輸距離、連接器、協定、應用和地區分類-2026年至2033年產業預測
 光收發器市場:按協定、資料速率、應用和地區分類
 光收發器市場分析及預測(至2035年):類型、產品、技術、組件、應用、形狀、材料類型、最終用戶、模組、功能
 2026年全球多模光收發器市場報告