


 |
市場調查報告書
商品編碼
2124409
非洲包裝市場:市場佔有率分析、產業趨勢與統計及成長預測(2026-2031 年)Africa Packaging - Market Share Analysis, Industry Trends & Statistics, Growth Forecasts (2026 - 2031) |
||||||

※ 本網頁內容可能與最新版本有所差異。詳細情況請與我們聯繫。
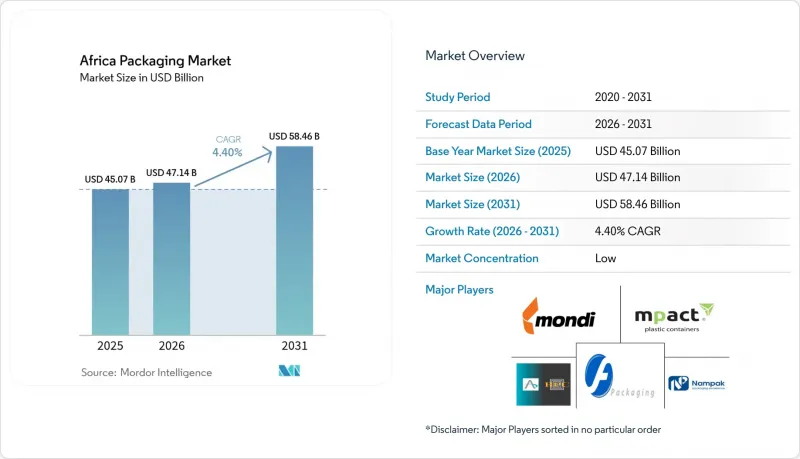
根據 Mordor Intelligence 預測,非洲包裝市場規模將從 2025 年的 450.7 億美元成長到 2026 年的 471.4 億美元,然後在 2031 年達到 584.6 億美元,2026 年至 2031 年的複合年成長率為 4.4%。
本報告按包裝類型(塑膠、紙、玻璃容器、金屬罐)、包裝形式(硬質、軟質)、最終用途產業(食品、飲料、藥品、個人護理、工業、電子商務)和國家(埃及、奈及利亞、肯亞、南非及其他非洲國家)進行細分。市場預測以美元計價。
非洲包裝市場趨勢與洞察
不斷壯大的都市區中產階級正在推動日常消費品(FMCG)的消費。
快速的城市化使購買力集中於都市區,推動了對小包小袋和立式袋的需求,以滿足單筆交易消費較低的消費者的需求。跨國公司正在推動在地化生產,以降低物流成本並快速回應不斷變化的城市偏好。例如,聯合利華斥資8,500萬美元在拉各斯建設的軟性包裝生產線已於2024年運作。郊區小型超級市場的擴張加速了消費者從計量銷售向預包裝商品的轉變,在奈及利亞和肯亞,小包裝袋的銷售佔比高達50%。可支配收入的成長推動了消費者對高階包裝(例如無菌紙盒)的需求,但由於消費者對價格承受能力的需求,包裝尺寸的創新仍然是重要的成長動力。因此,人口紅利支撐了強勁的基準需求,從而緩解了商品相關領域的周期性庫存波動。
電子商務對包裝材料的需求激增。
到2025年,南非的線上零售額將佔其總銷售額的7.2%,肯亞的電子商務交易量將年增18%。這促使人們重新定義瓦楞紙箱的規格,以適應快速履約和跨境運輸的需求。 Jumia在西非和東非新建的履約中心將新增12萬平方公尺的倉儲空間,並推動具有防篡改功能的數位印刷瓦楞紙箱的需求。隨著各平台製定再生材料含量標準,加工商正在增加再生纖維的採購,並投資於能夠實現小批量生產的數位瓦楞紙板生產設備。社群電商的興起推動了對品牌信封和氣泡信封的需求,這是一個先前服務不足的細分市場,預計到2025年將成長22%。缺乏統一的廢棄物管理法規既帶來了掩埋費的風險,也為提供回收項目的加工商帶來了商機。
波動性極大的聚合物和紙漿/紙張價格
2024年至2025年間,南非聚乙烯價格在每噸18,500至24,200蘭特之間波動,導致加工商利潤率下降高達12%。由於撒哈拉以南非洲70%的樹脂依賴進口,運費和外匯的波動直接影響企業的盈虧,例如2024年底紅海海域的動盪導致供應延遲六週。 2025年,全球供應短缺使紙漿成本上漲11%,迫使瓦楞紙板生產商以18%的溢價進口牛皮紙襯裡。非洲金融中心有限的避險選擇使中小型加工商面臨現貨價格突然波動的風險,進一步加速了企業擴大規模和垂直整合的趨勢。
細分市場分析
2025年,塑膠佔非洲包裝市場收入的48.19%。這主要得益於聚乙烯(用於購物袋和乳製品包裝袋)、PET(用於飲料包裝)以及聚丙烯(用於熱填充應用)。然而,隨著對一次性產品的禁令日益嚴格,可生物分解替代品的市場預計將以4.91%的複合年成長率成長。南非的PET回收率高達68%,位居非洲大陸之首,顯示押金返還機制永續。可生物分解材料的普及仍然受到堆肥設施有限的限制,這些設施只能處理預計PLA產量的一小部分,但試驗計畫表明,一旦回收系統成熟,其應用將得到擴展。 2025年,紙張佔28%的市場佔有率,這主要得益於電子商務對瓦楞紙板的需求以及乾貨包裝對折疊式紙盒的需求。同時,玻璃和金屬在高階飲料和店內消費領域保持著一定的市場佔有率。
寶特瓶和HDPE容器等硬質塑膠在銷售上佔據主導地位,但它們依賴資本密集的吹塑成型線,且現有企業佔據有利市場環境,阻礙了包裝形式的快速變革。以立式袋為代表的軟質塑膠包裝成長更為迅速,因為它們可以減少高達40%的材料用量,並滿足都市區非正規零售商的小包裝需求。品牌商正在嘗試引入單一材料複合材料以履行回收義務,但由於阻隔性能方面的妥協,這種複合材料在對濕度敏感的零食包裝中的應用受到限制。預計到2025年牛皮紙襯裡將出現短缺,瓦楞紙板製造商已將再生纖維含量提高到85%,這引發了人們對其在潮濕氣候下強度的擔憂。
其他好處
- Excel格式的市場預測(ME)表
- 3個月的分析師支持
目錄
第1章:引言
- 研究假設和市場定義
- 調查範圍
第2章:調查方法
第3章執行摘要
第4章 市場狀況
- 市場概覽
- 市場促進因素
- 不斷壯大的都市區中產階級正在推動日常消費品(FMCG)的消費。
- 電子商務對包裝材料的需求激增。
- 現代零售連鎖店在非洲的擴張
- 政府對一次性塑膠製品的監管促進了替代材料的使用。
- 生鮮食品出口冷鏈物流的興起
- 非洲大陸自由貿易區(AfCFTA)貿易走廊的建立,增加了對可回收運輸包裝材料的需求。
- 市場限制因素
- 波動性極大的聚合物和紙漿/紙張價格
- 電力供應不穩定導致工廠營運成本增加
- 由於港口堵塞,原料流入延遲。
- 回收基礎設施不足阻礙了rPET的廣泛應用。
- 宏觀經濟因素對市場的影響
- 產業價值鏈分析
- 監理情勢
- 技術展望
- 波特五力分析
- 投資分析
- 全球包裝市場概覽
第5章 市場規模與成長預測
- 按包裝類型
- 塑膠包裝
- 硬質塑膠包裝
- 依材料類型
- 聚乙烯(PE)
- 聚丙烯(PP)
- 聚對苯二甲酸乙二醇酯(PET)
- 聚氯乙烯(PVC)
- 聚苯乙烯(PS)和發泡聚苯乙烯(EPS)
- 其他材料類型
- 依產品類型
- 瓶子和罐子
- 蓋子和封口
- 托盤和容器
- 其他
- 按最終用途行業分類
- 食物
- 飲料
- 製藥
- 化妝品和個人護理
- 產業
- 其他
- 依材料類型
- 軟質塑膠包裝
- 依材料類型
- 聚乙烯(PE)
- 雙軸延伸聚丙烯(BOPP)
- 流延聚丙烯(CPP)
- 其他材料類型
- 依產品類型
- 小袋和包包
- 薄膜和包裝
- 其他
- 按最終用途行業分類
- 食物
- 飲料
- 製藥
- 化妝品和個人護理
- 產業
- 其他
- 依材料類型
- 硬質塑膠包裝
- 紙包裝
- 依產品類型
- 折疊式紙盒
- 瓦楞紙箱
- 液態紙包裝
- 其他
- 按最終用途行業分類
- 食物
- 飲料
- 電子商務
- 其他
- 依產品類型
- 玻璃容器
- 按顏色
- 綠色的
- 琥珀色
- 燧石
- 其他顏色
- 按最終用途行業分類
- 食物
- 飲料
- 酒精飲料
- 非酒精性
- 個人護理和化妝品
- 藥品(不包括管瓶和安瓿)
- 香水
- 按顏色
- 金屬罐和容器
- 依材料類型
- 鋼
- 鋁
- 依產品類型
- 能
- 桶和罐
- 蓋子和封口
- 其他
- 按最終用途行業分類
- 食物
- 飲料
- 化工/石油
- 產業
- 油漆和塗料
- 其他
- 依材料類型
- 塑膠包裝
- 按包裝類型
- 難的
- 柔軟的
- 按最終用途行業分類
- 食物
- 飲料
- 藥品和醫療保健
- 個人護理和化妝品
- 產業
- 電子商務
- 其他
- 國家
- 埃及
- 奈及利亞
- 肯亞
- 南非
- 其他非洲地區
第6章 競爭情勢
- 市場集中度
- 策略趨勢
- 市佔率分析
- 公司簡介
- Amcor plc
- Mondi plc
- Nampak Ltd
- Mpact Ltd
- Tetra Pak International SA
- Sealed Air Corp.
- Constantia Flexibles Group GmbH
- Consol Holdings(Pty)Ltd
- Astrapak Ltd
- Foster Packaging International(Pty)Ltd
- East African Packaging Industries Ltd
- Bonpak(Pty)Ltd
- Huhtamaki Oyj
- Ardagh Group SA
- Smurfit WestRock
- Novus Holdings Ltd
- Greif Inc.
- Sonoco Products Company
- Frigoglass SAIC
第7章 市場機會與未來展望
According to Mordor Intelligence, the Africa packaging market size is expected to grow from USD 45.07 billion in 2025 to USD 47.14 billion in 2026 and is forecast to reach USD 58.46 billion by 2031 at a 4.4% CAGR over 2026-2031.
This report is Segmented by Packaging Type (Plastic, Paper, Container Glass, and Metal Cans), Packaging Format (Rigid, and Flexible), End-Use Industry (Food, Beverage, Pharmaceuticals, Personal Care, Industrial, and E-Commerce), and Geography (Egypt, Nigeria, Kenya, South Africa, Rest of Africa). The Market Forecasts are Provided in Terms of Value (USD).
Africa Packaging Market Trends and Insights
Growing Urban Middle Class Boosting FMCG Consumption
Rapid urban migration is concentrating purchasing power in cities, driving demand for portion-controlled sachets and stand-up pouches that match lower per-transaction spending limits.Multinationals are localizing production to cut logistics costs and respond faster to city-level taste shifts, as evidenced by Unilever's USD 85 million flexible-pack line commissioned in Lagos in 2024. Mini-supermarket expansion in peri-urban areas is accelerating the switch from bulk to pre-packaged goods, with sachets accounting for up to 50% of unit sales in Nigeria and Kenya. Rising disposable incomes are encouraging premium pack upgrades such as aseptic cartons, yet affordability considerations mean pack-size innovation remains the principal growth lever. The demographic dividend therefore underpins steady baseline demand that tempers cyclical stocks in commodity-linked segments.
E-commerce Packaging Demand Surge
Online retail's share of South African sales reached 7.2% in 2025, while Kenya's e-commerce value rose 18% year on year, reshaping corrugated-box specifications for rapid fulfilment and cross-border shipping. Jumia's new fulfilment centers across West and East Africa added 120,000 m2 of warehouse space and drove requirements for digitally printed boxes with tamper-evident features. Platforms are setting recycled-content thresholds, prompting converters to invest in recovered-fiber supply and digital corrugators capable of short runs. Social-commerce growth is boosting demand for branded mailers and padded envelopes, an underserved niche that expanded 22% in 2025. Absence of uniform waste regulations poses a risk of landfill levies but also a service opportunity for converters offering take-back schemes.
Volatile Polymer and Paper-Pulp Prices
Polyethylene prices in South Africa oscillated between ZAR 18,500 and ZAR 24,200 t-1 in 2024-2025, shrinking converter margins by up to 12%. With 70% of sub-Saharan resin imported, freight-rate swings and forex shifts have direct P&L impact, illustrated by a six-week supply delay after Red Sea disruptions in late 2024. Paper-pulp costs climbed 11% in 2025 as global supply tightened, compelling box makers to import kraft liner at an 18% premium. Limited hedging tools in African financial hubs expose small converters to spot-price shocks, reinforcing a flight to scale and vertical integration.
Other drivers and restraints analyzed in the detailed report include:
- Government Bans on Single-Use Plastics Driving Alternative Materials
- Rise of Cold-Chain Logistics for Fresh-Produce Exports
- Power-Supply Instability Increasing Plant OPEX
For complete list of drivers and restraints, kindly check the Table Of Contents.
Segment Analysis
Plastic formats supplied 48.19% of Africa packaging market revenue in 2025, underpinned by polyethylene for shopping bags and dairy sachets, PET for beverages and polypropylene for hot-fill applications, yet biodegradable alternatives are projected to grow at 4.91% CAGR as single-use bans tighten. South Africa's 68% PET recycling rate, the highest on the continent, exemplifies how deposit-return schemes can sustain polymer use within circular models. Biodegradable take-up remains constrained by limited composting hubs that handle only a fraction of projected PLA tonnage, yet pilot programs suggest scalable pathways once collection matures. Paper claimed 28% share in 2025, buoyed by corrugated demand from e-commerce and folding cartons for dry foods, while glass and metal retained niche positions in premium beverages and on-premises consumption.
Rigid plastics such as PET bottles and HDPE containers dominate volume but rely on capital-intensive blow-moulding lines that favour incumbents, restraining rapid format shifts. Flexible plastics, led by stand-up pouches, are growing faster because they cut material usage by up to 40% and fit portion-size requirements in urban informal retail. Brand owners are piloting mono-material laminates that meet recyclability mandates, yet barrier-performance trade-offs limit adoption for moisture-sensitive snacks. Kraft-liner shortages in 2025 drove corrugated producers to increase recycled-fiber ratios to 85%, raising strength concerns in humid climates.
Complete Report Scope:
- By Packaging Type
- Plastic Packaging
- Rigid Plastic Packaging
- By Material Type
- Polyethylene (PE)
- Polypropylene (PP)
- Polyethylene Terephthalate (PET)
- Polyvinyl Chloride (PVC)
- Polystyrene (PS) and Expanded PS
- Other Material Types
- By Product Type
- Bottles and Jars
- Caps and Closures
- Trays and Containers
- Other Product Types
- By End-use Industry
- Food
- Beverage
- Pharmaceutical
- Cosmetics and Personal Care
- Industrial
- Other End-use Industry
- By Material Type
- Flexible Plastic Packaging
- By Material Type
- Polyethylene (PE)
- Biaxially Oriented Polypropylene (BOPP)
- Cast Polypropylene (CPP)
- Other Material Types
- By Product Type
- Pouches and Bags
- Films and Wraps
- Other Product Types
- By End-use Industry
- Food
- Beverage
- Pharmaceutical
- Cosmetics and Personal Care
- Industrial
- Other End-use Industry
- By Material Type
- Rigid Plastic Packaging
- Paper Packaging
- By Product Type
- Folding Carton
- Corrugated Boxes
- Liquid Paperboard
- Other Product Type
- By End-use Industry
- Food
- Beverage
- E-commerce
- Other End-use Industry
- By Product Type
- Container Glass
- By Color
- Green
- Amber
- Flint
- Other Colors
- By End-use Industry
- Food
- Beverage
- Alcoholic
- Non-Alcoholic
- Personal Care and Cosmetics
- Pharmaceuticals (Excl. Vials and Ampoules)
- Perfumery
- By Color
- Metal Cans and Containers
- By Material Type
- Steel
- Aluminum
- By Product Type
- Cans
- Drums and Barrels
- Caps and Closures
- Other Product Type
- By End-use Industry
- Food
- Beverage
- Chemicals and Petroleum
- Industrial
- Paints and Coatings
- Other End-use Industry
- By Material Type
- Plastic Packaging
- By Packaging Format
- Rigid
- Flexible
- By End-Use Industry
- Food
- Beverage
- Pharmaceuticals and Healthcare
- Personal Care and Cosmetics
- Industrial
- E-commerce
- Other End-use Industry
- By Country
- Egypt
- Nigeria
- Kenya
- South Africa
- Rest of Africa
List of Companies Covered in this Report:
- Amcor plc
- Mondi plc
- Nampak Ltd
- Mpact Ltd
- Tetra Pak International SA
- Sealed Air Corp.
- Constantia Flexibles Group GmbH
- Consol Holdings (Pty) Ltd
- Astrapak Ltd
- Foster Packaging International (Pty) Ltd
- East African Packaging Industries Ltd
- Bonpak (Pty) Ltd
- Huhtamaki Oyj
- Ardagh Group SA
- Smurfit WestRock
- Novus Holdings Ltd
- Greif Inc.
- Sonoco Products Company
- Frigoglass SAIC
Additional Benefits:
- The market estimate (ME) sheet in Excel format
- 3 months of analyst support
TABLE OF CONTENTS
1 INTRODUCTION
- 1.1 Study Assumptions and Market Definition
- 1.2 Scope of the Study
2 RESEARCH METHODOLOGY
3 EXECUTIVE SUMMARY
4 MARKET LANDSCAPE
- 4.1 Market Overview
- 4.2 Market Drivers
- 4.2.1 Growing Urban Middle Class Boosting FMCG Consumption
- 4.2.2 E-commerce Packaging Demand Surge
- 4.2.3 Expansion of Modern Retail Chains Across Africa
- 4.2.4 Government Bans on Single-Use Plastics Driving Alternative Materials
- 4.2.5 Rise of Cold-Chain Logistics for Fresh-Produce Exports
- 4.2.6 AfCFTA Trade Corridors Spurring Demand for Returnable Transit Packaging
- 4.3 Market Restraints
- 4.3.1 Volatile Polymer and Paper-Pulp Prices
- 4.3.2 Power-Supply Instability Increasing Plant OPEX
- 4.3.3 Port Congestion Delaying Raw-Material Inflows
- 4.3.4 Inadequate Recycling Infrastructure Limiting rPET Uptake
- 4.4 Impact of Macroeconomic Factors on the Market
- 4.5 Industry Value-Chain Analysis
- 4.6 Regulatory Landscape
- 4.7 Technological Outlook
- 4.8 Porter's Five Forces Analysis
- 4.8.1 Bargaining Power of Suppliers
- 4.8.2 Bargaining Power of Buyers
- 4.8.3 Threat of New Entrants
- 4.8.4 Intensity of Competitive Rivalry
- 4.8.5 Threat of Substitutes
- 4.9 Investment Analysis
- 4.10 Overview of the Global Packaging Market
5 MARKET SIZE AND GROWTH FORECASTS (VALUE)
- 5.1 By Packaging Type
- 5.1.1 Plastic Packaging
- 5.1.1.1 Rigid Plastic Packaging
- 5.1.1.1.1 By Material Type
- 5.1.1.1.1.1 Polyethylene (PE)
- 5.1.1.1.1.2 Polypropylene (PP)
- 5.1.1.1.1.3 Polyethylene Terephthalate (PET)
- 5.1.1.1.1.4 Polyvinyl Chloride (PVC)
- 5.1.1.1.1.5 Polystyrene (PS) and Expanded PS
- 5.1.1.1.1.6 Other Material Types
- 5.1.1.1.2 By Product Type
- 5.1.1.1.2.1 Bottles and Jars
- 5.1.1.1.2.2 Caps and Closures
- 5.1.1.1.2.3 Trays and Containers
- 5.1.1.1.2.4 Other Product Types
- 5.1.1.1.3 By End-use Industry
- 5.1.1.1.3.1 Food
- 5.1.1.1.3.2 Beverage
- 5.1.1.1.3.3 Pharmaceutical
- 5.1.1.1.3.4 Cosmetics and Personal Care
- 5.1.1.1.3.5 Industrial
- 5.1.1.1.3.6 Other End-use Industry
- 5.1.1.1.1 By Material Type
- 5.1.1.2 Flexible Plastic Packaging
- 5.1.1.2.1 By Material Type
- 5.1.1.2.1.1 Polyethylene (PE)
- 5.1.1.2.1.2 Biaxially Oriented Polypropylene (BOPP)
- 5.1.1.2.1.3 Cast Polypropylene (CPP)
- 5.1.1.2.1.4 Other Material Types
- 5.1.1.2.2 By Product Type
- 5.1.1.2.2.1 Pouches and Bags
- 5.1.1.2.2.2 Films and Wraps
- 5.1.1.2.2.3 Other Product Types
- 5.1.1.2.3 By End-use Industry
- 5.1.1.2.3.1 Food
- 5.1.1.2.3.2 Beverage
- 5.1.1.2.3.3 Pharmaceutical
- 5.1.1.2.3.4 Cosmetics and Personal Care
- 5.1.1.2.3.5 Industrial
- 5.1.1.2.3.6 Other End-use Industry
- 5.1.1.2.1 By Material Type
- 5.1.1.1 Rigid Plastic Packaging
- 5.1.2 Paper Packaging
- 5.1.2.1 By Product Type
- 5.1.2.1.1 Folding Carton
- 5.1.2.1.2 Corrugated Boxes
- 5.1.2.1.3 Liquid Paperboard
- 5.1.2.1.4 Other Product Type
- 5.1.2.2 By End-use Industry
- 5.1.2.2.1 Food
- 5.1.2.2.2 Beverage
- 5.1.2.2.3 E-commerce
- 5.1.2.2.4 Other End-use Industry
- 5.1.2.1 By Product Type
- 5.1.3 Container Glass
- 5.1.3.1 By Color
- 5.1.3.1.1 Green
- 5.1.3.1.2 Amber
- 5.1.3.1.3 Flint
- 5.1.3.1.4 Other Colors
- 5.1.3.2 By End-use Industry
- 5.1.3.2.1 Food
- 5.1.3.2.2 Beverage
- 5.1.3.2.2.1 Alcoholic
- 5.1.3.2.2.2 Non-Alcoholic
- 5.1.3.2.3 Personal Care and Cosmetics
- 5.1.3.2.4 Pharmaceuticals (Excl. Vials and Ampoules)
- 5.1.3.2.5 Perfumery
- 5.1.3.1 By Color
- 5.1.4 Metal Cans and Containers
- 5.1.4.1 By Material Type
- 5.1.4.1.1 Steel
- 5.1.4.1.2 Aluminum
- 5.1.4.2 By Product Type
- 5.1.4.2.1 Cans
- 5.1.4.2.2 Drums and Barrels
- 5.1.4.2.3 Caps and Closures
- 5.1.4.2.4 Other Product Type
- 5.1.4.3 By End-use Industry
- 5.1.4.3.1 Food
- 5.1.4.3.2 Beverage
- 5.1.4.3.3 Chemicals and Petroleum
- 5.1.4.3.4 Industrial
- 5.1.4.3.5 Paints and Coatings
- 5.1.4.3.6 Other End-use Industry
- 5.1.4.1 By Material Type
- 5.1.1 Plastic Packaging
- 5.2 By Packaging Format
- 5.2.1 Rigid
- 5.2.2 Flexible
- 5.3 By End-Use Industry
- 5.3.1 Food
- 5.3.2 Beverage
- 5.3.3 Pharmaceuticals and Healthcare
- 5.3.4 Personal Care and Cosmetics
- 5.3.5 Industrial
- 5.3.6 E-commerce
- 5.3.7 Other End-use Industry
- 5.4 By Country
- 5.4.1 Egypt
- 5.4.2 Nigeria
- 5.4.3 Kenya
- 5.4.4 South Africa
- 5.4.5 Rest of Africa
6 COMPETITIVE LANDSCAPE
- 6.1 Market Concentration
- 6.2 Strategic Moves
- 6.3 Market Share Analysis
- 6.4 Company Profiles (includes Global Level Overview, Market Level Overview, Core Segments, Financials as available, Strategic Information, Market Rank/Share, Products and Services, Recent Developments)
- 6.4.1 Amcor plc
- 6.4.2 Mondi plc
- 6.4.3 Nampak Ltd
- 6.4.4 Mpact Ltd
- 6.4.5 Tetra Pak International SA
- 6.4.6 Sealed Air Corp.
- 6.4.7 Constantia Flexibles Group GmbH
- 6.4.8 Consol Holdings (Pty) Ltd
- 6.4.9 Astrapak Ltd
- 6.4.10 Foster Packaging International (Pty) Ltd
- 6.4.11 East African Packaging Industries Ltd
- 6.4.12 Bonpak (Pty) Ltd
- 6.4.13 Huhtamaki Oyj
- 6.4.14 Ardagh Group SA
- 6.4.15 Smurfit WestRock
- 6.4.16 Novus Holdings Ltd
- 6.4.17 Greif Inc.
- 6.4.18 Sonoco Products Company
- 6.4.19 Frigoglass SAIC
7 MARKET OPPORTUNITIES AND FUTURE OUTLOOK
- 7.1 White-space and Unmet-Need Assessment

 折疊扇市場 - 全球市場預測 2026-2032
 電子順磁共振(ESR)波譜儀市場規模、佔有率和成長分析:按波譜儀類型、頻段、應用、最終用戶、配置和地區分類-2026-2033年產業預測
 木質合板包裝市場:策略性洞察與預測(2026-2031年)
 西班牙包裝產業:市場佔有率分析、產業趨勢與統計、成長預測(2026-2031)泰國包裝產業:市場佔有率分析、產業趨勢與統計、成長預測(2026-2031)包裝泵和分配器:市場佔有率分析、行業趨勢和統計數據、成長預測(2026-2031 年)
 微波爐適用包裝市場分析及至2035年預測:類型、技術、應用、形狀、材料類型、製程、最終用戶、功能、設備
 2034年纖維基阻隔性包裝市場預測-全球分析(依纖維材料、阻隔塗層、包裝形式、阻隔技術、最終用戶和地區分類)復古包裝市場規模、佔有率、成長、全球產業分析、區域趨勢及2026-2034年預測行動包裝市場規模、佔有率、成長率、全球產業分析、區域分析及未來預測(2026-2034)