


 |
市場調查報告書
商品編碼
2124307
無源光纖網路(PON)設備:市場佔有率分析、產業趨勢與統計及成長預測(2026-2031)Passive Optical Network (PON) Equipment - Market Share Analysis, Industry Trends & Statistics, Growth Forecasts (2026 - 2031) |
||||||

※ 本網頁內容可能與最新版本有所差異。詳細情況請與我們聯繫。
據 Mordor Intelligence 稱,2025 年被動光纖網路設備市值為 352.9 億美元,預計到 2031 年將達到 614.9 億美元,而 2026 年為 387.1 億美元,預測期(2026-2031 年)複合年成長率為 9.70%。
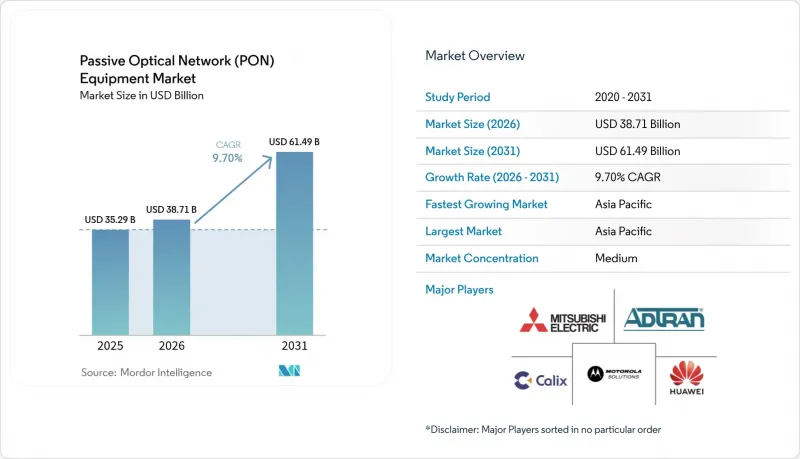
本報告按結構(乙太網路PON設備、GigabitPON設備及其他)、組件(光線路終端設備及其他)、應用(FTTH/FTTx、行動回程/5G傳輸及其他)、終端用戶產業(電信業者/網際網路服務供應商、推動光纖遷移的有線電視業者及其他)及地區進行細分。市場預測以美元計價。
全球無源光纖網路(PON)設備市場趨勢及洞察
XGS-PON 的加速升級正在推動北美地區的現代化進程。
由於XGS-PON具有對稱的10Gbps吞吐量以及可與現有GPON線路共存的組合光學模組, AT&T、Verizon和Brightspeed等美國電信業者正將其置於未來固定接入戰略的核心位置。採購將包括底盤、線路卡和光網路終端(ONT),因此能夠提供優質服務,提升每位用戶平均收入(ARPU)。無源光纖網路設備市場也直接受益,因為每條新的光纖線路都需要中心機房和用戶端設備。標準化的共存光學模組最大限度地減少了切換期間的服務中斷。再加上聯邦政府的寬頻補貼,這一發展動能正在加速資本投資,並鞏固北美作為早期採用者的地位。
政府資助的農村光纖到府計畫正在重塑市場需求。
2024年,全球整體超過1,000億美元的公共工程優先為此前未涵蓋的農村家庭部署光纖網路。開放接取法規和國內採購條款有利於區域供應商和更高的分公司覆蓋率。隨著電信業者面臨長迴路和人口稀少地區的挑戰,遠距離光學模組和耐環境戶外光網路終端(ONT)的重要性日益凸顯。此外,資金籌措投入縮短了建設週期,導致專案週期早期訂單增加。因此,無源光纖網路設備市場的需求正從人口稠密的大都會圈向農村郊區轉移,為中型供應商創造了新的競爭格局。
供應鏈瓶頸限制了ONU的供應。
全球半導體供應失衡導致先進的10G光學模組和SoC的前置作業時間延長,使得XGS-PON ONU的交付時間超過一年。採購資源有限的小型網路服務供應商被迫落後一級營運商,導致用戶服務上線延遲,收入也隨之延後。一些業者為了規避風險,訂購了成本高昂的組合式PON ONT,這進一步推高了組件成本。在持續的地緣政治緊張局勢下,無源光纖網路設備市場正面臨庫存積壓增加和旨在穩定生產的回流舉措。
細分市場分析
目前的收入反映了GPON已確立的市場佔有率,但營運商正在策略性地投資下一代平台。到2025年,GPON將佔據最大的市場佔有率,達到被動光纖網路設備市場的39.90%。儘管對新的家庭連接目標的需求仍然強勁,但頻寬的成長曲線正促使營運商規劃XGS-PON的疊加部署,並在人口密集的大都會圈擴大試點50G-PON部署。供應商在單條線路卡上提供組合光學模組,幫助營運商平衡成本和藍圖的確定性,從而在被動光纖網路設備市場維持多標準平衡。在預測期內,50G-PON/NG-PON2設備預計將以10.55%的複合年成長率成長,這一速度可能會在2031年重新平衡預期的市場佔有率格局。
電信業者正利用波長共存技術並行運作GPON和XGS-PON,在用戶流失率調整至與客戶升級計畫相符之前,維持分路器和光網路終端(ONT)的運作。亞太地區在50G-PON的概念驗證(PoC)方面主導,而美國營運商則計劃從2026年開始試點運營,以應對上行流量的成長。對稱寬頻相關的政策要求也在指南技術選擇。因此,無源光纖網路設備市場正朝著分層架構而非整體設備更換的方向發展,採用熱插拔光學模組的模組化底盤更受青睞。
預計到2025年,OLT底盤和線路卡將佔無源光纖網路設備市場的46.05%,凸顯其作為聚合智慧的關鍵作用。每個OLT連接埠最多可服務128個用戶家庭,雖然設備數量不多,但其對收入的貢獻卻極為顯著。目前,功能差異化主要集中在開放API、SDN代理和AI驅動的功率擴展上,這些特性正在推動無源光纖網路設備市場軟體的普及。隨著光纖網路的擴展和設備更換週期的縮短,ONT/ONU的出貨量正以10.88%的複合年成長率成長。
組件發展趨勢正轉向現成的晶片設計和可插拔光學模組,這使得白盒供應商能夠擴大市場佔有率。解耦式 OLT 架構將控制平面與資料平面分離,使營運商能夠採購現成的刀片式交換器和第三方軟體,這種模式已在資料中心得到驗證。被動式分路器、衰減器和 WDM 耦合器仍然至關重要,但正迅速走向商品化,利潤率逐漸轉移到智慧晶片和控制軟體上。因此,提供具有開放介面的端到端生態系統的供應商在被動光纖網路設備市場中獲得了優勢。
區域分析
亞太地區受惠於中國全國範圍內的光纖到戶(FTTR)推廣,目前已擁有3,000萬用戶,預計到2025年將佔38.40%的銷售佔有率,成為全球最大的光纖網路銷售市場。區域政策將光纖定位為戰略基礎設施,並不斷擴大稅收優惠和低利率貸款,從而為本土供應商帶來規模經濟效益。印度和印尼效仿中國模式,力爭2030年實現住宅用戶兩位數的年成長率,也將推動無源光纖網路設備出貨量實現兩位數的成長。
在北美,資金的注入推動了寬頻市場的快速成長。根據《基礎建設投資與就業法案》,政府撥款650億美元用於寬頻發展。一級電信業者正在加速向農村和郊區部署XGS-PON,而公共產業合作社則採用PON來實現收入來源多元化。供應商多元化是一個顯著趨勢,營運商會將訂單分散到至少兩家供應商,以降低地緣政治和供應鏈風險。諸如每用戶功耗和可回收性等永續性指標現已納入RFP(徵求提案)評估標準,從而影響整個被動光纖網路設備市場的供應商發展藍圖。
在歐洲,由於歐洲投資銀行(EIB)的貸款支持和對綠色網路設計的重視,市場正保持穩定成長。強制性開放接取推動了批發光纖模式的發展,各網際網路服務供應商(ISP)也積極租賃光纖線路終端(OLT)連接埠。在中東和非洲(MEA)等新興市場以及拉丁美洲的關鍵地區,各國政府正在製定優先發展光纖骨幹網的數位經濟藍圖,但短期需求受到資金限制和熟練技術人員短缺的限制。儘管如此,波灣合作理事會(GCC)成員國的先導計畫正在建立Gigabit網路,並在全部區域不斷擴展,為無源光纖網路設備市場的多元化成長奠定了基礎。
其他好處
- Excel格式的市場預測(ME)表
- 3個月的分析師支持
目錄
第1章:引言
- 研究假設和市場定義
- 調查範圍
第2章:調查方法
第3章執行摘要
第4章 市場狀況
- 市場概覽
- 市場促進因素
- 北美地區對 XGS-PON 的升級正在加速進行中。
- 政府資助的農村光纖到府部署
- 50G-PON的標準化和初步示範實驗
- 節能型「組合式PON」OLT的設計
- 在校園和資料中心部署專用POL(無源光區域網路)
- 雲端管理的解耦式OLT的快速普及
- 市場限制因素
- 供不應求
- 發展中地區光纖連接技術技術純熟勞工短缺
- 遺留銅/氫氟碳化物資產的減損風險
- 圍繞特定廠商 OLT韌體的網路安全問題
- 監理情勢
- 技術展望
- 波特五力分析
第5章 市場規模與成長預測
- 按結構
- 乙太網路PON(EPON)設備
- Gigabit光網路(GPON)設備
- 10G-PON/XGS-PON 設備
- 50G-PON/NG-PON2 設備
- 按組件
- 光網路終端(OLT)
- 光纖網路終端(ONT/ONU)
- 分波多工/解復用設備
- 光功率分配器耦合器
- 光纜和被動連接設備
- 透過使用
- FTTH/FTTx
- 行動回程和5G傳輸
- 無源光區域網路 (POL) - 適用於企業
- 智慧城市物聯網基礎設施
- 其他
- 按最終用戶行業分類
- 電信營運商和網際網路服務供應商
- 有線電視營運商正在推動光纖通訊的過渡。
- 企業和資料中心
- 政府與國防網路
- 其他終端用戶產業
- 按地區
- 北美洲
- 南美洲
- 歐洲
- 亞太地區
- 中東和非洲
第6章 競爭情勢
- 市場集中度
- 策略趨勢
- 市佔率分析
- 公司簡介
- ADTRAN Inc.
- Calix Inc.
- Huawei Technologies Co., Ltd.
- Nokia Corp.
- ZTE Corp.
- Cisco Systems Inc.
- Ciena Corp.
- DZS Inc.
- FiberHome Telecom Tech. Group
- Broadcom Inc.
- NEC Corp.
- Mitsubishi Electric Corp.
- Ericsson AB
- CommScope Holding Co. Inc.
- Radisys Corp.
- Iskratel dd
- STL Technologies Ltd.
- Juniper Networks Inc.
- Verizon Communications Inc.
- Tellabs Enterprises LLC
- Motorola Solutions, Inc.
第7章 市場機會與未來展望
According to Mordor Intelligence, the passive optical network equipment market size was valued at USD 35.29 billion in 2025 and estimated to grow from USD 38.71 billion in 2026 to reach USD 61.49 billion by 2031, at a CAGR of 9.70% during the forecast period (2026-2031).
This report is Segmented by Structure (Ethernet PON Equipment, Gigabit PON Equipment, and More), Component (Optical Line Terminal, and More), Application (FTTH/FTTx, Mobile Backhaul and 5G Transport, and More), End-User Vertical (Telecom Operators and ISPs, Cable MSOs Transitioning To Fibre, and More), and Geography. The Market Forecasts are Provided in Terms of Value (USD).
Global Passive Optical Network (PON) Equipment Market Trends and Insights
Accelerating XGS-PON Upgrades Drive North American Modernization
U.S. carriers such as AT&T, Verizon, and Brightspeed have placed XGS-PON at the center of their future fixed-access blueprints, citing symmetric 10 Gbps throughput and combo optics that coexist with installed GPON lines. Procurement spans chassis, line cards, and ONTs, enabling premium-tier offerings that lift average revenue per user. The Passive Optical Network Equipment market benefits directly because each new fiber location requires both central-office and customer-premises gear. Standardized coexistence optics minimize service disruption during cutovers. Coupled with federal broadband subsidies, the momentum pulls forward capital outlays and cements North America as an early adopter hub.
Government-Funded Rural FTTH Programs Reshape Demand
Public programs exceeding USD 100 billion globally in 2024 moved unserved rural households to the front of fiber deployment queues. Open-access rules and domestic-content clauses favor regional vendors and higher split ratios. Extended-reach optics and hardened outdoor ONTs gain relevance as operators confront long loops and sparse populations. Funding schedules also compress build timelines, propelling order volumes earlier in project cycles. The Passive Optical Network Equipment market therefore sees geographic demand redistribution from dense metros to rural fringes, creating a fresh competitive arena for mid-tier suppliers.
Supply-Chain Bottlenecks Constrain ONU Availability
Global semiconductor imbalances stretch lead times for advanced 10G optics and SoCs, pushing delivery windows for XGS-PON ONUs past one year. Smaller ISPs lacking procurement clout queue behind tier-1 carriers, holdup subscriber activations, and postpone revenue. Some operators hedge by ordering higher-cost combo-PON ONTs, raising bill-of-materials. As geopolitical tensions linger, the Passive Optical Network Equipment market contends with elevated inventory buffers and re-shoring initiatives aimed at stabilizing output.
Other drivers and restraints analyzed in the detailed report include:
- 50G-PON Standardization Accelerates Next-Generation Planning
- Energy-Efficient Combo-PON Designs Address Sustainability Mandates
- Skilled-Labor Shortages Slow Fiber Builds
For complete list of drivers and restraints, kindly check the Table Of Contents.
Segment Analysis
Current revenues reflect GPON's entrenched footprint, yet operators are strategically funding next-gen platforms. In 2025, GPON captured the largest 39.90% slice of Passive Optical Network Equipment market size. Demand is still healthy for greenfield homes-passed targets, but bandwidth growth curves push carriers to schedule XGS-PON overlays and, increasingly, pilot 50G-PON for dense metros. Vendors that ship combo optics on a single line card help operators balance cost with roadmap certainty, sustaining the Passive Optical Network Equipment market's multi-standard equilibrium. Over the outlook period, 50G-PON/NG-PON2 equipment scales at a 10.55% CAGR, a pace that recalibrates forecast share mixes by 2031.
Operators leverage wavelength coexistence to run GPON and XGS-PON concurrently, preserving splitters and ONTs until churn aligns with customer upgrade plans. Asia Pacific leads 50G-PON proof-of-concepts, while U.S. providers eye trials starting 2026 to keep ahead of upstream traffic deltas. Policy mandates for symmetrical broadband also steer technology selections. Consequently, the Passive Optical Network Equipment market exhibits a layered architecture path rather than wholesale swap-outs, favoring modular chassis with hot-swappable optics.
In 2025, OLT chassis and line cards realized 46.05% of Passive Optical Network Equipment market size, underscoring their pivotal role as aggregation intelligence. Each OLT port serves up to 128 premises, translating to outsized dollar contribution despite lower unit counts. Feature differentiation now centers on open APIs, SDN agents, and AI-powered power scaling, attributes that boost software attach rates inside the Passive Optical Network Equipment market. ONT/ONU shipments rise at an 10.88% CAGR as fiber builds expand footprints and device refresh cycles shorten.
The component landscape tilts toward merchant-silicon designs and pluggable optics, enabling white-box vendors to gain share. Disaggregated OLT architectures decouple control and data planes, allowing operators to source merchant blades and third-party software, a model already proven in data centers. Passive splitters, attenuators, and WDM couplers remain essential but commoditize rapidly, channeling margin pool shifts toward intelligent silicon and control software. As a result, the Passive Optical Network Equipment market rewards suppliers offering end-to-end ecosystems with open interfaces.
Complete Report Scope:
- By Structure
- Ethernet PON (EPON) Equipment
- Gigabit PON (GPON) Equipment
- 10 G PON / XGS-PON Equipment
- 50 G PON and NG-PON2 Equipment
- By Component
- Optical Line Terminal (OLT)
- Optical Network Terminal (ONT/ONU)
- Wavelength Division Mux/Demux
- Optical Power Splitters and Couplers
- Optical Cables and Passive Connectivity
- By Application
- FTTH / FTTx
- Mobile Backhaul and 5G Transport
- Passive Optical LAN (POL) / Enterprise
- Smart City and IoT Infrastructure
- Other Applications
- By End-User Vertical
- Telecom Operators and ISPs
- Cable MSOs transitioning to fibre
- Enterprises and Data Centres
- Government and Defense Networks
- Other End-User Verticals
- By Geography
- North America
- South America
- Europe
- Asia Pacific
- Middle East and Africa
Geography Analysis
Asia Pacific contributed the largest 38.40% share of 2025 revenues, buoyed by China's nationwide FTTR push that already counts 30 million subscribers. Regional policies that classify fiber as strategic infrastructure extend tax incentives and low-interest financing, giving domestic vendors scale advantages. India and Indonesia follow China's template, targeting double-digit home-pass-adds annually through 2030, which sustains double-digit shipment volumes for the Passive Optical Network Equipment market.
North America enjoys a funding-fueled surge as the Infrastructure Investment and Jobs Act allocates USD 65 billion toward broadband builds. Tier-1 carriers accelerate XGS-PON roll-outs to rural and urban fringe areas, while utility cooperatives deploy PON to diversify revenue. Vendor diversification is a salient theme; operators split awards across at least two suppliers to mitigate geopolitical and supply-chain risk. Sustainability metrics, such as watt-per-subscriber and recyclability, now factor into RFP scoring, influencing vendor roadmaps across the Passive Optical Network Equipment market.
Europe maintains steady growth, supported by European Investment Bank loans and an emphasis on green network design. Open-access mandates stimulate wholesale fiber models, encouraging competitive ISPs to rent OLT ports. In emerging MEA and Latin American corridors, governments draft digital-economy blueprints that prioritize fiber backbones, but currency constraints and technician shortages temper near-term volumes. Nevertheless, pilot projects in Gulf Cooperation Council nations showcase gigabit communities that will scale regionally, adding diverse growth legs for the Passive Optical Network Equipment market.
- ADTRAN Inc.
- Calix Inc.
- Huawei Technologies Co., Ltd.
- Nokia Corp.
- ZTE Corp.
- Cisco Systems Inc.
- Ciena Corp.
- DZS Inc.
- FiberHome Telecom Tech. Group
- Broadcom Inc.
- NEC Corp.
- Mitsubishi Electric Corp.
- Ericsson AB
- CommScope Holding Co. Inc.
- Radisys Corp.
- Iskratel d.d.
- STL Technologies Ltd.
- Juniper Networks Inc.
- Verizon Communications Inc.
- Tellabs Enterprises LLC
- Motorola Solutions, Inc.
Additional Benefits:
- The market estimate (ME) sheet in Excel format
- 3 months of analyst support
TABLE OF CONTENTS
1 INTRODUCTION
- 1.1 Study Assumptions and Market Definition
- 1.2 Scope of the Study
2 RESEARCH METHODOLOGY
3 EXECUTIVE SUMMARY
4 MARKET LANDSCAPE
- 4.1 Market Overview
- 4.2 Market Drivers
- 4.2.1 Accelerating XGS-PON upgrades in North America
- 4.2.2 Government-funded rural FTTH roll-outs
- 4.2.3 50 G-PON standardization and early trials
- 4.2.4 Energy-efficient "Combo-PON" OLT designs
- 4.2.5 Private POL (Passive Optical LAN) adoption in campuses and data-centres
- 4.2.6 Rapid uptake of cloud-managed disaggregated OLTs
- 4.3 Market Restraints
- 4.3.1 Short-term XGS-PON ONU supply shortages
- 4.3.2 Skilled-labour scarcity for fibre splicing in developing regions
- 4.3.3 Legacy copper/HFC asset write-off risk
- 4.3.4 Cyber-security concerns around vendor-specific OLT firmware
- 4.4 Regulatory Landscape
- 4.5 Technological Outlook
- 4.6 Porter's Five Forces Analysis
- 4.6.1 Bargaining Power of Suppliers
- 4.6.2 Bargaining Power of Buyers
- 4.6.3 Threat of New Entrants
- 4.6.4 Threat of Substitutes
- 4.6.5 Intensity of Competitive Rivalry
5 MARKET SIZE AND GROWTH FORECASTS (VALUE)
- 5.1 By Structure
- 5.1.1 Ethernet PON (EPON) Equipment
- 5.1.2 Gigabit PON (GPON) Equipment
- 5.1.3 10 G PON / XGS-PON Equipment
- 5.1.4 50 G PON and NG-PON2 Equipment
- 5.2 By Component
- 5.2.1 Optical Line Terminal (OLT)
- 5.2.2 Optical Network Terminal (ONT/ONU)
- 5.2.3 Wavelength Division Mux/Demux
- 5.2.4 Optical Power Splitters and Couplers
- 5.2.5 Optical Cables and Passive Connectivity
- 5.3 By Application
- 5.3.1 FTTH / FTTx
- 5.3.2 Mobile Backhaul and 5G Transport
- 5.3.3 Passive Optical LAN (POL) / Enterprise
- 5.3.4 Smart City and IoT Infrastructure
- 5.3.5 Other Applications
- 5.4 By End-User Vertical
- 5.4.1 Telecom Operators and ISPs
- 5.4.2 Cable MSOs transitioning to fibre
- 5.4.3 Enterprises and Data Centres
- 5.4.4 Government and Defense Networks
- 5.4.5 Other End-User Verticals
- 5.5 By Geography
- 5.5.1 North America
- 5.5.2 South America
- 5.5.3 Europe
- 5.5.4 Asia Pacific
- 5.5.5 Middle East and Africa
6 COMPETITIVE LANDSCAPE
- 6.1 Market Concentration
- 6.2 Strategic Moves
- 6.3 Market Share Analysis
- 6.4 Company Profiles (includes Global level Overview, Market level overview, Core Segments, Financials as available, Strategic Information, Market Rank/Share for key companies, Products and Services, and Recent Developments)
- 6.4.1 ADTRAN Inc.
- 6.4.2 Calix Inc.
- 6.4.3 Huawei Technologies Co., Ltd.
- 6.4.4 Nokia Corp.
- 6.4.5 ZTE Corp.
- 6.4.6 Cisco Systems Inc.
- 6.4.7 Ciena Corp.
- 6.4.8 DZS Inc.
- 6.4.9 FiberHome Telecom Tech. Group
- 6.4.10 Broadcom Inc.
- 6.4.11 NEC Corp.
- 6.4.12 Mitsubishi Electric Corp.
- 6.4.13 Ericsson AB
- 6.4.14 CommScope Holding Co. Inc.
- 6.4.15 Radisys Corp.
- 6.4.16 Iskratel d.d.
- 6.4.17 STL Technologies Ltd.
- 6.4.18 Juniper Networks Inc.
- 6.4.19 Verizon Communications Inc.
- 6.4.20 Tellabs Enterprises LLC
- 6.4.21 Motorola Solutions, Inc.
7 MARKET OPPORTUNITIES AND FUTURE OUTLOOK
- 7.1 White-space and Unmet-Need Assessment

 2026-2030年全球無源光區域網路市場
 全球50G被動光纖網路(PON)設備市場:機會與策略展望(至2035年)
 無源光區域網路市場:2026-2032年全球市場預測(依組件類型、技術、部署類型、組織規模及最終用戶產業分類)
 無源光區域網路市場規模、佔有率和成長分析:按類型、組件、最終用戶和地區分類-2026-2033年產業預測2026年矽光電被動光纖網路(PON)光纖網路單元(ONU)全球市場報告2026年全球25Gigabit無源光纖網路(PON)設備市場報告2026年全球無源光纖網路設備市場報告
 無源光纖網路設備市場 - 全球產業規模、佔有率、趨勢、機會及預測(按結構、組件、地區和競爭格局分類,2021-2031年)
 被動光纖LAN (POL) - 全球市場佔有率和排名、總收入和需求預測(2025-2031 年)
 被動光纖區域網路市場報告:至2031年的趨勢、預測與競爭分析