


 |
市場調查報告書
商品編碼
2124221
印度智慧電視和OTT市場:市場佔有率分析、行業趨勢和統計數據以及成長預測(2026-2031)India Smart TV And OTT - Market Share Analysis, Industry Trends & Statistics, Growth Forecasts (2026 - 2031) |
||||||

※ 本網頁內容可能與最新版本有所差異。詳細情況請與我們聯繫。
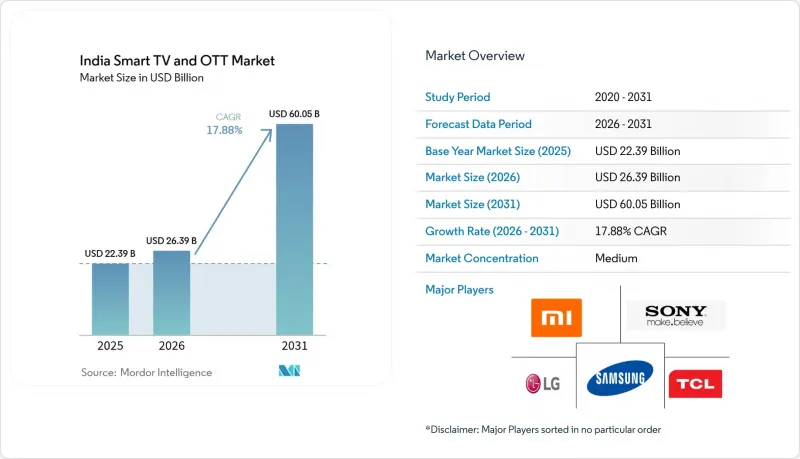
據 Mordor Intelligence 稱,2025 年印度智慧電視和 OTT 市場價值為 223.9 億美元,預計從 2026 年的 263.9 億美元成長到 2031 年的 600.5 億美元,預測期(2026-2031 年)的複合成長率為 17.8%。
本報告按作業系統平台(Android TV、專有Linux、Fire OS、IndOS)、價格區間(印度盧比,60,000起)、螢幕尺寸(32吋以下、33-43吋、44-55吋、55吋以上)、分銷通路(線上、連鎖零售、獨立經銷商)和地區(全國)進行細分。市場預測以美元計價。
印度智慧電視和OTT市場的趨勢和洞察
可支配所得增加和數位化進程的推進
到2024年,印度農村地區的網路用戶數量將超過4.42億,首次超過都市區。這顯示印度智慧電視和OTT市場有更大的潛在需求。 2019年至2021年間,印度綜合貧窮率降至14.96%,家庭可支配所得增加,使他們能夠購買更耐用的家用電器。政府推行的PMGDISHA計畫培訓了約6,400萬公民掌握基本的數位技能,降低了使用智慧電視功能的門檻。每位用戶每月平均無線數據使用量達21.30GB,每GB價格為8.31印度盧比。這比十年前的268.97印度盧比大幅下降,高清和4K串流媒體已成為人們的日常習慣。這些社會經濟變化正在推動印度智慧電視和OTT市場近年來穩步成長。
智慧電視平均售價下降及生產獎勵
由於生產連結獎勵計畫(PLI) 補貼抵消了面板價格的波動,品牌方得以維持其上市價格,即便從 2023 年下半年開始,開放式面板成本上漲了 20%。 Dixon Technologies 進軍價值 6 億美元的顯示模組業務,為更廣泛的供應商生態系統奠定了基礎,韓國組件供應商目前已在在地採購投資 120 億美元。 2025 年 2 月的聯邦預算將開放式面板的關稅降至零,同時維持小尺寸螢幕的低關稅配額。儘管 32 吋以上電視需繳納 28% 的商品及服務稅 (GST),但這仍能保持成本競爭力。這些利多因素使製造商能夠在不犧牲本已微薄的 4-7% 的營業利潤率的情況下,制定更具競爭力的價格,從而在印度智慧電視和 OTT 市場維持了銷量主導成長。
高額消費稅(28%)和麵板關稅
儘管消費者普遍偏好大尺寸電視,但對32吋以上電視徵收28%的商品及服務稅(GST)正促使他們轉向尺寸較小、稅收優惠的電視螢幕。 2025-2026會計年度預算案將互動面板的關稅提高至20%,這給教育和商業領域帶來了壓力,而這兩個領域通常是銷售成長的主要驅動力。 IS 616:2017標準的合格評定導致產品上市週期延遲數週,品牌商爭相獲得多個機構的認證,進一步加劇了成本壓力。這些財務和程序上的摩擦將減緩高級產品的普及,並使印度智慧電視和OTT市場的複合年成長率(CAGR)下降幾個百分點,直到關稅合理化得到更廣泛的落實。
細分市場分析
2025年,Android TV在印度智慧電視和OTT市場佔據了67.38%的主導地位。然而,隨著各邦政府日益重視採購和數據主權,預計到2031年,IndOS的出貨量將以26.85%的複合年成長率成長。這項轉變將主要由JioTele OS推動,該系統於2025年2月發布,整合了針對印度語言最佳化的語音AI和智慧家庭控制面板。在整個預測期內,搭載IndOS的智能電視和OTT設備市場規模預計將快速成長,為本土OEM廠商提供與成熟的全球平台競爭的策略立足點。
開發者認可在地化應用商店的商業性價值,而監管機構則更青睞IndOS提供的高度透明的程式碼審計。如何維持與Android TV龐大應用程式庫相媲美的用戶體驗仍然是一大挑戰。 Fire OS透過整合亞馬遜的內容和支付服務,維持了其利基市場;Tizen和webOS則透過深度軟硬體整合,在高階市場保持了價值;而Linux衍生系統則支援經濟實惠的白牌模式。這種多平台環境正在加劇印度智慧電視和OTT市場的整體功能創新和價格競爭。
到2025年,售價在2萬至4萬印度盧比之間的電視將佔印度智慧電視和OTT市場規模的41.60%。然而,隨著家庭收入的成長,預計到2031年,售價超過6萬印度盧比的電視將以23.70%的複合年成長率成長。生活空間的擴大以及對QLED和OLED等先進顯示技術的需求是推動價格上漲的主要因素。三星在清奈的工廠擴建旨在提高產能,以滿足日益成長的高級產品需求;而小米、TCL和一加則希望在不犧牲價格優勢的前提下,將中階產品的優勢延伸至高階機型。
在2萬印度盧比以下的價位區間,面板成本仍佔組件成本的60-65%,這給利潤率帶來了壓力。 Dixon Technologies的本土面板生產正在減少對進口的依賴,使本土品牌能夠在不相應增加成本的情況下擴展功能。 4萬至6萬印度盧比的價格區間正在成為一個過渡性的“最佳價位”,在這個價位區間,HDR、杜比全景聲和120Hz刷新率等功能已成為價格適中的奢侈品。隨著消費者開始將智慧電視視為可以使用八年的資產,而不僅僅是易耗品,他們越來越願意為耐用性支付溢價,這推動了印度智慧電視和OTT市場的發展。
其他好處
- Excel格式的市場預測(ME)表
- 3個月的分析師支持
目錄
第1章:引言
- 研究假設和市場定義
- 調查範圍
第2章:調查方法
第3章執行摘要
第4章 市場狀況
- 市場概覽
- 市場促進因素
- 可支配所得增加和數位化進程的推進
- 智慧電視平均售價下降及生產獎勵
- 寬頻數據激增和5G部署
- 將內容在地化為 12 種或更多種語言
- 印度電視作業系統(IndOS)的基本標準(報告不足)
- 結合OTT和電子商務的超級應用的發展(報告不足)
- 市場限制因素
- 高額消費稅(28%)和麵板關稅
- 共用盜版遊戲和密碼
- 農村地區輸電網路可靠性低(未充分報告)。
- 5G頻段成本超支(未充分報告)
- 產業價值鏈分析
- 監理情勢
- 技術展望
- 波特五力分析
第5章 市場規模與成長預測
- 作業系統平台
- Android TV
- 專有 Linux(Tizen/WebOS)
- Fire OS
- IndOS(政府支持)
- 按價格範圍(印度盧比)
- 不足20,000
- 2萬至4萬
- 4萬至6萬
- 超過60,000
- 按螢幕尺寸
- 32英吋或更小
- 33-43英寸
- 44-55英寸
- 超過 55 英寸
- 透過分銷管道
- 線上(電子商務)
- 有組織的零售
- 獨立經銷商
第6章 競爭情勢
- 市場集中度
- 策略趨勢
- 市佔率分析
- 公司簡介
- Xiaomi Corporation
- Samsung Electronics Co., Ltd.
- LG Electronics Inc.
- Sony Group Corporation
- TCL Technology Group Corp.
- VU Technologies Private Ltd.
- Honor Device Co., Ltd.
- Panasonic Holdings Corp.
- Haier Smart Home Co., Ltd.
- OnePlus Technology(Shenzhen)Co., Ltd.
- Sansui Electric Co., Ltd.
- Realme Mobile Telecommunications(Shenzhen)Co., Ltd.
- Hisense Visual Technology Co., Ltd.
- Koninklijke Philips NV
- Skyworth Group Co., Ltd.
- Super Plastronics Pvt. Ltd.
- TPV Technology Limited
- Mirc Electronics Limited
- Infinix Mobility Limited
- Acer Incorporated(透過 Indkal Technologies Pvt. Ltd.)
- BPL Limited
第7章 市場機會與未來展望
According to Mordor Intelligence, the India smart TV and OTT market size was valued at USD 22.39 billion in 2025 and estimated to grow from USD 26.39 billion in 2026 to reach USD 60.05 billion by 2031, at a CAGR of 17.88% during the forecast period (2026-2031).
This report is Segmented by OS Platform (Android TV, Proprietary Linux, Fire OS, Indos), Price Band (60k INR), Screen Size (<=32", 33-43", 44-55", >55"), Distribution Channel (Online, Organised Retail, Independent Dealers), and Geography (National Coverage). The Market Forecasts are Provided in Terms of Value (USD).
India Smart TV And OTT Market Trends and Insights
Rising Disposable Income and Digital Adoption
Rural internet users crossed 442 million in 2024, overtaking the urban base for the first time and signalling deeper addressable demand for the India smart TV and OTT market. Multidimensional poverty fell to 14.96% in 2019-21, freeing household budgets for long-life consumer electronics. Government-run PMGDISHA trained nearly 64 million citizens in basic digital skills, lowering entry barriers to smart TV features. Average monthly wireless data use reached 21.30 GB per subscriber at a tariff of INR 8.31 per GB, down from INR 268.97 ten years earlier, making HD and 4K streaming an everyday habit. These socioeconomic shifts underpin consistent multi-year growth momentum for the India smart TV and OTT market.
Falling Smart-TV ASPs and PLI Manufacturing Incentives
PLI reimbursements offset volatile panel prices, allowing brands to hold entry prices even as open-cell costs swung 20% since late-2023. Dixon Technologies' USD 600 million expansion into display modules anchors a broader supplier ecosystem that now includes Korean component vendors investing INR 1,200 crore to localize inputs. The February 2025 Union Budget trimmed customs duty on open cells to zero and preserved a lower slab for smaller screens, preserving cost competitiveness despite a 28% GST on TVs larger than 32 inches. These fiscal tailwinds let manufacturers price aggressively without eroding already thin 4-7% operating margins, sustaining volume-led growth in the India smart TV and OTT market.
High GST and Customs Duties on Panels
The 28% GST slab on televisions beyond 32 inches steers buyers toward tax-efficient smaller screens even though living-room habits favor bigger displays. Customs duty on interactive panels rose to 20% in Budget 2025-26, squeezing education and commercial segments that often ignite volume scale. Compliance testing under IS 616:2017 adds weeks to launch cycles and compounds cost pressure as brands juggle multiple bureau approvals. These fiscal and procedural frictions slow premium uptake and shave points off the India smart TV and OTT market CAGR until duty rationalization gains momentum.
Other drivers and restraints analyzed in the detailed report include:
- Broadband Data Boom and 5G Roll-outs
- Content Localisation in 12+ Languages
- Piracy and Password Sharing
For complete list of drivers and restraints, kindly check the Table Of Contents.
Segment Analysis
Android TV accounted for a dominant 67.38% of the India smart TV and OTT market share in 2025, yet IndOS shipments are forecast to grow at a 26.85% CAGR through 2031 as state procurement and data-sovereignty preferences take hold. This transition is supported by JioTele OS, launched in February 2025, which bundles voice AI and smart-home dashboards optimized for Indic languages. Over the forecast horizon, the India smart TV and OTT market size attached to IndOS devices is set to expand rapidly, providing domestic OEMs a strategic wedge against entrenched global platforms.
Developers recognize commercial upside in localized storefronts, while regulators prefer transparent code audits that IndOS can facilitate. Nonetheless, sustained user experience parity with Android TV's vast app library remains a gating factor. Fire OS keeps a niche by pairing Amazon content and retail wallets, Tizen and webOS preserve value at the premium end through deep hardware-software integration, and Linux derivatives power economical white-label models. The resulting multi-platform landscape intensifies feature innovation and price competition across the India smart TV and OTT market.
Televisions priced between 20,000-40,000 INR delivered 41.60% of the India smart TV and OTT market size in 2025, but units costing over 60,000 INR are projected to clock a 23.70% CAGR to 2031 as household incomes climb. Larger living spaces and demand for advanced display technologies such as QLED and OLED underpin this upward migration. Samsung's Chennai expansion aligns capacity with premium appetite, while Xiaomi, TCL, and OnePlus seek to stretch mid-range DNA upward without losing price sensitivity.
Margin pressure plagues the sub-20,000 INR tier because open-cell prices still represent 60-65% of the bill-of-materials. Domestic fabrication of panels by Dixon eases dependency on imports, allowing local brands to widen feature sets without proportionate cost hikes. The 40,000-60,000 INR tranche emerges as a transitional sweet spot where HDR, Dolby Atmos, and 120 Hz refresh rates become affordable luxury. As consumers increasingly treat smart TVs as eight-year assets rather than discretionary gadgets, their willingness to pay a premium for longevity fuels the India smart TV and OTT market.
Complete Report Scope:
- By OS Platform
- Android TV
- Proprietary Linux (Tizen/WebOS)
- Fire OS
- IndOS (Gov-backed)
- By Price Band (INR)
- < 20 k
- 20 k - 40 k
- 40 k - 60 k
- > 60 k
- By Screen Size
- <=32"
- 33 - 43"
- 44 - 55"
- > 55"
- By Distribution Channel
- Online (e-commerce)
- Organised Retail
- Independent Dealers
List of Companies Covered in this Report:
- Xiaomi Corporation
- Samsung Electronics Co., Ltd.
- LG Electronics Inc.
- Sony Group Corporation
- TCL Technology Group Corp.
- VU Technologies Private Ltd.
- Honor Device Co., Ltd.
- Panasonic Holdings Corp.
- Haier Smart Home Co., Ltd.
- OnePlus Technology (Shenzhen) Co., Ltd.
- Sansui Electric Co., Ltd.
- Realme Mobile Telecommunications (Shenzhen) Co., Ltd.
- Hisense Visual Technology Co., Ltd.
- Koninklijke Philips N.V.
- Skyworth Group Co., Ltd.
- Super Plastronics Pvt. Ltd.
- TPV Technology Limited
- Mirc Electronics Limited
- Infinix Mobility Limited
- Acer Incorporated (via Indkal Technologies Pvt. Ltd.)
- BPL Limited
Additional Benefits:
- The market estimate (ME) sheet in Excel format
- 3 months of analyst support
TABLE OF CONTENTS
1 INTRODUCTION
- 1.1 Study Assumptions and Market Definition
- 1.2 Scope of the Study
2 RESEARCH METHODOLOGY
3 EXECUTIVE SUMMARY
4 MARKET LANDSCAPE
- 4.1 Market Overview
- 4.2 Market Drivers
- 4.2.1 Rising disposable income and digital adoption
- 4.2.2 Falling smart-TV ASPs and PLI manufacturing incentives
- 4.2.3 Broadband data boom and 5G roll-outs
- 4.2.4 Content localisation in 12+ languages
- 4.2.5 Mandatory India TV OS (IndOS) standard (under-reported)
- 4.2.6 Super-app bundling of OTT + e-commerce (under-reported)
- 4.3 Market Restraints
- 4.3.1 High GST (28 %) and customs duties on panels
- 4.3.2 Piracy and password sharing
- 4.3.3 Rural grid-power unreliability (under-reported)
- 4.3.4 5 G spectrum cost overhang (under-reported)
- 4.4 Industry Value-Chain Analysis
- 4.5 Regulatory Landscape
- 4.6 Technological Outlook
- 4.7 Porter's Five Forces Analysis
- 4.7.1 Threat of New Entrants
- 4.7.2 Bargaining Power of Buyers
- 4.7.3 Bargaining Power of Suppliers
- 4.7.4 Threat of Substitutes
- 4.7.5 Competitive Rivalry
5 MARKET SIZE AND GROWTH FORECASTS
- 5.1 By OS Platform
- 5.1.1 Android TV
- 5.1.2 Proprietary Linux (Tizen/WebOS)
- 5.1.3 Fire OS
- 5.1.4 IndOS (Gov-backed)
- 5.2 By Price Band (INR)
- 5.2.1 < 20 k
- 5.2.2 20 k - 40 k
- 5.2.3 40 k - 60 k
- 5.2.4 > 60 k
- 5.3 By Screen Size
- 5.3.1 <=32"
- 5.3.2 33 - 43"
- 5.3.3 44 - 55"
- 5.3.4 > 55"
- 5.4 By Distribution Channel
- 5.4.1 Online (e-commerce)
- 5.4.2 Organised Retail
- 5.4.3 Independent Dealers
6 COMPETITIVE LANDSCAPE
- 6.1 Market Concentration
- 6.2 Strategic Moves
- 6.3 Market Share Analysis
- 6.4 Company Profiles (includes Global level Overview, Market level overview, Core Segments, Financials as available, Strategic Information, Market Rank/Share for key companies, Products and Services, and Recent Developments)
- 6.4.1 Xiaomi Corporation
- 6.4.2 Samsung Electronics Co., Ltd.
- 6.4.3 LG Electronics Inc.
- 6.4.4 Sony Group Corporation
- 6.4.5 TCL Technology Group Corp.
- 6.4.6 VU Technologies Private Ltd.
- 6.4.7 Honor Device Co., Ltd.
- 6.4.8 Panasonic Holdings Corp.
- 6.4.9 Haier Smart Home Co., Ltd.
- 6.4.10 OnePlus Technology (Shenzhen) Co., Ltd.
- 6.4.11 Sansui Electric Co., Ltd.
- 6.4.12 Realme Mobile Telecommunications (Shenzhen) Co., Ltd.
- 6.4.13 Hisense Visual Technology Co., Ltd.
- 6.4.14 Koninklijke Philips N.V.
- 6.4.15 Skyworth Group Co., Ltd.
- 6.4.16 Super Plastronics Pvt. Ltd.
- 6.4.17 TPV Technology Limited
- 6.4.18 Mirc Electronics Limited
- 6.4.19 Infinix Mobility Limited
- 6.4.20 Acer Incorporated (via Indkal Technologies Pvt. Ltd.)
- 6.4.21 BPL Limited
7 MARKET OPPORTUNITIES AND FUTURE OUTLOOK

 美國智慧電視:市場佔有率分析、產業趨勢與統計及成長預測(2026-2031 年)智慧電視:市場佔有率分析、產業趨勢與統計及成長預測(2026-2031)智慧電視OTT串流:市場佔有率分析、產業趨勢與統計、成長預測(2026-2031年)
 智慧電視市場:2026-2032年全球市場預測(依顯示技術、螢幕大小、解析度、銷售管道和應用分類)
 智慧電視市場:按螢幕大小、顯示技術、作業系統和地區分類網路電視市場:2026年至2032年全球預測(依顯示技術、解析度、螢幕大小、作業系統和應用程式分類)
 2026年全球體育賽事線上影片市場報告智慧電視晶片市場:按類型、解析度、最終用戶和地區分類
 智慧電視市場分析及預測(至2035年):依類型、產品類型、技術、組件、應用、功能、安裝類型、最終用戶及模式分類
 全球智慧電視市場規模、佔有率、趨勢和成長分析報告(2026-2034)