


 |
市場調查報告書
商品編碼
2122755
智慧電視:市場佔有率分析、產業趨勢與統計及成長預測(2026-2031)Smart TV - Market Share Analysis, Industry Trends & Statistics, Growth Forecasts (2026 - 2031) |
||||||

※ 本網頁內容可能與最新版本有所差異。詳細情況請與我們聯繫。
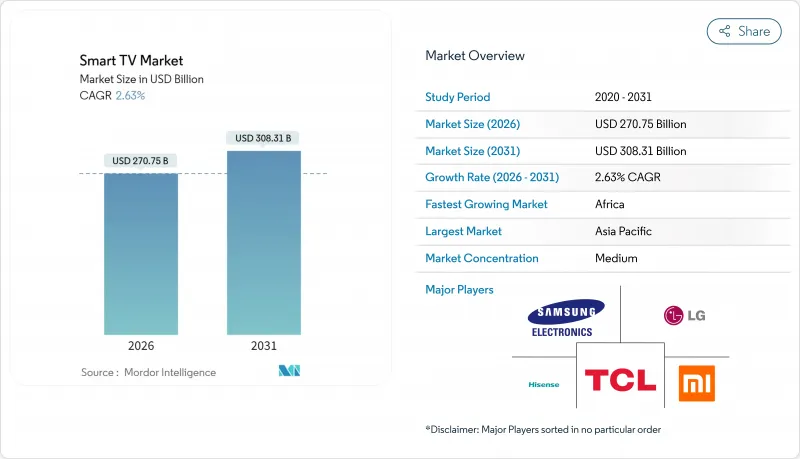
根據 Mordor Intelligence 預測,智慧電視市場規模預計將在 2026 年達到 2,707.5 億美元,到 2031 年達到 3,083.1 億美元,在此期間的複合年成長率為 2.63%。
本報告按解析度(高清/全高清、4K 超高清、8K 超高清)、螢幕大小(32 吋以下、33-45 吋、46-55 吋及其他)、面板/顯示技術(LED/LCD、OLED、QLED、Mini-LED 及其他)、螢幕類型(平面、曲面)、作業系統(Android TV、專有系統/其他線、LED 及其他)市場預測以美元計價。
全球智慧電視市場趨勢及洞察
55-65吋4K電視價格下降
憑藉中國10.5代和11代面板工廠的供應,55吋4K液晶面板的價格將在2025年第二季降至100美元以下,屆時印度和巴西的零售商可以將成品價格定在300美元以下。目前,二線城市首次購屋者的家庭收入已超過5,000美元,消費者更傾向於選擇入門級智慧電視而非小尺寸手機螢幕。儘管平均售價(ASP)有所下降,但TCL和海信憑藉其子公司華星光電(CSOT)和京東方(BOE)的產能,仍能維持利潤率。同時,三星和LG正引導消費者選擇其OLED和Mini-LED產品線,以維持8%以上的營業利潤率。雖然銷量成長主要集中在46-55吋機型,但受雲端遊戲和體育賽事直播的推動,營收成長正轉向65吋及以上的高階市場。成熟市場的更換週期已延長至八年,單憑畫質的輕微提升已不足以促使消費者即時更換。
電信業者主導的光纖部署
2025年底,全球光纖到府(FTTH)用戶數將達到5.2億。這主要得益於歐盟根據《Gigabit基礎設施法案》部署的1800萬個連接,以及美國透過「寬頻股權計畫」部署的1,200萬條線路。對稱的Gigabit速度消除了4K串流媒體播放的緩衝問題,並支援多設備同時使用,重新定義了電視作為家庭娛樂核心的地位。電信公司正在銷售捆綁24個月合約的補貼智慧電視,旨在透過硬體折扣換取可預測的ARPU(每位用戶平均收入)成長。這種策略在付費電視市場規模較小的地區尤其有效。現有有線電視業者正與整合廣播和IP串流媒體的Android TV和Roku機上盒競爭,但整合智慧電視具有更優越的價值提案。隨著光纖覆蓋範圍的擴大,串流媒體平台透過確保直接存取設備並縮短註冊流程,進一步增強了硬體和內容的良性循環。
Mini-LED背光所需的半導體供應緊張
Mini-LED電視包含1萬至2萬個二極體,每個二極體都需要一個驅動IC,這些IC主要採用台積電的28nm製程製造。該工藝也應用於汽車和工業領域。 2025年上半年,Mini-LED的前置作業時間長達18週,迫使TCL和海信將Mini-LED的出貨量削減至其總出貨量的9%。量子點薄膜也面臨類似的限制,在2027年後新生產線運作前,其年產能僅1500萬平方公尺。品牌商通常提前九個月預訂面板,這會佔用大量資金,並降低需求波動時的柔軟性。供不應求的影響主要體現在北美和歐洲的高價產品上,在這些市場,Mini-LED與OLED直接競爭高ARPU(每用戶平均收入)客戶群。
細分市場分析
預計到2025年,4K超高清面板將占到總銷量的65.66%,從而鞏固智慧電視在主流螢幕大小中的市場佔有率。同時,8K超高清面板預計到2031年將保持4.56%的複合年成長率,這主要得益於日本和韓國的早期用戶對2026年FIFA世界盃預選賽的熱情。儘管8K智慧電視的市場規模仍然較小,但由於人工智慧技術的應用以及與次世代遊戲主機的促銷合作,人們對其價值的認知正在不斷提高。雖然歐盟二級能源效率標準會使組件成本增加30至40美元,但著眼於未來的高階消費者願意接受更高的價格。
針對4K裁切最佳化的10.5代晶圓廠在8K面板生產中面臨良率下降的困境,迫使供應商將8K面板的尺寸限制在75英寸及以上,以期通過更高的平均售價彌補運轉率的降低。串流平台並未優先考慮原生8K,因為用戶的付費意願不足以抵消頻寬成本,而影像升頻引擎只是權宜之計。儘管如此,精通科技的家庭用戶仍然將8K電視視為一款經久耐用的核心產品,支撐著雖不大但穩定的需求。
到2025年,46-55英寸尺寸的電視將佔總銷量的36.78%,但65英寸及以上尺寸的機械式電視正以2.92%的複合年成長率快速成長,這主要得益於北美開放式住宅的普及,因為北美地區的觀看距離通常為12英尺(約3.7米)。三星的98吋「Neo QLED」電視和LG的97吋OLED電視售價均超過25,000美元,即使不使用遮光窗簾,也能提供媲美投影機的沉浸式體驗。
面板製造商正將第10.5代玻璃的配比重點放在75吋和85吋的面板上,預計良率將從2023年的35%提升至2025年的48%。 75吋4K電視的零售價將在2025年跌破800美元,加速中型電視轉向大尺寸電視的轉變。隨著平板電腦滿足了人們的休閒觀看需求,32吋及以下尺寸的電視將繼續以2.1%的複合年成長率下滑。
區域分析
預計到2025年,亞太地區將佔全球銷售額的47.32%,主要得益於中國5,200萬台和印度1,800萬台的出貨量。由於中國家庭電視普及率已接近飽和(98%),成長主要集中在面向第一線都市區用戶的65吋以上尺寸電視。印度受益於本地生產的激勵措施和中等收入家庭數量的成長,其進口依賴度已降至34%。目前,印度工廠向東南亞出口的電視產品價格低於400美元,滿足了市場需求,並擴大了在該地區的影響力。
非洲是成長最快的地區,預計到2031年複合年成長率將達到3.12%,主要得益於奈及利亞新增的1,200萬條光纖連接以及埃及面板產品的免稅進口。基於行動支付的信貸方案正在擴大潛在需求,使首次購機者能夠以18個月的分期付款方式購買32-43吋的智慧電視。各大品牌正與金融科技貸款機構合作,提供捆綁式循環資料通訊流量套餐,將違約風險控制在2%以下,並提高每位用戶平均收入(ARPU)。
預計到2025年,北美將佔據22.4%的市場佔有率,但其複合年成長率僅為2.1%,主要受串流媒體電視棒使用壽命較長和8年更換週期的限制。然而,65吋以上OLED和Mini-LED電視的銷量在高所得家庭中依然強勁,他們追求沉浸式的體育和遊戲體驗。歐洲的市佔率(18.6%)也處於類似的成熟階段,二級能源效率法規的實施增加了8K電視的合規成本。南美(6.8%)正受益於南方共同市場(Mercosur)的關稅減免政策,而中東(4.9%)預計波灣合作理事會(GCC)成員國中可支配收入超過4萬美元的家庭將對65英寸以上的OLED電視產生需求。
其他好處
- Excel格式的市場預測(ME)表
- 3個月的分析師支持
目錄
第1章:引言
- 研究假設和市場定義
- 調查範圍
第2章:調查方法
第3章執行摘要
第4章 市場狀況
- 市場概覽
- 市場促進因素
- 55-65吋4K電視價格下降
- 電信業者主導的光纖部署
- 快速通道整合
- 雲端遊戲合作正在推動 120Hz 電視的普及。
- 印度政府為在地化提供的支援措施
- 事項認證互通性
- 市場限制因素
- Mini-LED背光所需的半導體供應緊張
- 分段式作業系統生態系統
- 歐盟二級8K電視能效標準
- 低成本串流加密狗延長了更換週期。
- 產業價值鏈分析
- 宏觀經濟因素對市場的影響
- 監理情勢
- 技術展望
- 波特五力分析
第5章 市場規模與成長預測
- 通過決議
- 高清/全高清
- 4K UHD
- 8K UHD
- 螢幕大小(英吋)
- 32英吋或更小
- 33-45英寸
- 46-55英寸
- 56-65英寸
- 超過 65 英寸
- 透過面板和顯示技術
- LED/LCD
- OLED
- QLED
- Mini-LED
- Micro-LED
- 透過螢幕格式
- 平坦的
- 弧形字體
- 透過作業系統
- Android TV
- 專有開發及其他
- 透過分銷管道
- 實體店面
- 線上
- 按地區
- 北美洲
- 美國
- 加拿大
- 墨西哥
- 歐洲
- 德國
- 英國
- 法國
- 北歐的
- 其他歐洲國家
- 南美洲
- 巴西
- 其他南美國家
- 亞太地區
- 中國
- 日本
- 印度
- 東南亞
- 其他亞太國家
- 中東
- 波灣合作理事會(GCC)成員國
- 土耳其
- 其他中東國家
- 非洲
- 南非
- 奈及利亞
- 埃及
- 其他非洲地區
- 北美洲
第6章 競爭情勢
- 市場集中度
- 策略趨勢
- 市佔率分析
- 公司簡介
- Samsung Electronics Co., Ltd.
- LG Electronics Inc.
- TCL Technology Group Corp.
- Hisense Group Co., Ltd.
- Xiaomi Corporation
- Sony Group Corporation
- Vizio Holding Corp.
- Panasonic Holdings Corporation
- Sharp Corporation
- TPV Technology Limited(Philips)
- Skyworth Group Ltd.
- Konka Group Co., Ltd.
- Haier Smart Home Co., Ltd.
- Changhong Electric Co., Ltd.
- Toshiba Corporation
- OnePlus Technology(Shenzhen)Co., Ltd.
- VU Technologies Pvt. Ltd.
- Apple Inc.
- Amazon.com Inc.(Fire TV)
- Roku Inc.
第7章 市場機會與未來展望
According to Mordor Intelligence, the smart TV market size stands at USD 270.75 billion in 2026 and is projected to reach USD 308.31 billion by 2031, reflecting a 2.63% CAGR over the period.
This report is Segmented by Resolution (HD/Full HD, 4K UHD, and 8K UHD), Screen Size (Up To 32 Inch, 33-45 Inch, 46-55 Inch, and More), Panel/Display Technology (LED/LCD, OLED, QLED, Mini-LED, and More), Screen Shape (Flat, and Curved), Operating System (Android TV, and Other/OEM Proprietary), Distribution Channel (Offline Retail, and Online), and Geography. The Market Forecasts are Provided in Terms of Value (USD).
Global Smart TV Market Trends and Insights
Price Erosion of 55-65 inch 4K Sets
Gen 10.5 and Gen 11 Chinese fabs drove 55-inch 4K LCD panel prices below USD 100 in Q2 2025, letting retailers price finished sets under USD 300 in India and Brazil. First-time buyers in tier-2 cities now cross the USD 5,000 household-income threshold and opt for entry-level smart TVs instead of smaller mobile screens. TCL and Hisense, backed by captive CSOT and BOE capacity, protect margins despite falling ASPs, whereas Samsung and LG steer shoppers toward OLED and Mini-LED lines to hold operating margins above 8%. Unit growth clusters in 46- to 55-inch models, yet revenue gains migrate to 65-inch-plus premium tiers supported by cloud gaming and sports streaming. Replacement cycles in mature markets lengthen to eight years as incrementally better picture quality no longer compels an immediate upgrade.
Telecom-Led Fiber Roll-outs
Global fiber-to-the-home subscriptions reached 520 million by end-2025, propelled by 18 million EU connections under the Gigabit Infrastructure Act and 12 million U.S. lines through the Broadband Equity program. Symmetrical gigabit speeds eliminate buffering on 4K streams and allow simultaneous multi-device usage, repositioning the television as each household's entertainment anchor. Operators bundle subsidized smart TVs with 24-month contracts, trading hardware discounts for predictable ARPU growth, a tactic that works best in low pay-TV markets. Cable incumbents answer with Android TV or Roku-based boxes that unify broadcast and IP streams, but the value proposition favors integrated smart sets. As fiber overlaps expand, streaming platforms secure direct device access and shorten onboarding funnels, reinforcing the hardware-content flywheel.
Semiconductor Tightness for Mini-LED Backlights
Mini-LED TVs pack 10,000-20,000 diodes, each requiring a driver IC produced mainly on TSMC's 28 nm nodes that also serve automotive and industrial clients. Lead times hit 18 weeks in H1 2025, forcing TCL and Hisense to pare Mini-LED output to 9% of shipments. Quantum-dot films face similar constraints because annual capacity is capped at 15 million m2 until new lines start after 2027. Brands pre-order panels nine months ahead, locking capital and curbing flexibility when demand shifts. Shortages primarily depress premium inventory in North America and Europe, where Mini-LED competes directly with OLED for high-ARPU buyers.
Other drivers and restraints analyzed in the detailed report include:
- Integration of FAST Channels
- Cloud-Gaming Partnerships Driving 120 Hz TVs
- Low-Cost Streaming Dongles Extending Replacement Cycles
For complete list of drivers and restraints, kindly check the Table Of Contents.
Segment Analysis
4K UHD panels captured 65.66% revenue in 2025, anchoring the smart TV market share in mainstream screen sizes, whereas 8K UHD is forecast to log a 4.56% CAGR through 2031 as early adopters in Japan and South Korea embrace broadcasts of the 2026 FIFA World Cup qualifiers. The smart TV market size for 8K models remains small, yet AI upscaling and promotional tie-ins with next-gen consoles elevate perceived value. EU Tier-2 energy rules add USD 30-40 to bill-of-materials costs, but premium buyers accept higher prices for future-proofing.
Gen 10.5 fabs optimized for 4K cutting now face lower yields when producing 8K panels, so suppliers confine 8K to 75-inch-plus formats where higher ASPs offset utilization losses. Streaming platforms have not prioritized native 8K because subscriber willingness-to-pay does not match the bandwidth premium, leaving upscaling engines as stopgaps. Even so, tech-savvy households see 8K TVs as long-lived centerpieces, sustaining modest but steady demand.
The 46-55 inch bracket led 2025 revenue at 36.78%, yet units above 65 inches are pacing ahead at a 2.92% CAGR, driven by open-plan North American homes with 12-foot viewing distances. Samsung's 98-inch Neo QLED and LG's 97-inch OLED models, priced beyond USD 25,000, promise projector-class immersion without blackout curtains.
Panel makers tilt Gen 10.5 glass toward 75- and 85-inch cuts, elevating yield efficiency from 35% in 2023 to 48% in 2025. Retail prices for 75-inch 4K sets dropped below USD 800 in 2025, accelerating migration from mid-sizes. Sets below 32 inches continue a 2.1% CAGR decline as tablets address casual viewing needs.
Complete Report Scope:
- By Resolution
- HD / Full HD
- 4K UHD
- 8K UHD
- By Screen Size (Inches)
- Up to 32
- 33-45
- 46-55
- 56-65
- Above 65
- By Panel / Display Technology
- LED / LCD
- OLED
- QLED
- Mini-LED
- Micro-LED
- By Screen Shape
- Flat
- Curved
- By Operating System
- Android TV
- Proprietary and Other
- By Distribution Channel
- Offline Retail
- Online
- By Geography
- North America
- United States
- Canada
- Mexico
- Europe
- Germany
- United Kingdom
- France
- Nordics
- Rest of Europe
- South America
- Brazil
- Rest of South America
- Asia Pacific
- China
- Japan
- India
- South-East Asia
- Rest of Asia Pacific
- Middle East
- Gulf Cooperation Council Countries
- Turkey
- Rest of Middle East
- Africa
- South Africa
- Nigeria
- Egypt
- Rest of Africa
- North America
Geography Analysis
Asia Pacific delivered 47.32% of 2025 revenue, underpinned by China's 52 million unit shipments and India's 18 million units. China's household penetration nears saturation at 98%, so growth skews toward 65-inch-plus sets sold to tier-1 urban users. India benefits from localization incentives and rising mid-income households, reducing import reliance to 34%. Southeast Asian exports from Indian plants now fill price gaps below USD 400, spreading the region's influence.
Africa is the fastest-growing region with a 3.12% CAGR through 2031, led by Nigeria's 12 million new fiber connections and Egypt's duty-free panel imports. Mobile-money credit schemes let first-time buyers finance 32- to 43-inch smart TVs over 18 months, enlarging addressable demand. Brands partner with fintech lenders to cap default risk below 2%, unlocking recurring data-recharge bundles that raise overall ARPU.
North America accounted for 22.4% share in 2025, growing at a modest 2.1% CAGR, constrained by streaming-dongle life-extension and an eight-year replacement cycle. However, 65-inch-plus OLED and Mini-LED sales remain brisk among high-income households seeking immersive sports and gaming experiences. Europe's 18.6% share faces similar maturity, and Tier-2 energy-efficiency rules raise compliance costs on 8K sets. South America (6.8% share) capitalizes on Mercosur tariff reductions, while the Middle East (4.9%) sees above-65-inch OLED demand in Gulf Cooperation Council states where disposable income exceeds USD 40,000.
- Samsung Electronics Co., Ltd.
- LG Electronics Inc.
- TCL Technology Group Corp.
- Hisense Group Co., Ltd.
- Xiaomi Corporation
- Sony Group Corporation
- Vizio Holding Corp.
- Panasonic Holdings Corporation
- Sharp Corporation
- TPV Technology Limited (Philips)
- Skyworth Group Ltd.
- Konka Group Co., Ltd.
- Haier Smart Home Co., Ltd.
- Changhong Electric Co., Ltd.
- Toshiba Corporation
- OnePlus Technology (Shenzhen) Co., Ltd.
- VU Technologies Pvt. Ltd.
- Apple Inc.
- Amazon.com Inc. (Fire TV)
- Roku Inc.
Additional Benefits:
- The market estimate (ME) sheet in Excel format
- 3 months of analyst support
TABLE OF CONTENTS
1 INTRODUCTION
- 1.1 Study Assumptions and Market Definition
- 1.2 Scope of the Study
2 RESEARCH METHODOLOGY
3 EXECUTIVE SUMMARY
4 MARKET LANDSCAPE
- 4.1 Market Overview
- 4.2 Market Drivers
- 4.2.1 Price Erosion of 55-65" 4K Sets
- 4.2.2 Telecom-Led Fiber Roll-outs
- 4.2.3 Integration of FAST Channels
- 4.2.4 Cloud-Gaming Partnerships Driving 120 Hz TVs
- 4.2.5 Government Localization Incentives in India
- 4.2.6 Matter-Certified Interoperability
- 4.3 Market Restraints
- 4.3.1 Semiconductor Tightness for Mini-LED Backlights
- 4.3.2 Fragmented Operating-System Ecosystem
- 4.3.3 EU Tier-2 Energy-Efficiency Rules on 8K Sets
- 4.3.4 Low-Cost Streaming Dongles Extending Replacement Cycles
- 4.4 Industry Value-Chain Analysis
- 4.5 Impact of Macroeconomic Factors on the Market
- 4.6 Regulatory Landscape
- 4.7 Technological Outlook
- 4.8 Porter's Five Forces Analysis
- 4.8.1 Bargaining Power of Suppliers
- 4.8.2 Bargaining Power of Buyers
- 4.8.3 Threat of New Entrants
- 4.8.4 Threat of Substitutes
- 4.8.5 Competitive Rivalry
5 MARKET SIZE AND GROWTH FORECASTS (VALUES)
- 5.1 By Resolution
- 5.1.1 HD / Full HD
- 5.1.2 4K UHD
- 5.1.3 8K UHD
- 5.2 By Screen Size (Inches)
- 5.2.1 Up to 32
- 5.2.2 33-45
- 5.2.3 46-55
- 5.2.4 56-65
- 5.2.5 Above 65
- 5.3 By Panel / Display Technology
- 5.3.1 LED / LCD
- 5.3.2 OLED
- 5.3.3 QLED
- 5.3.4 Mini-LED
- 5.3.5 Micro-LED
- 5.4 By Screen Shape
- 5.4.1 Flat
- 5.4.2 Curved
- 5.5 By Operating System
- 5.5.1 Android TV
- 5.5.2 Proprietary and Other
- 5.6 By Distribution Channel
- 5.6.1 Offline Retail
- 5.6.2 Online
- 5.7 By Geography
- 5.7.1 North America
- 5.7.1.1 United States
- 5.7.1.2 Canada
- 5.7.1.3 Mexico
- 5.7.2 Europe
- 5.7.2.1 Germany
- 5.7.2.2 United Kingdom
- 5.7.2.3 France
- 5.7.2.4 Nordics
- 5.7.2.5 Rest of Europe
- 5.7.3 South America
- 5.7.3.1 Brazil
- 5.7.3.2 Rest of South America
- 5.7.4 Asia Pacific
- 5.7.4.1 China
- 5.7.4.2 Japan
- 5.7.4.3 India
- 5.7.4.4 South-East Asia
- 5.7.4.5 Rest of Asia Pacific
- 5.7.5 Middle East
- 5.7.5.1 Gulf Cooperation Council Countries
- 5.7.5.2 Turkey
- 5.7.5.3 Rest of Middle East
- 5.7.6 Africa
- 5.7.6.1 South Africa
- 5.7.6.2 Nigeria
- 5.7.6.3 Egypt
- 5.7.6.4 Rest of Africa
- 5.7.1 North America
6 COMPETITIVE LANDSCAPE
- 6.1 Market Concentration
- 6.2 Strategic Moves
- 6.3 Market Share Analysis
- 6.4 Company Profiles (includes Global Level Overview, Market Level Overview, Core Segments, Financials as Available, Strategic Information, Market Rank / Share for Key Companies, Products and Services, and Recent Developments)
- 6.4.1 Samsung Electronics Co., Ltd.
- 6.4.2 LG Electronics Inc.
- 6.4.3 TCL Technology Group Corp.
- 6.4.4 Hisense Group Co., Ltd.
- 6.4.5 Xiaomi Corporation
- 6.4.6 Sony Group Corporation
- 6.4.7 Vizio Holding Corp.
- 6.4.8 Panasonic Holdings Corporation
- 6.4.9 Sharp Corporation
- 6.4.10 TPV Technology Limited (Philips)
- 6.4.11 Skyworth Group Ltd.
- 6.4.12 Konka Group Co., Ltd.
- 6.4.13 Haier Smart Home Co., Ltd.
- 6.4.14 Changhong Electric Co., Ltd.
- 6.4.15 Toshiba Corporation
- 6.4.16 OnePlus Technology (Shenzhen) Co., Ltd.
- 6.4.17 VU Technologies Pvt. Ltd.
- 6.4.18 Apple Inc.
- 6.4.19 Amazon.com Inc. (Fire TV)
- 6.4.20 Roku Inc.
7 MARKET OPPORTUNITIES AND FUTURE OUTLOOK
- 7.1 White-Space and Unmet-Need Assessment

 印度智慧電視和OTT市場:市場佔有率分析、行業趨勢和統計數據以及成長預測(2026-2031)美國智慧電視:市場佔有率分析、產業趨勢與統計及成長預測(2026-2031 年)智慧電視OTT串流:市場佔有率分析、產業趨勢與統計、成長預測(2026-2031年)
 智慧電視市場:2026-2032年全球市場預測(依顯示技術、螢幕大小、解析度、銷售管道和應用分類)
 智慧電視市場:按螢幕大小、顯示技術、作業系統和地區分類網路電視市場:2026年至2032年全球預測(依顯示技術、解析度、螢幕大小、作業系統和應用程式分類)
 2026年全球體育賽事線上影片市場報告智慧電視晶片市場:按類型、解析度、最終用戶和地區分類
 智慧電視市場分析及預測(至2035年):依類型、產品類型、技術、組件、應用、功能、安裝類型、最終用戶及模式分類
 全球智慧電視市場規模、佔有率、趨勢和成長分析報告(2026-2034)