

 |
市場調查報告書
商品編碼
2118256
智慧電視OTT串流:市場佔有率分析、產業趨勢與統計、成長預測(2026-2031年)Smart TV OTT Streaming - Market Share Analysis, Industry Trends & Statistics, Growth Forecasts (2026 - 2031) |
||||||

※ 本網頁內容可能與最新版本有所差異。詳細情況請與我們聯繫。
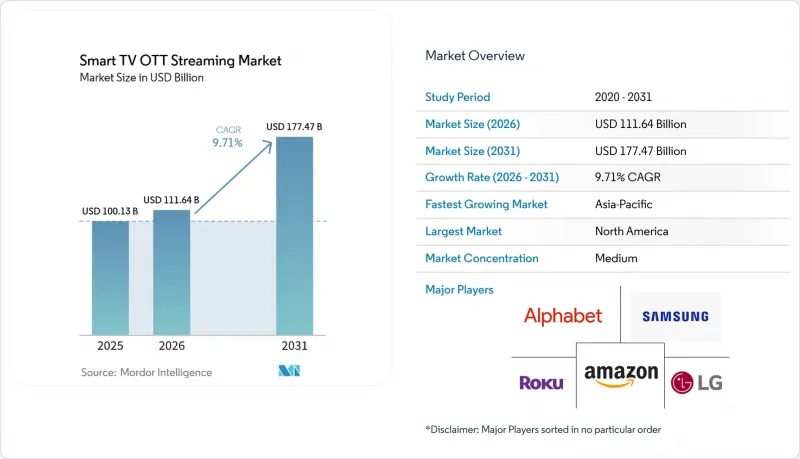
據 Mordor Intelligence 稱,2025 年智慧電視的 OTT 串流市場價值為 1001.3 億美元,預計到 2031 年將達到 1774.7 億美元,而 2026 年為 1116.4 億美元,預測期(2026-2031 年)的複合年成長率為 9.1%。
本報告按串流媒體類型(影片串流媒體和音訊串流)、收入模式(SVOD、TVOD/PPV、AVOD/FAST、混合盈利收費)、廣告形式(影片串流內、程式化聯網電視廣告、品牌內容廣告、購物/2D碼廣告)、內容類型(電影、電視節目和劇集、紀錄片)以及地區進行細分。市場預測以美元計價。
全球智慧電視OTT串流市場趨勢與洞察
高速寬頻與居家Wi-Fi的普及
光纖和5G固定無線存取的部署正在透過改善家庭大螢幕觀看環境,推動智慧電視OTT串流媒體市場的普及。根據電訊(ITU)統計,網路用戶佔世界人口的大多數,而5G用戶在行動寬頻連線中佔據了相當大的佔有率。雖然5G網路已覆蓋全球一半以上的人口,但高所得國家的接取率遠高於低收入國家。 2025年5月,美國聯邦通訊委員會(FCC)報告稱,96%的美國家庭和小規模企業將能夠連接5G行動服務。對光纖和固定無線網路的持續投資正在推動適合長時間電視串流媒體播放的家庭連接的普及。更佳的家庭連線減少了緩衝,延長了智慧電視的觀看時間,從而擴大了平台營運商可用的廣告空間,並使依賴不間斷播放的服務的智慧電視觀看體驗更加穩定。
快速頻道和廣告支援計劃的普及
快速付費(FAST)和廣告支援型套餐正在推動智慧電視OTT串流媒體市場的收入成長。 Amagi公司基於其在FAST頻道交付方面的豐富經驗,報告稱其全球FAST觀看時長和廣告曝光量均實現了強勁的同比成長。該公司的研究也顯示,許多領先的FAST供應商認為元資料重格式化是一項重大的營運負擔,而許多供應商則指出元資料缺陷會降低收入和內容可見度。 IAB預測,數位影片將首次佔據美國電視和影片廣告支出的大部分佔有率。 IAB也預測,美國聯網電視廣告支出將持續年增。這種市場環境有利於能夠跨多個平台管理元資料、廣告決策和交付的供應商。因此,擁有高效內容管理系統的大規模服務將在智慧型電視OTT串流媒體市場中擁有競爭優勢。
分散的電視作業系統生態系統
作業系統碎片化正在限制智慧電視OTT串流媒體市場的傳輸效率。希望拓展北美、歐洲和亞太地區業務的服務商必須在5到7個不同的作業系統環境下保持認證,而這些作業系統的應用程式商店、應用程式介面、廣告工具和技術要求各不相同。這項工作會產生收入分成義務和開發成本,可能會減少可用於內容投資的資金,尤其對於那些缺乏廣泛技術支援的供應商而言更是如此。歐洲的《數位市場法案》也正在影響電視作業系統供應商的政策制定。 2026年3月,歐洲廣播公司要求競爭監管機構評估Android TV、亞馬遜Fire OS和三星Tizen作為潛在「安全隔離網閘。這可能需要確保應用的非歧視性放置和互通性。隨著零售商和廣播集團投資廣告技術和聯網電視平台,作業系統層面的所有權變更可能會導致新的存取控制形式。在這種環境下,能夠整合作業系統、受眾資料、廣告工具和內容存取權限的供應商很可能會保持優勢地位。
細分市場分析
到2025年,影片串流媒體將佔據智慧電視OTT串流媒體市場85.22%的佔有率。智慧電視專為大螢幕影片播放而設計,支援觀看體育賽事直播、劇情類節目、紀錄片等。從傳統電視向串流媒體服務的轉變正在推動連網螢幕影片內容的成長。此外,人們在家中共用和觀看電視的習慣也促進了影片內容的成長。因此,影片仍是各大平台觀看時長的主要來源。
預計到2031年,音訊串流媒體將以10.11%的複合年成長率成長。智慧電視正日益成為家庭音樂、播客和有聲讀物的中心,尤其是在不播放影片的時候。播客服務也正在開發適合客廳螢幕的影片格式,從而更好地利用電視的音訊系統。音訊可以為用戶在同一家庭觀看過程中過渡到影片觀看創造機會。將音訊和影片整合到單一介面中的企業可以利用這種行為模式來建立跨格式的互動體驗。
至2025年,定期訂閱收費將佔智慧電視OTT串流市場45.36%的佔有率。儘管消費者越來越擔心管理多個付費服務,但優質原創內容、獨家體育賽事轉播權和無廣告觀看環境仍在推動訂閱需求。 SVOD平台可以透過提供競爭對手服務所沒有的內容來保持其價值。交易收費模式則迎合特定時段的集中需求,例如新上映的優質電影和大型體育賽事直播。混合模式則是針對那些能夠在訂閱主導和廣告主導模式之間切換的服務。
包括AVOD和FAST在內的廣告支援收費模式預計將在2026年至2031年間以10.57%的複合年成長率成長。這是因為這些模式滿足了價格敏感型家庭的需求,並為廣告主提供了一種觸達傳統電視節目無法覆蓋的聯網電視受眾的途徑。 IAB的研究顯示,2026年聯網電視新增投資的54%直接來自線性電視預算的重新分配。雖然營運商配套服務可以提高家庭用戶滲透率,但30%至45%的折扣可能會降低捆綁服務的每位用戶實際收入。因此,儘管智慧電視的AVOD和FAST OTT串流媒體市場規模受到廣告商需求的支撐,但利潤率仍高度依賴捆綁條款。隨著這些經營模式的成熟,營運商必須平衡規模、廣告投放量、收入分成和觀看體驗品質。
區域分析
2025年,北美佔據了全部區域。成熟的寬頻網路、高智慧電視普及率以及線性電視預算向程式化聯網電視的轉移,都支撐了該地區的成長。預計到2026年,美國聯網電視廣告支出將達到293億美元,而數位視訊支出預計將從2021年的390億美元增加到2026年的819億美元。 2026年4月,康卡斯特(Comcast)擴展了其StreamSaver套餐,在其原有的Peacock、Netflix和Apple TV套餐基礎上,新增了Disney+、Hulu和HBO Max,從而加強了運營商主導的服務聚合,並進一步整合了串流媒體服務與家庭寬頻訂閱。加拿大和墨西哥也為該地區的需求做出了貢獻,尤其是在墨西哥,越來越多的家庭正在從付費電視轉向廣告支援型服務,因此對FAST服務的需求仍有很大的成長空間。
預計到2031年,亞太地區的年複合成長率將達到10.49%。在印度,受板球賽事轉播權以及JioHotstar、ZEE5、SonyLIV和亞馬遜等平台競爭的推動,到2025年,每月有效用戶將超過14.5億,三年內成長20%。印尼、泰國、菲律賓、馬來西亞和新加坡的付費串流媒體帳戶數量將年增19%,到2025年將超過6,100萬。同時,越南和菲律賓的市場正透過廣告支援的視訊點播(AVOD)和主導消費模式發展。日本和韓國擁有成熟的觀眾群體,智慧電視普及率不斷提高,並建立了完善的本地內容生態系統。亞洲視訊產業協會(AVIA)預測,到2025年,亞太地區的線上影片收入將達到700億美元,其中中國、日本、澳洲、韓國和印度預計將佔88%。
歐洲仍然是至關重要的市場,這得益於其高智慧電視普及率、對多語言內容的需求以及完善的監管體系。德國、英國、法國、義大利和西班牙是歐洲五大市場,這些市場的免費數位廣播服務和公共廣播公司串流服務都在爭奪付費用戶和快速觀看用戶。 2026年,南美洲的快速觀看用戶成長率最高,觀看時間較去年同期成長190%,廣告曝光量較去年同期成長124%。這主要得益於巴西、阿根廷和智利對價格較為敏感的家庭。在中東,沙烏地阿拉伯和阿拉伯聯合大公國(阿拉伯聯合大公國)正在大力推廣高階智慧電視,LG Channels將於2026年7月在阿拉伯聯合大公國推出韓國娛樂內容庫。儘管非洲仍處於發展初期,但從2026年6月起,CANAL+和三星開始在18個非洲國家銷售的新款三星智慧電視上預裝“DStv Stream”,為付費電視基礎設施尚未完全發展的市場用戶提供直接接入串流媒體服務的途徑。
其他好處:
- Excel格式的市場預測(ME)表
- 3個月的分析師支持
目錄
第1章:引言
- 研究假設和市場定義
- 調查範圍
第2章:調查方法
第3章執行摘要
第4章 市場狀況
- 市場概覽
- 市場促進因素
- 高速寬頻和家庭Wi-Fi的廣泛普及。
- 快速頻道和廣告支援計劃的普及
- 串流媒體和通訊服務的捆綁
- 雲端遊戲和大螢幕互動娛樂
- 零售媒體和廣告空間在「可購物電視」上的融合
- 從電視使用行為可以了解的家庭購買意願徵兆。
- 市場限制因素
- 分散的電視作業系統生態系統
- 隱私、同意和自動內容識別限制
- 串流媒體棒更換和更長的電視更換週期
- 由於晶片組、轉碼器和遙控器規格的差異,應用程式移植面臨障礙。
- 價值和供應鏈分析
- 監理情勢
- 技術展望
- 波特五力分析
第5章 市場規模與成長預測
- 按串流媒體類型
- 影片串流
- 音訊串流
- 按收入模式
- 收費式計費(SVOD)
- 交易收費(TVOD/PPV)
- 廣告支援收費(AVOD/FAST)
- 混合貨幣化和收費
- 廣告格式
- 串流內影片廣告
- 程式化連網電視廣告
- 品牌內容與贊助
- 支援購物功能的廣告和支援QR碼功能的廣告
- 按內容類型
- 電影和影像作品
- 電視節目和劇集內容
- 記錄
- 其他內容類型
- 按地區
- 北美洲
- 美國
- 加拿大
- 墨西哥
- 南美洲
- 巴西
- 阿根廷
- 智利
- 其他南美國家
- 歐洲
- 德國
- 英國
- 法國
- 義大利
- 西班牙
- 俄羅斯
- 其他歐洲國家
- 亞太地區
- 中國
- 印度
- 日本
- 韓國
- 東南亞
- 澳洲和紐西蘭
- 其他亞太國家
- 中東
- 沙烏地阿拉伯
- 阿拉伯聯合大公國
- 土耳其
- 其他中東國家
- 非洲
- 南非
- 奈及利亞
- 埃及
- 其他非洲國家
- 北美洲
第6章 競爭情勢
- 市場集中度
- 策略趨勢
- 市佔率分析
- 公司簡介
- Samsung Electronics Co., Ltd.
- LG Electronics Inc.
- TCL Technology Group Corporation
- Hisense Visual Technology Co., Ltd.
- Xiaomi Corporation
- Sony Group Corporation
- Roku, Inc.
- Amazon.com, Inc.
- Alphabet Inc.
- Apple Inc.
- VIZIO Holding Corp.
- Comcast Corporation
- Xperi Inc.
- Panasonic Holdings Corporation
- TPV Technology Co., Ltd.
- Skyworth Group Limited
- Haier Smart Home Co., Ltd.
- Sharp Corporation
- Changhong Electric Co., Ltd.
- Tencent Holdings Limited
第7章 市場機會與未來展望
According to Mordor Intelligence, the smart TV OTT streaming market size was valued at USD 100.13 billion in 2025 and estimated to grow from USD 111.64 billion in 2026 to reach USD 177.47 billion by 2031, at a CAGR of 9.71% during the forecast period (2026-2031).
This report is Segmented by Streaming Type (Video Streaming, and Audio Streaming), Revenue Model (SVOD, TVOD/PPV, AVOD/FAST and Hybrid Monetization Billing), Advertising Format (In-Stream Video, Programmatic CTV, Branded Content, Shoppable/QR), Content Type (Movies and Films, TV Shows and Episodic Content, and Documentaries), and Geography. The Market Forecasts are Provided in Terms of Value (USD).
Global Smart TV OTT Streaming Market Trends and Insights
High-Speed Broadband and Home Wi-Fi Expansion
Fiber rollout and 5G fixed wireless access support the adoption of the Smart TV OTT streaming market by improving large-screen playback at home. The International Telecommunication Union reported that internet users represent a significant majority of the global population, while 5G subscriptions account for a substantial share of mobile broadband connections. 5G networks cover more than half of the global population, although access remains much higher in high-income economies than in low-income economies. The Federal Communications Commission reported in May 2025 that 96% of U.S. homes and small businesses had access to 5G mobile service. Continued investment in fiber and fixed wireless networks supports the wider availability of household connections suited to sustained television streaming. Better home connections reduce buffering and encourage longer smart TV sessions, which expands the advertising inventory available to platform operators and makes smart television viewing more reliable for services that depend on uninterrupted playback.
FAST Channel and Ad-Supported Tier Proliferation
FAST and ad-supported tiers have become central to revenue growth in the Smart TV OTT streaming market. Amagi reported strong year-over-year growth in global FAST viewing hours and ad impressions, based on a broad base of FAST channel deliveries. Its survey also found that most senior FAST operators viewed reformatting metadata across platforms as a major operational burden, while many said poor metadata reduced revenue or content visibility. The IAB expects digital video to account for a majority share of U.S. television and video advertising spending for the first time. It also expects U.S. connected TV advertising spending to continue growing year over year. These conditions favor operators that can manage content metadata, ad decisioning, and distribution across several platforms. The Smart TV OTT streaming market therefore gives an advantage to scaled services with effective content-management systems.
Fragmented TV Operating-System Ecosystems
Operating-system fragmentation limits distribution efficiency across the Smart TV OTT streaming market. A service seeking reach across North America, Europe, and Asia-Pacific must maintain certification across 5 to 7 operating-system environments with different app stores, application interfaces, advertising tools, and technical requirements. That work creates revenue-sharing obligations and development costs that can reduce the funds available for content investment, especially for providers without a broad technical support base. The European Digital Markets Act also affects the policy setting for television operating-system providers. European broadcasters asked competition authorities in March 2026 to assess Android TV, Amazon Fire OS, and Samsung Tizen as potential gatekeepers, which could lead to requirements for nondiscriminatory application placement and interoperability. Ownership changes above the operating-system layer could add another form of access control, as retail and broadcast groups invest in advertising technology and connected TV platforms. This environment remains more favorable to providers that combine operating systems, audience data, advertising tools, and content access.
Other drivers and restraints analyzed in the detailed report include:
- Bundled Streaming and Telecom Distribution
- Cloud Gaming and Large-Screen Interactive Entertainment
- Privacy, Consent, and Automatic Content Recognition Constraints
For complete list of drivers and restraints, kindly check the Table Of Contents.
Segment Analysis
Video streaming held 85.22% of the Smart TV OTT streaming market in 2025. Smart televisions are designed for large-format video delivery, which supports viewing of live sports, scripted programs, and nonfiction content. The ongoing transfer of programming from linear television to streaming services has added more video inventory to connected screens. Video also benefits from the established use of television sets for shared household viewing. These conditions keep video as the central source of platform viewing hours.
Audio streaming is projected to grow at a 10.11% CAGR through 2031. Smart TVs increasingly serve as home hubs for music, podcasts, and audiobooks during periods when video is not playing. Podcast services are also developing video-based formats that suit a living-room screen and use television audio systems more fully. Audio can create a pathway to later video viewing during the same household session. Operators that aggregate audio and video within one interface can use this behavior to build engagement across formats.
Recurring subscription billing held 45.36% of the Smart TV OTT streaming market in 2025. Premium originals, exclusive sports rights, and ad-free viewing support subscription demand despite wider consumer concern about managing several paid services. SVOD platforms can retain value when they offer content unavailable through competing services. Transactional billing serves time-specific demand for premium film releases and major live sports events. Hybrid models cover services shifting between subscription-led and advertising-led approaches.
Advertising-supported billing, including AVOD and FAST, is projected to grow at a 10.57% CAGR from 2026 to 2031. It responds to price-sensitive households and provides advertisers with a route into connected television audiences that may not be reached through conventional television schedules. The IAB found that 54% of incremental connected TV investment in 2026 came directly from linear television budget reallocation. Telecom bundles can improve household penetration, but discounts of 30% to 45% may reduce effective revenue per subscriber for services included in them, so the Smart TV OTT streaming market size for AVOD and FAST is supported by advertiser demand while margins remain sensitive to bundle terms. Operators must balance scale, ad load, revenue sharing, and the quality of the viewer experience as these models mature.
Complete Report Scope:
- By Streaming Type
- Video Streaming
- Audio Streaming
- By Revenue Model
- Recurring Subscription Billing (SVOD)
- Transactional Billing (TVOD/PPV)
- Advertising-Supported Billing (AVOD/FAST)
- Hybrid Monetization Billing
- By Advertising Format
- In-Stream Video Advertising
- Programmatic CTV Advertising
- Branded Content and Sponsorships
- Shoppable, and QR-Enabled Advertising
- By Content Type
- Movies and Films
- TV Shows and Episodic Content
- Documentaries
- Other Content Types
- By Geography
- North America
- United States
- Canada
- Mexico
- South America
- Brazil
- Argentina
- Chile
- Rest of South America
- Europe
- Germany
- United Kingdom
- France
- Italy
- Spain
- Russia
- Rest of Europe
- Asia-Pacific
- China
- India
- Japan
- South Korea
- Southeast Asia
- Australia and New Zealand
- Rest of Asia-Pacific
- Middle East
- Saudi Arabia
- United Arab Emirates
- Turkey
- Rest of Middle East
- Africa
- South Africa
- Nigeria
- Egypt
- Rest of Africa
- North America
Geography Analysis
North America held 41.37% of the regional total in 2025. Mature broadband networks, high smart TV adoption, and the movement of linear television budgets toward programmatic connected TV supported the region. U.S. connected TV advertising spending is expected to reach USD 29.3 billion in 2026, while digital video spending is projected to rise from USD 39.0 billion in 2021 to USD 81.9 billion in 2026. Comcast expanded StreamSaver in April 2026 by adding Disney+, Hulu, and HBO Max to bundles that already included Peacock, Netflix, and Apple TV, reinforcing telecom-led aggregation and closer links between streaming services and household broadband subscriptions. Canada and Mexico also contribute to regional demand, with Mexico providing room for FAST services among households moving from pay television to ad-supported options.
Asia-Pacific is projected to grow at a 10.49% CAGR through 2031. India had more than 1.45 billion OTT monthly active users in 2025, a 20% increase over 3 years, supported by cricket rights and competition among JioHotstar, ZEE5, SonyLIV, and Amazon. Paid streaming accounts across Indonesia, Thailand, the Philippines, Malaysia, and Singapore rose 19% year over year to exceed 61 million in 2025, while Vietnam and the Philippines are developing through AVOD and FAST-led consumption. Japan and South Korea contribute mature audiences with established smart TV and local-content ecosystems. The Asia Video Industry Association projected online video revenue in Asia-Pacific at USD 70 billion in 2025, with China, Japan, Australia, South Korea, and India generating 88% of that value.
Europe remains important because high smart TV penetration is combined with multilingual content needs and detailed regulation, and Germany, the UK, France, Italy, and Spain are the 5 largest European markets where free-to-air digital services and public broadcaster streaming compete for subscription and FAST viewing. South America recorded the fastest FAST growth in 2026, with viewing hours up 190% year over year and ad impressions up 124%, led by price-sensitive households in Brazil, Argentina, and Chile. Saudi Arabia and the UAE support premium smart TV adoption in the Middle East, and LG Channels launched a Korean entertainment cluster in the UAE in July 2026. Africa is earlier in its development, but CANAL+ and Samsung began pre-installing DStv Stream on new Samsung smart TVs across 18 African countries in June 2026, creating a direct streaming entry point in markets that did not have broad pay-TV infrastructure.
- Samsung Electronics Co., Ltd.
- LG Electronics Inc.
- TCL Technology Group Corporation
- Hisense Visual Technology Co., Ltd.
- Xiaomi Corporation
- Sony Group Corporation
- Roku, Inc.
- Amazon.com, Inc.
- Alphabet Inc.
- Apple Inc.
- VIZIO Holding Corp.
- Comcast Corporation
- Xperi Inc.
- Panasonic Holdings Corporation
- TPV Technology Co., Ltd.
- Skyworth Group Limited
- Haier Smart Home Co., Ltd.
- Sharp Corporation
- Changhong Electric Co., Ltd.
- Tencent Holdings Limited
Additional Benefits:
- The market estimate (ME) sheet in Excel format
- 3 months of analyst support
TABLE OF CONTENTS
1 INTRODUCTION
- 1.1 Study Assumptions and Market Definition
- 1.2 Scope of the Study
2 RESEARCH METHODOLOGY
3 EXECUTIVE SUMMARY
4 MARKET LANDSCAPE
- 4.1 Market Overview
- 4.2 Market Drivers
- 4.2.1 High-Speed Broadband and Home Wi-Fi Expansion
- 4.2.2 FAST Channel and Ad-Supported Tier Proliferation
- 4.2.3 Bundled Streaming and Telecom Distribution
- 4.2.4 Cloud Gaming and Large-Screen Interactive Entertainment
- 4.2.5 Retail-Media Convergence and Shoppable-TV Inventory
- 4.2.6 Household-Level Intent Signals From TV Interface Behavior
- 4.3 Market Restraints
- 4.3.1 Fragmented TV Operating-System Ecosystems
- 4.3.2 Privacy, Consent, and Automatic Content Recognition Constraints
- 4.3.3 Streaming Stick Substitution and Extended TV Replacement Cycles
- 4.3.4 App-Porting Friction From Chipset, Codec, and Remote-Control Variability
- 4.4 Value and Supply-Chain Analysis
- 4.5 Regulatory Landscape
- 4.6 Technological Outlook
- 4.7 Porter's Five Forces Analysis
- 4.7.1 Bargaining Power of Suppliers
- 4.7.2 Bargaining Power of Buyers
- 4.7.3 Threat of New Entrants
- 4.7.4 Threat of Substitutes
- 4.7.5 Competitive Rivalry
5 MARKET SIZE AND GROWTH FORECASTS (VALUE)
- 5.1 By Streaming Type
- 5.1.1 Video Streaming
- 5.1.2 Audio Streaming
- 5.2 By Revenue Model
- 5.2.1 Recurring Subscription Billing (SVOD)
- 5.2.2 Transactional Billing (TVOD/PPV)
- 5.2.3 Advertising-Supported Billing (AVOD/FAST)
- 5.2.4 Hybrid Monetization Billing
- 5.3 By Advertising Format
- 5.3.1 In-Stream Video Advertising
- 5.3.2 Programmatic CTV Advertising
- 5.3.3 Branded Content and Sponsorships
- 5.3.4 Shoppable, and QR-Enabled Advertising
- 5.4 By Content Type
- 5.4.1 Movies and Films
- 5.4.2 TV Shows and Episodic Content
- 5.4.3 Documentaries
- 5.4.4 Other Content Types
- 5.5 By Geography
- 5.5.1 North America
- 5.5.1.1 United States
- 5.5.1.2 Canada
- 5.5.1.3 Mexico
- 5.5.2 South America
- 5.5.2.1 Brazil
- 5.5.2.2 Argentina
- 5.5.2.3 Chile
- 5.5.2.4 Rest of South America
- 5.5.3 Europe
- 5.5.3.1 Germany
- 5.5.3.2 United Kingdom
- 5.5.3.3 France
- 5.5.3.4 Italy
- 5.5.3.5 Spain
- 5.5.3.6 Russia
- 5.5.3.7 Rest of Europe
- 5.5.4 Asia-Pacific
- 5.5.4.1 China
- 5.5.4.2 India
- 5.5.4.3 Japan
- 5.5.4.4 South Korea
- 5.5.4.5 Southeast Asia
- 5.5.4.6 Australia and New Zealand
- 5.5.4.7 Rest of Asia-Pacific
- 5.5.5 Middle East
- 5.5.5.1 Saudi Arabia
- 5.5.5.2 United Arab Emirates
- 5.5.5.3 Turkey
- 5.5.5.4 Rest of Middle East
- 5.5.6 Africa
- 5.5.6.1 South Africa
- 5.5.6.2 Nigeria
- 5.5.6.3 Egypt
- 5.5.6.4 Rest of Africa
- 5.5.1 North America
6 COMPETITIVE LANDSCAPE
- 6.1 Market Concentration
- 6.2 Strategic Moves
- 6.3 Market Share Analysis
- 6.4 Company Profiles (includes Global Level Overview, Market Level Overview, Core Segments, Financials as available, Strategic Information, Market Rank/Share, Products and Services, Recent Developments)
- 6.4.1 Samsung Electronics Co., Ltd.
- 6.4.2 LG Electronics Inc.
- 6.4.3 TCL Technology Group Corporation
- 6.4.4 Hisense Visual Technology Co., Ltd.
- 6.4.5 Xiaomi Corporation
- 6.4.6 Sony Group Corporation
- 6.4.7 Roku, Inc.
- 6.4.8 Amazon.com, Inc.
- 6.4.9 Alphabet Inc.
- 6.4.10 Apple Inc.
- 6.4.11 VIZIO Holding Corp.
- 6.4.12 Comcast Corporation
- 6.4.13 Xperi Inc.
- 6.4.14 Panasonic Holdings Corporation
- 6.4.15 TPV Technology Co., Ltd.
- 6.4.16 Skyworth Group Limited
- 6.4.17 Haier Smart Home Co., Ltd.
- 6.4.18 Sharp Corporation
- 6.4.19 Changhong Electric Co., Ltd.
- 6.4.20 Tencent Holdings Limited
7 MARKET OPPORTUNITIES AND FUTURE OUTLOOK
- 7.1 White-Space and Unmet-Need Assessment

 智慧電視市場:2026-2032年全球市場預測(依顯示技術、螢幕大小、解析度、銷售管道和應用分類)
 智慧電視市場:按螢幕大小、顯示技術、作業系統和地區分類網路電視市場:2026年至2032年全球預測(依顯示技術、解析度、螢幕大小、作業系統和應用程式分類)
 2026年全球體育賽事線上影片市場報告智慧電視晶片市場:按類型、解析度、最終用戶和地區分類
 智慧電視市場分析及預測(至2035年):依類型、產品類型、技術、組件、應用、功能、安裝類型、最終用戶及模式分類
 美國智慧電視:市場佔有率分析、產業趨勢與統計、成長預測(2026-2031)
 全球智慧電視市場規模、佔有率、趨勢和成長分析報告(2026-2034)
 智慧型電視晶片市場:按類型、解析度、最終用戶、國家和地區分類-全球產業分析、市場規模、市場佔有率及2025年至2032年預測
 智慧電視市場規模、佔有率、趨勢和預測(按解析度類型、螢幕大小、螢幕類型、技術、平台、分銷管道、應用和地區分類),2026-2034年