


 |
市場調查報告書
商品編碼
2123794
水耕法:市佔率分析、產業趨勢與統計、成長預測(2026-2031)Aquaponics - Market Share Analysis, Industry Trends & Statistics, Growth Forecasts (2026 - 2031) |
||||||

※ 本網頁內容可能與最新版本有所差異。詳細情況請與我們聯繫。
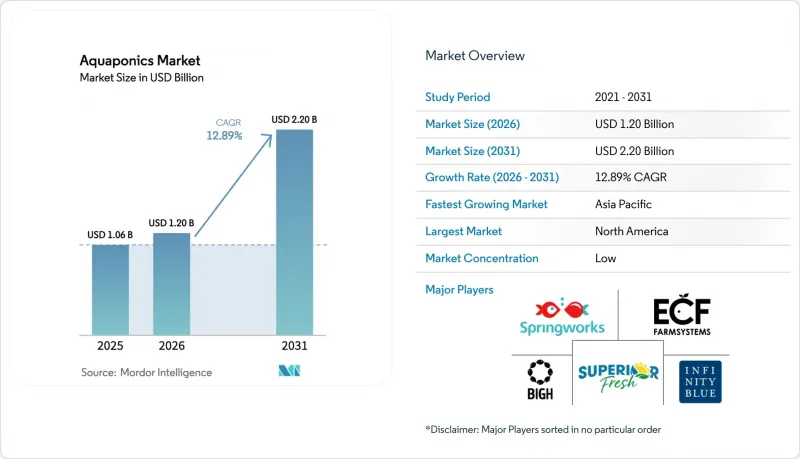
據 Mordor Intelligence 稱,2025 年魚菜共生市場價值 10.6 億美元,預計到 2031 年將從 2026 年的 12 億美元成長到 22 億美元,預測期(2026-2031 年)的複合年成長率為 12.89%。
本報告按作物類型(綠葉類、香草和微型菜苗、番茄、黃瓜、漿果等)、魚類類型(吳郭魚、鯰魚、鱒魚等)、生產規模(大型、中小型)和地區(北美、南美、歐洲、亞太、中東和非洲)進行細分。市場預測以美元計價。
全球魚菜共生市場趨勢及洞察
對本地生產、不含農藥的農產品的需求日益成長
都市區消費者越來越要求蔬菜來源可追溯,且能在採摘後24小時內送達市場。魚菜共生系統無需使用合成農藥,因為魚類無法耐受循環水中的化學殘留。 Superior Fresh LLC公司於2024年停止了在印第安納州的水耕生菜生產,並將資金集中到位於威斯康辛州的一家綜合工廠。這表明,蛋白質和農業相結合的模式能夠帶來更高的利潤率。零售價20%至30%的溢價鼓勵企業繞過批發管道,直接透過農夫市集和定期配送進行銷售,在需求旺季穩定現金流。
引入基於循環經濟的水資源保護措施
水耕系統可循環利用約90%的水資源,完全符合歐盟循環經濟指令及中東地區的抗旱戰略。新加坡農糧獸醫局(AVA)已累計3.09億新元(約2.293億美元)用於支持節水農業和食品研究,直至2025年。歐盟的「LIFE-LEMNERGY」計畫目前正處於2021-2027年階段,該計畫透過將營養物質捕獲與浮萍、廢水減量和沼氣生產相結合,實現了超過85%的脫氮,從而抵消了氣候控制的能源成本。
初始投資額大,營運複雜
商業化養殖設施的建造成本在每平方公尺500至1000美元之間,比同等規模的水耕設施高出50%。這是因為此一體化系統需要協調魚缸、生物過濾器和氣候控制系統。在溫帶地區,能源成本佔營運預算的比例高達40%,而停電期間備用發電機的故障可能導致大規模魚類死亡。投資回收期通常超過五年,這種長期的投資回報對傳統的農業貸款機構和創業投資來說缺乏吸引力。
細分市場分析
到2025年,綠葉蔬菜將佔銷售額的46.3%,而香草和微型菜苗預計到2031年將以13.7%的複合年成長率成長。香草的資本週轉速度更快,因為它們只需3-6週即可收穫,而結球生菜則需要8-10週。羅勒、薄荷和香菜的批發價格是生菜的兩到三倍,這反映了溫濕度控制環境帶來的更高能源成本。由於需要精確調節鈣鎂平衡和授粉,番茄、黃瓜和漿果仍屬於小眾市場,這增加了人事費用。人參和卡痛等藥用植物需要獲得許可並由第三方進行活性成分分析,但如果與製藥公司簽訂供應契約,利潤率可超過60.0%。
在亞太地區,企業正進一步拓展草莓、甜椒和亞洲特有蔬菜的種植。該地區居民可支配收入的成長促使他們更願意為新穎性和安全認證買單。出口到歐洲和日本的合約也越來越要求企業遵守國際標準化組織(ISO)22000標準。雖然作物組合多元化能夠幫助企業對沖市場波動風險,但對不同品種的營養吸收進行合理管理至關重要,以避免潛在的營養缺乏症蔓延至整個生態系統。
區域分析
2025年,北美引領魚菜共生市場,佔全球銷售額的34.2%。這主要歸功於消費者願意為有機產品支付更高的價格,以及各州政府的津貼涵蓋了環境控制設施的投資成本。魚菜共生活動主要集中在威斯康辛州、加州和大西洋中部地區,這些都市區人口密度高,配送範圍較窄。加拿大的「農業潔淨科技計畫」為不列顛哥倫比亞省和安大略省的設施維修津貼,這兩個省份尤其受到冬季取暖成本上漲的影響。監管政策的明確性也是一大優勢,因為美國農業部允許魚菜共生產品使用有機標籤,簡化了行銷和定價流程。
亞太地區是成長最快的地區,預計到2031年將以13.1%的複合年成長率成長,因為特大城市面臨土地稀缺和日益成長的糧食安全需求。在中國,閒置的倉庫正被改造為集水產養殖和植物種植於一體的綜合中心;在日本,地方政府正在資助旨在提高社區韌性的試點計畫。印度班加羅爾和孟買的叢集正在解決中產階級消費者對食品安全的擔憂;澳洲正在推廣澳洲肺魚,以區別於主導的進口魚類吳郭魚。在韓國,首爾和釜山正在考慮建造屋頂種植系統,但城市農業政策仍處於發展階段。
歐洲的投資趨勢與循環經濟的指導方針相符。比利時的BIGH屋頂農場即使從收穫到商店不到兩小時也能盈利。英國Flo-Gro公司的蝦類養殖系統正在擴大養殖品種,但缺乏統一的有機認證標準和不斷上漲的能源成本對南歐業者構成挑戰。在中東和非洲,魚菜共生技術正被用來保護稀缺的淡水資源。阿拉伯聯合大公國和沙烏地阿拉伯正在將海水淡化與太陽能發電相結合,以降低營運成本。南非正在開普敦和約翰內斯堡開展離網魚菜共生試點項目,而巴西和阿根廷則在聖保羅和布宜諾斯艾利斯推進早期部署,但項目資金不足和監管的不確定性阻礙了進展。
其他好處:
- Excel格式的市場預測(ME)表
- 三個月的分析師支持
目錄
第1章:引言
- 研究假設和市場定義
- 調查範圍
第2章:調查方法
第3章執行摘要
第4章 市場狀況
- 市場概覽
- 市場促進因素
- 對本地生產的、不含農藥的農產品的需求日益成長
- 引入基於循環經濟的水資源保護措施
- 與垂直農業結合,保障都市區糧食安全
- 高附加價值藥用植物的商業化
- 政府支持永續農業的措施
- 控制環境監測技術的進步
- 市場限制因素
- 初始投資額大,營運複雜
- 與通用感染疾病管理相關的風險
- 技術純熟勞工供不應求
- 不同市場的監管標準各不相同。
- 監理情勢
- 技術展望
- 波特五力分析
第5章 市場規模與成長預測
- 按作物類型
- 綠葉蔬菜
- 香草和微型菜苗
- 番茄
- 黃瓜
- 莓果
- 其他作物
- 魚類
- 吳郭魚
- 鯰魚
- 鱒魚
- 其他魚類
- 按生產規模
- 大規模
- 小型和中型
- 按地區
- 北美洲
- 美國
- 加拿大
- 其他北美國家
- 南美洲
- 巴西
- 阿根廷
- 其他南美國家
- 歐洲
- 德國
- 荷蘭
- 法國
- 英國
- 義大利
- 其他歐洲國家
- 亞太地區
- 中國
- 日本
- 印度
- 澳洲
- 韓國
- 其他亞太國家
- 中東
- 阿拉伯聯合大公國
- 沙烏地阿拉伯
- 其他中東國家
- 非洲
- 南非
- 肯亞
- 其他非洲國家
- 北美洲
第6章 競爭情勢
- 市場集中度
- 策略趨勢
- 市佔率分析
- 公司簡介
- Superior Fresh LLC
- ECF Farmsystems GmbH
- Infinity Blue Barramundi LLC(MainStream Aquaculture Group)
- Traders Hill Farm
- Great Lakes Aquaponics
- Springworks Farm Maine, Inc.
- Bella Vita Farm LLC
- Waterfield Farms Inc.
- AquaSprout Farms, LLC
- Waterwheel Farms
- Victory Farms Ltd.
- Blue Acre Appalachian Aquaponics Center
- WaterFarmers Urban Agriculture(Sustainnovation Inc.)
- BIGH
- Deepwater Farms
第7章 市場機會與未來展望
According to Mordor Intelligence, the aquaponics market size was valued at USD 1.06 billion in 2025 and estimated to grow from USD 1.20 billion in 2026 to reach USD 2.20 billion by 2031, at a CAGR of 12.89% during the forecast period (2026-2031).
This report is Segmented by Crop Type (Leafy Greens, Herbs and Microgreens, Tomatoes, Cucumbers, Berries, and More), by Fish Species (Tilapia, Catfish, Trout, and More), by Production Scale (Large-Scale and Small and Medium-Scale), and by Geography (North America, South America, Europe, Asia-Pacific, Middle East, and Africa). The Market Forecasts are Provided in Terms of Value (USD).
Global Aquaponics Market Trends and Insights
Rising Demand for Locally Sourced Pesticide-Free Produce
Urban shoppers are increasingly demanding traceable vegetables harvested within 24 hours, and aquaponics eliminates the need for synthetic pesticides because fish cannot tolerate chemical residues in recirculating water. Superior Fresh LLC shuttered its hydroponic lettuce production in Indiana in 2024 to concentrate capital on its integrated Wisconsin complex, signaling that dual protein-and-produce models generate superior margins. Retail premiums of 20.0-30.0% encourage operators to bypass wholesale channels through farmers' markets and subscription deliveries, stabilizing cash cycles during peak demand seasons.
Adoption of Circular-Economy Water-Conservation Practices
Aquaponics recycles approximately 90.0% of the system's water, aligning perfectly with European Union circular economy directives and drought mitigation strategies in the Middle East. Singapore's Agri-Food and Veterinary Authority has earmarked SGD 309 million (USD 229.3 million) to support low-water agrifood research through 2025. The LIFE-LEMNERGY project in the European Union, currently running in the 2021-2027 phase, has achieved nitrogen removal above 85.0% by integrating duckweed nutrient recovery, cutting discharge, and generating biogas that offsets climate-control energy costs.
High Upfront Capital and Operational Complexity
Commercial installations cost USD 500-1,000 per square meter, exceeding hydroponic equivalents by up to 50.0%, because integrated systems must harmonize fish tanks, biofilters, and climate management systems. Energy accounts for as much as 40.0% of operating budgets in temperate zones, and power outages can cause catastrophic fish mortality if backup generators fail. Payback often stretches beyond five years, a horizon that traditional agricultural lenders and venture capital find unattractive.
Other drivers and restraints analyzed in the detailed report include:
- Integration with Vertical Farming for Urban Food Security
- Commercialization of High-Value Medicinal Herbs
- Zoonotic Pathogen Management Risks
For complete list of drivers and restraints, kindly check the Table Of Contents.
Segment Analysis
Leafy greens captured 46.3% of revenue in 2025, while herbs and microgreens are advancing at a 13.7% CAGR through 2031. Herbs mature in three to six weeks, versus eight to ten weeks for head lettuce, enabling faster cash rotation. Wholesale prices for basil, mint, and cilantro are two to three times higher than those for lettuce, reflecting the higher energy costs associated with climate-controlled environments. Tomatoes, cucumbers, and berries remain niche because they require precise calcium-to-magnesium balancing and pollination services, which increase labor inputs. Medicinal botanicals, including ginseng and kratom, require licensing and third-party potency assays, yet their margins can exceed 60.0% when supply contracts with pharmaceutical buyers are secured.
Additional expansion into strawberries, peppers, and Asian specialty vegetables is unfolding in the Asia-Pacific region, where rising disposable income underpins the willingness to pay for novelty and safety certifications. The International Organization for Standardization 22000 framework is increasingly stipulated in export contracts to Europe and Japan. Operators with diversified crop portfolios hedge against market volatility, but they must manage species-specific nutrient uptakes to avert deficiencies that can ripple through the integrated system.
Complete Report Scope:
- By Crop Type
- Leafy Greens
- Herbs and Microgreens
- Tomatoes
- Cucumbers
- Berries
- Other Crops
- By Fish Species
- Tilapia
- Catfish
- Trout
- Other Fish
- By Production Scale
- Large-Scale
- Small and Medium-Scale
- By Geography
- North America
- United States
- Canada
- Rest of North America
- South America
- Brazil
- Argentina
- Rest of South America
- Europe
- Germany
- Netherlands
- France
- United Kingdom
- Italy
- Rest of Europe
- Asia-Pacific
- China
- Japan
- India
- Australia
- South Korea
- Rest of Asia-Pacific
- Middle East
- United Arab Emirates
- Saudi Arabia
- Rest of Middle East
- Africa
- South Africa
- Kenya
- Rest of Africa
- North America
Geography Analysis
North America led the aquaponics market in 2025, with a 34.2% revenue share, as consumers paid premiums for pesticide-free produce and state grants offset capital expenses for controlled-environment facilities. Activity concentrates in Wisconsin, California, and the Mid-Atlantic, where urban density keeps the distribution radius short. Canada's Agricultural Clean Technology Program subsidizes retrofits in British Columbia and Ontario, regions that are particularly affected by high heating costs during the winter. Regulatory clarity is an advantage because the United States Department of Agriculture (USDA) allows organic labeling for aquaponic outputs, simplifying marketing and price positioning.
The Asia-Pacific region is the fastest-growing zone, with a 13.1% CAGR projected to 2031, as megacities face land scarcity and increasing food security mandates. China repurposes idle warehouses for integrated fish and plant hubs, while Japan funds community resilience pilots in rural prefectures. India's clusters in Bangalore and Mumbai respond to food-safety concerns among middle-class consumers, and Australia promotes barramundi to differentiate from tilapia-heavy imports. South Korea is exploring rooftop systems in Seoul and Busan, although its urban agriculture policy is still in formation.
Europe's investment trajectory aligns with the circular economy directives. Belgium's BIGH rooftop farm proves that harvest-to-shelf times under two hours can be profitable. The United Kingdom's Flo-Gro shrimp configuration widens species options, but inconsistent organic certification and elevated energy tariffs challenge Southern European operators. The Middle East and Africa utilize aquaponics to conserve scarce freshwater resources. The United Arab Emirates and Saudi Arabia blend desalination with solar power to reduce operating costs. South Africa pilots off-grid aquaponics in Cape Town and Johannesburg, while Brazil and Argentina nurture early-stage deployments in Sao Paulo and Buenos Aires, tempered by limited project finance and regulatory uncertainty.
- Superior Fresh LLC
- ECF Farmsystems GmbH
- Infinity Blue Barramundi LLC (MainStream Aquaculture Group)
- Traders Hill Farm
- Great Lakes Aquaponics
- Springworks Farm Maine, Inc.
- Bella Vita Farm LLC
- Waterfield Farms Inc.
- AquaSprout Farms, LLC
- Waterwheel Farms
- Victory Farms Ltd.
- Blue Acre Appalachian Aquaponics Center
- WaterFarmers Urban Agriculture (Sustainnovation Inc.)
- BIGH
- Deepwater Farms
Additional Benefits:
- The market estimate (ME) sheet in Excel format
- 3 months of analyst support
TABLE OF CONTENTS
1 Introduction
- 1.1 Study Assumptions and Market Definition
- 1.2 Scope of the Study
2 Research Methodology
3 Executive Summary
4 Market Landscape
- 4.1 Market Overview
- 4.2 Market Drivers
- 4.2.1 Rising demand for locally sourced pesticide-free produce
- 4.2.2 Adoption of circular-economy water conservation practices
- 4.2.3 Integration with vertical farming for urban food security
- 4.2.4 Commercialization of high-value medicinal herbs
- 4.2.5 Government incentives for sustainable agriculture
- 4.2.6 Advances in controlled-environment monitoring
- 4.3 Market Restraints
- 4.3.1 High upfront capital and operational complexity
- 4.3.2 Zoonotic pathogen management risks
- 4.3.3 Limited availability of skilled labor
- 4.3.4 Fragmented regulatory standards across markets
- 4.4 Regulatory Landscape
- 4.5 Technological Outlook
- 4.6 Porter's Five Forces Analysis
- 4.6.1 Threat of New Entrants
- 4.6.2 Bargaining Power of Suppliers
- 4.6.3 Bargaining Power of Buyers
- 4.6.4 Threat of Substitutes
- 4.6.5 Intensity of Competitive Rivalry
5 Market Size and Growth Forecasts (Value)
- 5.1 By Crop Type
- 5.1.1 Leafy Greens
- 5.1.2 Herbs and Microgreens
- 5.1.3 Tomatoes
- 5.1.4 Cucumbers
- 5.1.5 Berries
- 5.1.6 Other Crops
- 5.2 By Fish Species
- 5.2.1 Tilapia
- 5.2.2 Catfish
- 5.2.3 Trout
- 5.2.4 Other Fish
- 5.3 By Production Scale
- 5.3.1 Large-Scale
- 5.3.2 Small and Medium-Scale
- 5.4 By Geography
- 5.4.1 North America
- 5.4.1.1 United States
- 5.4.1.2 Canada
- 5.4.1.3 Rest of North America
- 5.4.2 South America
- 5.4.2.1 Brazil
- 5.4.2.2 Argentina
- 5.4.2.3 Rest of South America
- 5.4.3 Europe
- 5.4.3.1 Germany
- 5.4.3.2 Netherlands
- 5.4.3.3 France
- 5.4.3.4 United Kingdom
- 5.4.3.5 Italy
- 5.4.3.6 Rest of Europe
- 5.4.4 Asia-Pacific
- 5.4.4.1 China
- 5.4.4.2 Japan
- 5.4.4.3 India
- 5.4.4.4 Australia
- 5.4.4.5 South Korea
- 5.4.4.6 Rest of Asia-Pacific
- 5.4.5 Middle East
- 5.4.5.1 United Arab Emirates
- 5.4.5.2 Saudi Arabia
- 5.4.5.3 Rest of Middle East
- 5.4.6 Africa
- 5.4.6.1 South Africa
- 5.4.6.2 Kenya
- 5.4.6.3 Rest of Africa
- 5.4.1 North America
6 Competitive Landscape
- 6.1 Market Concentration
- 6.2 Strategic Moves
- 6.3 Market Share Analysis
- 6.4 Company Profiles (includes Global-Level Overview, Market-Level Overview, Core Segments, Financials as Available, Strategic Information, Market Rank/Share for Key Companies, Products and Services, and Recent Developments)
- 6.4.1 Superior Fresh LLC
- 6.4.2 ECF Farmsystems GmbH
- 6.4.3 Infinity Blue Barramundi LLC (MainStream Aquaculture Group)
- 6.4.4 Traders Hill Farm
- 6.4.5 Great Lakes Aquaponics
- 6.4.6 Springworks Farm Maine, Inc.
- 6.4.7 Bella Vita Farm LLC
- 6.4.8 Waterfield Farms Inc.
- 6.4.9 AquaSprout Farms, LLC
- 6.4.10 Waterwheel Farms
- 6.4.11 Victory Farms Ltd.
- 6.4.12 Blue Acre Appalachian Aquaponics Center
- 6.4.13 WaterFarmers Urban Agriculture (Sustainnovation Inc.)
- 6.4.14 BIGH
- 6.4.15 Deepwater Farms
7 Market Opportunities and Future Outlook

 魚菜共生市場-2026-2032年全球市場預測
 魚菜共生農業市場預測至2034年-按系統類型、組件、魚類、作物類型、最終用戶和地區分類的全球分析
 2026年全球魚菜共生市場報告
 魚菜共生市場規模、佔有率、成長及全球產業分析:按類型、應用和地區分類的洞察,2026-2034 年預測
 水耕市場商機、成長要素、產業趨勢分析及2026-2035年預測。全球海洋水族設備市場(按設備類型、服務類型、技術、最終用戶和分銷管道分類)預測(2026-2032年)
 水產養殖市場:全球產業分析、規模、佔有率、成長、趨勢與預測(2025-2032)
 魚菜共生市場-全球產業規模、佔有率、趨勢、機會及預測,依設備、方法(基於介質、營養膜技術和深水養殖)、應用、區域和競爭細分,2020-2030 年預測全球水產養殖市場:2025-2030 年預測2032 年全球魚菜共生市場預測:按系統類型、設備類型、產品、組件、營運規模、應用和地區分類