


 |
市場調查報告書
商品編碼
2123318
5G連結:市場佔有率分析、產業趨勢與統計、成長預測(2026-2031年)5G Connection - Market Share Analysis, Industry Trends & Statistics, Growth Forecasts (2026 - 2031) |
||||||

※ 本網頁內容可能與最新版本有所差異。詳細情況請與我們聯繫。
據 Mordor Intelligence 稱,2025 年 5G 連接市場價值為 1994.9 億美元,預計到 2031 年將達到 8219.5 億美元,而 2026 年為 2525.2 億美元,預測期(2026-2031 年)的複合年成長率為 26.62%。
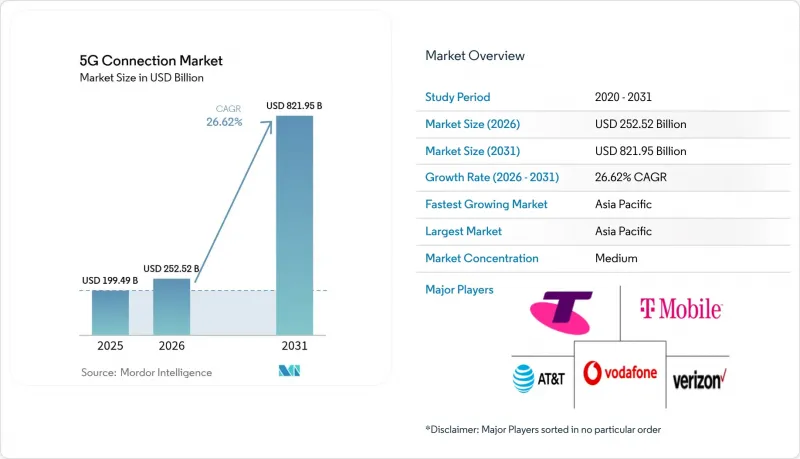
本報告按連接類型(行動寬頻、固定無線存取等)、最終用戶(消費者和企業)、頻段(1 GHz 以下、1-6 GHz 等)、網路架構(非獨立群組網路和獨立群組網路)、裝置類別(智慧型手機和平板電腦、FWA CPE 等)、服務類型(增強型行動寬頻(eMBB)、大規模機器和平板電腦、FWA CPE 等)、服務類型(增強型行動寬頻(eMBB)、大規模機器和平板電腦 (MTC)等地區進行分類和類型通訊類型。
全球5G連結市場趨勢與洞察
行動數據流量的激增催生了對高容量網路的需求。
在雲端遊戲和擴增實境(XR) 服務的推動下,5G 連線的平均月數據使用量已接近 70GB,是 4G 的四倍。中國 440 萬個 5G 基地台充分展現了應對如此龐大流量所需的規模。儘管中波頻寬仍然至關重要,但目前除中國以外,僅有四分之一的基地台部署了該頻段。隨著流量模式的轉變,營運商正優先推進載波聚合、大規模 MIMO 升級和動態頻寬共用。這些投資不僅推動了 5G 連結市場的收入成長,也使得最佳化網路能源效率變得更加迫切。
固定無線存取(FWA)正成為寬頻的主流替代方案。
美國營運商目前總合提供1,150萬條固定無線存取(FWA)線路,平均下載速度超過200Mbps,預計到2028年這一數字將達到2,000萬。印度營運商正利用FWA相對於有限光纖部署的成本優勢,力求2027年實現3,000萬FWA用戶在2024年第一季累計的FWA收入為4.52億美元,證明了這種模式的短期盈利。毫米波(mmWave)的部署正在提升都市區連線容量,客戶調查顯示,44%的用戶更傾向於使用無線連線進行家庭寬頻上網。這些趨勢共同推動了每位用戶的平均收入(ARPU)成長,並擴大了5G連結市場的潛在基本客群。
高額資本支出(CAPEX)和中波頻寬。
2022年至2025年間,全球基礎設施投資預計將超過6000億美元,但歐洲的頻譜競標造成了過重的財務負擔,導致僅有2%的區域運營商採用獨立網段(SA)核心網,而中國的這一比例高達80%。新興市場電信營運商正在推遲競標,並考慮共用鐵塔以緩解不斷上升的槓桿壓力。北歐國家的網路共用就是一個成功的例子,但財務壓力仍然阻礙它們全面進入5G連結市場。
細分市場分析
到2025年,行動寬頻將佔據5G連接市場61.35%的佔有率,這主要得益於智慧型手機的普及和影片消費的成長。同時,在智慧工廠、醫院和物流中心等場所部署專用5G網路的推動下,機器對機器(M2M)和物聯網(IoT)連接將以27.9%的複合年成長率成長。向企業級解決方案的轉變正在顯著擴大網路切片領域的5G連接市場,關鍵任務通訊和固定無線存取(FWA)用戶推動了流量的成長。硬體供應商正在推出RedCap晶片組以降低工業感測器的功耗,加速M2M專案的可行性。隨著即時分析在競爭激烈的製造業中變得至關重要,邊緣原生架構正在進一步推動M2M的商業化。
預計到2028年,蜂巢式物聯網終端的持續成長將使設備數量加倍,從而不斷催生對成本最佳化模組和簡化部署工具的需求。從美國FirstNet的擴展到韓國全國公共安全網路,關鍵任務通訊應用案例正在拓展服務差異化的機會。由此產生的多樣性正在建立一種新的平衡:消費者流量仍佔很大比例,而企業流量將在未來5G連接市場的成長中佔據主導地位。
到2025年,受串流媒體和遊戲等行動寬頻需求的推動,消費者應用將佔5G連接市場75.32%的佔有率。然而,預計到2031年,企業連接市場將以29.6%的複合年成長率成長,這主要得益於汽車、醫療保健和能源產業的數位轉型。尤其是在製造業,超過1000個正在進行的項目報告稱,遷移到專用5G網路後,生產線效率提高了15-20%。新加坡和瑞典的醫院透過部署超低延遲視訊鏈路,縮短了手術時間,並改善了患者的治療效果。
在智慧城市專案中,監視錄影機、連網路燈和環境監測器等設備的部署,都有助於擴大企業用戶群。公共產業正在採用5G技術實現電網即時平衡,而石油和天然氣公司則優先部署自動化巡檢無人機。這些因素共同作用,促使企業客戶成為長期收入的重心,提高單連結平均收入,並提升5G連結市場的客戶留存率。
區域分析
預計到2025年,亞太地區將佔全球用戶的51.64%,並在2031年之前以29.4%的複合年成長率成長,這主要得益於中國440萬個基地台的部署以及印度獨立組網部署的快速擴張。到2030年,中國對數位經濟的貢獻預計將達到2兆美元,這反映了5G平台在製造業、零售業和服務業的廣泛應用。印度的Reliance Jio營運超過100萬個雲端原生基地台,其固定廣域網路(FWA)網路容量預計將從2027年的500萬增加到3000萬。日本和韓國率先實現5G Advanced的商業化,維持了該地區的創新領先地位,預計到2030年,東南亞將為GDP貢獻1300億美元的成長。
北美是一個成熟且創新驅動的市場,5G網路已覆蓋98%的人口。 T-Mobile在全國部署的獨立網路(SA)網路以及643萬個免費廣域網路(FWA)清晰地展現了面向消費者和企業的服務的多元化發展。 Verizon正致力於透過與AST SpaceMobile的衛星合作,彌合農村地區剩餘的連接鴻溝,而加拿大和墨西哥的營運商則正在整合RedCap等5G高級功能。目前,市場關注的焦點正轉向利用網路API、邊緣運算和人工智慧實現服務編配的商業化,這正在推動整個5G連接市場單站點收入密度的提升。
歐洲各地的進展不一。德國、丹麥和芬蘭的5G網路覆蓋率超過95%,但僅2%的合約運作獨立組網(SA)核心網。在英國,沃達豐和Three合併後,已投資148.6億美元用於網路升級,旨在縮小農村地區的網路連接差距。同時,北歐國家正透過頻率共用模式降低成本並提高網路可用性。目前,歐洲大陸的電信業者正敦促監管機構簡化競標並降低許可費用,以維持投資週期,從而縮小SA網路的普及率差距,並從5G連接市場中獲取更多價值。
其他好處:
- Excel格式的市場預測(ME)表
- 3個月的分析師支持
目錄
第1章:引言
- 研究假設和市場定義
- 調查範圍
第2章:調查方法
第3章執行摘要
第4章 市場狀況
- 市場概覽
- 市場促進因素
- 行動數據流量的激增對高容量網路提出了更高的要求。
- 固定無線存取(FWA)正成為寬頻的主流替代方案。
- 企業數位化和物聯網 (IoT) 正在加速 5G 的普及。
- 人工智慧帶來的上行鏈路流量激增,正在加速 5G-SA 的部署。
- 透過開放的API生態系統實現獲利
- 市場限制因素
- 高額資本支出(CAPEX)及中波頻段成本
- 在農村地區發展電信網路的經濟可行性仍不高。
- 光纖的價格競爭正在減緩都市區。
- 價值鏈分析
- 監理情勢
- 技術展望
- 波特五力分析
第5章 市場規模與成長預測
- 按連線類型
- 行動寬頻
- 固定無線存取
- 機器對機器通訊和物聯網
- 關鍵任務通訊
- 私人網路
- 最終用戶
- 一般消費者
- 公司
- 製造業
- 衛生保健
- 汽車和運輸業
- 智慧城市與公共安全
- 能源公用事業
- 零售和物流
- 按頻段
- 低於 1 GHz(低頻段)
- 1–6 GHz(中頻段)
- 24 GHz 以上(毫米波/高頻段)
- 透過網路架構
- 非獨立式(NSA)
- 獨立版 (SA)
- 按設備類別
- 智慧型手機和平板電腦
- FWA CPE
- 物聯網模組和閘道器
- 穿戴式裝置和增強/虛擬實境設備
- 工業路由器和加固型模組
- 按服務類型
- 高級行動寬頻(eMBB)
- 大規模機器類型通訊(mMTC)
- 超高可靠性、低延遲通訊(URLLC)
- 按地區
- 北美洲
- 美國
- 加拿大
- 墨西哥
- 南美洲
- 巴西
- 其他南美國家
- 歐洲
- 德國
- 法國
- 英國
- 其他歐洲國家
- 亞太地區
- 中國
- 印度
- 日本
- 韓國
- ASEAN
- 其他亞太國家
- 中東和非洲
- 中東
- 沙烏地阿拉伯
- UAE
- 土耳其
- 其他中東國家
- 非洲
- 南非
- 奈及利亞
- 其他非洲國家
- 中東
- 北美洲
第6章 競爭情勢
- 市場集中度
- 策略趨勢
- 市佔率分析
- 公司簡介
- AT&T Inc.
- Verizon Communications Inc.
- Vodafone Group Plc
- China Mobile Ltd.
- China Telecommunications Corp.
- T-Mobile US Inc.
- Telstra Corp. Ltd.
- Telefonica SA
- Deutsche Telekom AG
- Reliance Jio Infocomm Ltd.
- SK Telecom Co. Ltd.
- NTT Docomo Inc.
- KT Corp.
- Orange SA
- KDDI Corp.
- Bharti Airtel Ltd.
- Saudi Telecom Company(stc)
- Rakuten Mobile Inc.
- Etisalat by eand
- MTN Group Ltd.
第7章 市場機會與未來展望
According to Mordor Intelligence, the 5G connections market size was valued at USD 199.49 billion in 2025 and estimated to grow from USD 252.52 billion in 2026 to reach USD 821.95 billion by 2031, at a CAGR of 26.62% during the forecast period (2026-2031).
This report is Segmented by Connection Type (Mobile Broadband, Fixed Wireless Access, and More), End-User (Consumer and Enterprise), Spectrum Band (Sub-1 GHz, 1-6 GHz, and More), Network Architecture (Non-Standalone and Standalone), Device Category (Smartphones and Tablets, FWA CPE, and More), Service Type (Enhanced Mobile Broadband (eMBB), Massive Machine-Type Communications (mMTC), and More), and Geography.
Global 5G Connection Market Trends and Insights
Surge in mobile data traffic requiring higher-capacity networks
Monthly data usage per 5G line averages close to 70 GB-four times the 4G figure-fueled by cloud gaming and extended-reality services. China's 4.4 million 5G base stations illustrate the scale needed to carry this load, and mid-band spectrum remains vital, although only one quarter of non-Chinese sites currently deploy it. As traffic migrates, operators prioritize additional carrier aggregation, Massive MIMO upgrades, and dynamic spectrum sharing. These investments underpin revenue growth in the 5G connections market while raising the urgency to optimize network energy efficiency.
Fixed Wireless Access (FWA) emerging as mainstream broadband alternative
US operators collectively serve 11.5 million FWA lines, with projections of 20 million by 2028 as median download speeds exceed 200 Mbps. Operators in India aim for 30 million FWA subscribers by 2027 by exploiting cost advantages over limited fiber roll-outs. Verizon generated USD 452 million in Q1 2024 FWA revenue, demonstrating the format's near-term profitability. mmWave deployments increase urban capacity, and customer surveys show 44% preference for wireless home broadband. Collectively, these developments boost average revenue per user and broaden the 5G connections market addressable base.
High CAPEX and mid-band spectrum costs
Global infrastructure outlays will exceed USD 600 billion during 2022-2025, and European auctions drive disproportionate financing burdens that leave only 2% of regional operators with SA cores versus 80% in China. Emerging-market carriers postpone auctions and explore tower-sharing to mitigate rising leverage. Network sharing in Nordic economies shows positive examples, but capital pressures still curb full participation in the 5G connections market.
Other drivers and restraints analyzed in the detailed report include:
- Enterprise digitization and IoT accelerating 5G adoption
- Generative-AI-driven uplink surge spurring early 5G-SA roll-outs
- Rural coverage economics remain unattractive
For complete list of drivers and restraints, kindly check the Table Of Contents.
Segment Analysis
Mobile broadband accounted for 61.35% of the 5G connections market in 2025, underpinned by smartphone adoption and video consumption growth. At the same time, M2M and IoT links are expanding at a 27.9% CAGR, encouraged by private 5G network deployments across smart factories, hospitals, and logistics hubs. The enterprise tilt is materially increasing the 5G connections market size for network slicing, particularly as mission-critical communications and FWA subscriptions contribute incremental traffic. Hardware vendors have introduced RedCap chipsets that lower power draw for industrial sensors, accelerating M2M project viability. Edge-native architectures further catalyze M2M monetization as real-time analytics become table stakes in competitive manufacturing.
Continued proliferation of cellular IoT endpoints is projected to double device counts by 2028, creating relentless demand for cost-optimized modules and simplified onboarding tools. Mission-critical communication use cases, from FirstNet expansion in the US to nationwide public-safety networks in Korea, widen service differentiation opportunities. The resulting diversity cements a new equilibrium in which consumer traffic remains large, yet enterprise traffic captures the outsized share of future 5G connections market growth.
Consumer use retained 75.32% share of the 5G connections market size in 2025 as streaming and gaming sustained mobile broadband traffic. Nonetheless, enterprise lines will deliver a 29.6% CAGR through 2031, powered by digital-transformation mandates in automotive, healthcare, and energy. Manufacturing stands out: more than 1,000 active projects report 15-20% gains in line efficiency after switching to private 5G. Hospitals in Singapore and Sweden show reduced surgery times and enhanced patient outcomes once ultra-low-latency video links are integrated.
Smart-city programs are also deploying surveillance cameras, connected streetlights, and environmental monitors, each adding to the enterprise subscriber base. Utilities turn to 5G for real-time grid balancing, and oil-and-gas operators prioritize automated inspection drones. These converging drivers tilt long-term revenue concentration toward the enterprise, increasing average revenue per connection and deepening stickiness within the 5G connections market.
Complete Report Scope:
- By Connection Type
- Mobile Broadband
- Fixed Wireless Access
- M2M and IoT
- Mission-critical Communications
- Private Networks
- By End-user
- Consumer
- Enterprise
- Manufacturing
- Healthcare
- Automotive and Transportation
- Smart Cities and Public Safety
- Energy and Utilities
- Retail and Logistics
- By Spectrum Band
- Sub-1 GHz (Low-Band)
- 1-6 GHz (Mid-Band)
- above 24 GHz (mmWave / High-Band)
- By Network Architecture
- Non-Standalone (NSA)
- Standalone (SA)
- By Device Category
- Smartphones and Tablets
- FWA CPE
- IoT Modules and Gateways
- Wearables and AR/VR Devices
- Industrial Routers and Rugged Modules
- By Service Type
- Enhanced Mobile Broadband (eMBB)
- Massive Machine-Type Communications (mMTC)
- Ultra-Reliable Low-Latency Communications (URLLC)
- By Geography
- North America
- United States
- Canada
- Mexico
- South America
- Brazil
- Rest of South America
- Europe
- Germany
- France
- United Kingdom
- Rest of Europe
- Asia Pacific
- China
- India
- Japan
- South Korea
- ASEAN
- Rest of Asia Pacific
- Middle East and Africa
- Middle East
- Saudi Arabia
- UAE
- Turkey
- Rest of Middle East
- Africa
- South Africa
- Nigeria
- Rest of Africa
- Middle East
- North America
Geography Analysis
Asia-Pacific accounted for 51.64% of global subscriptions in 2025 and is forecast to grow at a 29.4% CAGR through 2031, led by China's 4.4 million base stations and India's rapid standalone expansion. China's digital-economy contribution is set to reach USD 2 trillion by 2030, reflecting widespread 5G platform adoption in manufacturing, retail, and services. India's Reliance Jio operates over 1 million cloud-native cell sites, while expected FWA lines could climb from 5 million to 30 million by 2027. Japan's and South Korea's early commercial 5G Advanced launches sustain regional innovation leadership, and Southeast Asia projects USD 130 billion in incremental GDP impact by 2030.
North America is a mature yet innovation-centric arena where 98% of the population already has 5G coverage. T-Mobile's nationwide SA deployment and 6.43 million FWA lines illustrate consumer and enterprise diversification. Verizon's satellite partnership with AST SpaceMobile seeks to close residual rural gaps, while Canadian and Mexican carriers integrate 5G Advanced features such as RedCap. Focus now turns to monetizing network APIs, edge compute, and AI-assisted service orchestration, driving higher revenue density per site across the 5G connections market.
Europe displays mixed progress: Germany, Denmark and Finland exceed 95% population coverage, yet only 2% of subscriptions run on SA cores. The United Kingdom's Vodafone-Three merger injects USD 14.86 billion into network upgrades aimed at rural inclusion, and Nordic spectrum-sharing models yield higher availability at lower cost. Continental operators now press regulators to streamline auctions and lower license fees to sustain investment cycles, seeking to close the SA gap and unlock greater value in the 5G connections market.
- AT&T Inc.
- Verizon Communications Inc.
- Vodafone Group Plc
- China Mobile Ltd.
- China Telecommunications Corp.
- T-Mobile US Inc.
- Telstra Corp. Ltd.
- Telefonica SA
- Deutsche Telekom AG
- Reliance Jio Infocomm Ltd.
- SK Telecom Co. Ltd.
- NTT Docomo Inc.
- KT Corp.
- Orange SA
- KDDI Corp.
- Bharti Airtel Ltd.
- Saudi Telecom Company (stc)
- Rakuten Mobile Inc.
- Etisalat by eand
- MTN Group Ltd.
Additional Benefits:
- The market estimate (ME) sheet in Excel format
- 3 months of analyst support
TABLE OF CONTENTS
1 INTRODUCTION
- 1.1 Study Assumptions and Market Definition
- 1.2 Scope of the Study
2 RESEARCH METHODOLOGY
3 EXECUTIVE SUMMARY
4 MARKET LANDSCAPE
- 4.1 Market Overview
- 4.2 Market Drivers
- 4.2.1 Surge in mobile data traffic requiring higher-capacity networks
- 4.2.2 Fixed Wireless Access (FWA) emerging as mainstream broadband alternative
- 4.2.3 Enterprise digitization and IoT accelerating 5G adoption
- 4.2.4 Generative-AI-driven uplink surge spurring early 5G-SA roll-outs
- 4.2.5 Monetization via Open-API ecosystems
- 4.3 Market Restraints
- 4.3.1 High CAPEX and mid-band spectrum costs
- 4.3.2 Rural coverage economics remain unattractive
- 4.3.3 Fiber price wars dampen urban FWA uptake
- 4.4 Value Chain Analysis
- 4.5 Regulatory Landscape
- 4.6 Technological Outlook
- 4.7 Porter's Five Forces Analysis
- 4.7.1 Bargaining Power of Suppliers
- 4.7.2 Bargaining Power of Buyers/Consumers
- 4.7.3 Threat of New Entrants
- 4.7.4 Threat of Substitutes
- 4.7.5 Intensity of Competitive Rivalry
5 MARKET SIZE AND GROWTH FORECASTS (VALUE)
- 5.1 By Connection Type
- 5.1.1 Mobile Broadband
- 5.1.2 Fixed Wireless Access
- 5.1.3 M2M and IoT
- 5.1.4 Mission-critical Communications
- 5.1.5 Private Networks
- 5.2 By End-user
- 5.2.1 Consumer
- 5.2.2 Enterprise
- 5.2.2.1 Manufacturing
- 5.2.2.2 Healthcare
- 5.2.2.3 Automotive and Transportation
- 5.2.2.4 Smart Cities and Public Safety
- 5.2.2.5 Energy and Utilities
- 5.2.2.6 Retail and Logistics
- 5.3 By Spectrum Band
- 5.3.1 Sub-1 GHz (Low-Band)
- 5.3.2 1-6 GHz (Mid-Band)
- 5.3.3 above 24 GHz (mmWave / High-Band)
- 5.4 By Network Architecture
- 5.4.1 Non-Standalone (NSA)
- 5.4.2 Standalone (SA)
- 5.5 By Device Category
- 5.5.1 Smartphones and Tablets
- 5.5.2 FWA CPE
- 5.5.3 IoT Modules and Gateways
- 5.5.4 Wearables and AR/VR Devices
- 5.5.5 Industrial Routers and Rugged Modules
- 5.6 By Service Type
- 5.6.1 Enhanced Mobile Broadband (eMBB)
- 5.6.2 Massive Machine-Type Communications (mMTC)
- 5.6.3 Ultra-Reliable Low-Latency Communications (URLLC)
- 5.7 By Geography
- 5.7.1 North America
- 5.7.1.1 United States
- 5.7.1.2 Canada
- 5.7.1.3 Mexico
- 5.7.2 South America
- 5.7.2.1 Brazil
- 5.7.2.2 Rest of South America
- 5.7.3 Europe
- 5.7.3.1 Germany
- 5.7.3.2 France
- 5.7.3.3 United Kingdom
- 5.7.3.4 Rest of Europe
- 5.7.4 Asia Pacific
- 5.7.4.1 China
- 5.7.4.2 India
- 5.7.4.3 Japan
- 5.7.4.4 South Korea
- 5.7.4.5 ASEAN
- 5.7.4.6 Rest of Asia Pacific
- 5.7.5 Middle East and Africa
- 5.7.5.1 Middle East
- 5.7.5.1.1 Saudi Arabia
- 5.7.5.1.2 UAE
- 5.7.5.1.3 Turkey
- 5.7.5.1.4 Rest of Middle East
- 5.7.5.2 Africa
- 5.7.5.2.1 South Africa
- 5.7.5.2.2 Nigeria
- 5.7.5.2.3 Rest of Africa
- 5.7.5.1 Middle East
- 5.7.1 North America
6 COMPETITIVE LANDSCAPE
- 6.1 Market Concentration
- 6.2 Strategic Moves
- 6.3 Market Share Analysis
- 6.4 Company Profiles (includes Global level Overview, Market level overview, Core Segments, Financials as available, Strategic Information, Market Rank/Share for key companies, Products and Services, and Recent Developments)
- 6.4.1 AT&T Inc.
- 6.4.2 Verizon Communications Inc.
- 6.4.3 Vodafone Group Plc
- 6.4.4 China Mobile Ltd.
- 6.4.5 China Telecommunications Corp.
- 6.4.6 T-Mobile US Inc.
- 6.4.7 Telstra Corp. Ltd.
- 6.4.8 Telefonica SA
- 6.4.9 Deutsche Telekom AG
- 6.4.10 Reliance Jio Infocomm Ltd.
- 6.4.11 SK Telecom Co. Ltd.
- 6.4.12 NTT Docomo Inc.
- 6.4.13 KT Corp.
- 6.4.14 Orange SA
- 6.4.15 KDDI Corp.
- 6.4.16 Bharti Airtel Ltd.
- 6.4.17 Saudi Telecom Company (stc)
- 6.4.18 Rakuten Mobile Inc.
- 6.4.19 Etisalat by eand
- 6.4.20 MTN Group Ltd.
7 MARKET OPPORTUNITIES AND FUTURE OUTLOOK
- 7.1 White-space and Unmet-need Assessment

 2026年全球5G銀行業市場報告
 資訊通訊技術測試系統市場:全球市場預測,2026-2032年
 全球跨境勞動力和移民解決方案市場規模、佔有率、趨勢和成長分析報告(2026-2034)Frost Radar™:下一代人工智慧基礎設施和智慧資料中心,2026 年
 5G OTA 機房市場規模、佔有率和成長分析:按機房類型、頻段、應用、最終用戶、機房配置、銷售管道和地區分類-2026-2033 年產業預測5G非地面網路市場:全球市場預測,2026-2032年
 中東和非洲5G光纖骨幹網路傳輸:市場佔有率分析、產業趨勢和統計數據以及成長預測(2026-2031年)4G 和 5G 市場:按組件、網路技術、頻段、頻段所有權、網路架構、部署類型、部署模式和最終用戶分類——2026-2032 年全球市場預測
 跨國勞動力和移民解決方案市場:市場機會、成長要素、產業趨勢分析以及 2026-2035 年預測。
 智慧網路容量最佳化市場預測至2034年—按組件、部署模式、技術、應用、最終用戶和地區分類的全球分析