


 |
市場調查報告書
商品編碼
2123149
貨運:市場佔有率分析、產業趨勢與統計、成長預測(2026-2031)Freight Forwarding - Market Share Analysis, Industry Trends & Statistics, Growth Forecasts (2026 - 2031) |
||||||

※ 本網頁內容可能與最新版本有所差異。詳細情況請與我們聯繫。
根據 Mordor Intelligence 預測,貨運市場規模將從 2025 年的 5,722.5 億美元成長到 2026 年的 6,025.8 億美元,然後在 2031 年達到 7,760.4 億美元,2026 年至 2031 年的複合年成長率為 5.19%。
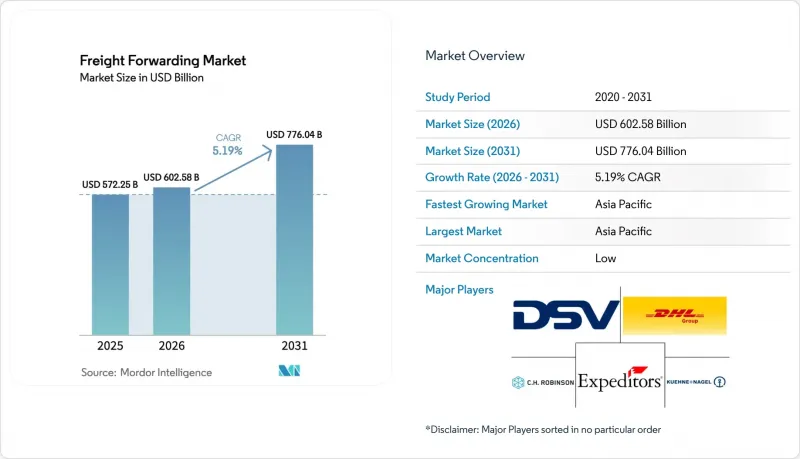
本報告按運輸方式(例如,空運貨運代理)、公司規模(例如,大型企業)、貨運代理經營模式(例如,傳統的輕資產貨運代理)、終端用戶行業(例如,零售/電子商務、汽車、化學)和地區(例如,北美、南美、歐洲、亞太地區)進行細分。市場預測以美元計價。
全球貨運代理市場趨勢與洞察
跨境電子商務小包裹數量激增。
全球跨境小包裹預計在2024年達到21億件,並在2027年超過30億件。這導致以貨櫃為基礎的貨運模式被分割成更小的貨物,需要快速整合。貨運代理商目前正在建造小包裹樞紐,並發展最後一公里合作夥伴關係,以確保在東南亞地區實現48小時送達。世界海關組織(WCO)的跨境電子商務標準等法規結構正在推動對自動化關稅計算的投資,以減少海關延誤。無法提供即時庫存可見性的企業將面臨市場佔有率被數位化原生競爭對手蠶食的風險。因此,貨運代理市場正在向能夠同時最佳化成本和速度的靈活、數據驅動型企業轉型。
推出端對端交通運輸視覺化
到2025年初,將有超過1,200萬個物聯網貨櫃感測器運作,為控制塔平台提供數據,用於預測港口堵塞和海關延誤。基於機器學習的分析將使托運人能夠在延誤嚴重之前重新安排貨物運輸路線。這有助於降低滯留費,尤其是在運輸對溫度敏感的藥品時。基於區塊鏈的載貨證券可以縮短信用證的處理時間並防止單據欺詐,但由於承運人和海關之間需要互通性,其普及速度緩慢。整合這些工具的貨運代理商正在贏得信譽,並在貨運代理市場獲得更高的費率。
港口擁擠和貨櫃供需失衡
洛杉磯港和長灘港的平均貨物停留時間從2023年的4.8天增加到2025年初的6.2天。同時,空貨櫃的重新部署成本在2024年上漲了22%。結構性失衡導致進口密集地區貨櫃過剩,而出口地區貨櫃短缺,進而推高了貨物停留成本。雖然內陸堆場和貨櫃共用協議在一定程度上緩解了成本,但底盤短缺和鐵路貨場堵塞仍然是長期存在的瓶頸,嚴重限制著貨運代理市場的發展。
細分市場分析
2025年,海運貨運代理在貨運代理市場中仍將佔據61.77%的佔有率,這主要得益於其在主要航線上的成本效益。然而,隨著托運人權衡速度、成本和碳排放影響,多模態和聯運貨運代理正以6.40%的複合年成長率(2026-2031年)快速成長。電子商務的碎片化導致拼箱(LCL)貨運量增加,也增加了貨物收集和整合的複雜性。陸路運輸連接最後一公里樞紐,但駕駛短缺和燃油價格波動正促使基礎設施已開發地區的內陸運輸轉向鐵路。航空運輸為半導體和製藥行業的供應鏈提供支持,但運力限制和基於碳排放的附加費限制了其成長。諸如中歐班列等鐵路走廊提供15-20天的運輸時間,彌合了空運和海運之間的差距。
貨運代理市場正在經歷網路重組,將海運幹線運輸與鐵路或空運相結合,以完成最後一段旅程,從而在不承擔空運高昂成本的情況下減少庫存緩衝。數位化成本和時間模擬器正在幫助貨運代理根據缺貨罰款和庫存持有成本選擇運輸方式。國際海事組織(IMO)碳排放強度指數的監管壓力正在推動貨運代理轉向低排放的運輸組合,尤其對於非緊急貨物而言。隨著托運人逐漸放棄單一運輸契約,能夠協調無縫交接並提供集中式可視性的貨運代理正在贏得更多市場佔有率。
到2025年,大型企業將佔據貨運代理收入的68.50%,並利用其規模優勢來協商合約價格。然而,隨著數位化工具的普及,中小企業(SME)正以6.53%的複合年成長率(2026-2031年)快速成長。傳統上,中小企業缺乏足夠的規模來獲得具有競爭力的價格,也難以應對複雜的清關流程。像Flexport這樣的平台透過整合分散的需求、提供即時報價和自動化單證處理,幫助中小企業更快地發展,從而減少它們對仲介的依賴。
隨著貨運代理市場的演變,大型托運人仍然重視客製化解決方案和專屬客戶團隊,但同時也開始試用數位化儀錶板來評估現有服務。這凸顯了一種兩極化的趨勢:中小企業優先考慮透明度和速度,而大型客戶則更注重關係的持續性。能夠同時提供自助服務入口網站和個人化專業知識的供應商可以滿足這兩類客戶的需求,在不降低服務品質的前提下拓展業務量。
區域分析
到2025年,亞太地區將佔貨運收入的36.49%,預計2026年至2031年將以7.80%的複合年成長率成長,成為貨運市場成長最快的區域。儘管中國仍然是最大的單一目的地,但在「中國+1」多元化趨勢的推動下,對越南、印度和印尼的投資正在增加。新加坡和香港憑藉其卓越的港口效率和貿易融資體系,正在推動區域整合。日本和韓國出口高附加價值電子產品和汽車零件,而澳洲則出口大宗商品並接受電子商務進口。
北美仍然是主要的進口目的地,但長期存在的港口擁擠和勞動力短缺推高了貨物處理成本。托運人正轉向墨西哥灣沿岸和東海岸的門戶港口,或根據美墨加協定(USMCA)的規定,擴大經由墨西哥的跨國鐵路運輸。加拿大的貨運業務與能源和汽車貿易密切相關,而墨西哥則受惠於近岸外包,部分電子產品和汽車生產正從亞洲轉移至此。
歐洲擁有成熟的貨運樞紐,主要集中在德國、荷蘭和英國。然而,英國脫歐引發的海關摩擦以及倉庫人手不足正在減緩成長。斯堪地那維亞半島以及中東歐地區正透過為醫藥和汽車零件等產業開闢的專業運輸路線,佔據利基市場。儘管南美和中東/非洲的市場佔有率較小,但由於基礎建設和貿易協定帶來的互聯互通改善,貨運代理市場正在擴張。
其他好處:
- Excel格式的市場預測(ME)表
- 3個月的分析師支持
目錄
第1章:引言
- 研究假設和市場定義
- 調查範圍
第2章:調查方法
第3章執行摘要
第4章 市場狀況
- 市場概覽
- 市場促進因素
- 跨境電子商務導致小包裹數量激增
- 推出端對端交通運輸視覺化
- 近岸外包與「中國+1」政策引發的貿易轉變
- 對醫藥和食品業冷鏈的投資
- 航運公司的ESG目標和對碳定價的需求
- 利用生成式人工智慧進行動態負載匹配
- 市場限制因素
- 港口擁擠和貨櫃供需失衡
- 全球司機和倉庫人手不足
- 地緣政治衝突區與根源風險
- 收緊最低限度門檻和合規負擔
- 價值供應鏈分析
- 監理情勢
- 技術展望
- 波特五力分析
- 價格分析
- 地緣政治事件的影響
第5章 市場規模與成長預測
- 透過運輸方式
- 海運貨運代理
- 整箱貨(FCL)
- 拼箱 (LCL)
- 公路貨運代理
- 整車運輸 (FTL)
- 低於100%的運費(零擔運輸)
- 空運貨運代理
- 鐵路貨運代理
- 多模態和多式聯運貨運
- 海運貨運代理
- 按公司規模
- 小型企業
- 大公司
- 前移式卡車型號
- 傳統輕資產型貨運代理
- 數位優先/線上平台
- 混合資產利用貨運代理
- 按最終用戶行業分類
- 工業和製造業
- 零售與電子商務
- 醫療和藥品
- 石油、天然氣和能源
- 食品/飲料
- 車
- 化學品
- 其他最終用戶
- 按地區
- 北美洲
- 美國
- 加拿大
- 墨西哥
- 南美洲
- 巴西
- 阿根廷
- 智利
- 其他南美國家
- 歐洲
- 德國
- 英國
- 法國
- 西班牙
- 義大利
- 荷蘭
- 俄羅斯
- 其他歐洲國家
- 亞太地區
- 中國
- 印度
- 日本
- 韓國
- 新加坡
- 越南
- 印尼
- 澳洲
- 其他亞太國家
- 中東和非洲
- 沙烏地阿拉伯
- 阿拉伯聯合大公國
- 土耳其
- 南非
- 奈及利亞
- 埃及
- 其他中東和非洲國家
- 北美洲
第6章 競爭情勢
- 市場集中度
- 策略趨勢
- 市佔率分析
- 公司簡介
- AP Moller-Maersk
- CH Robinson
- CIMC Wetrans Logistics
- CMA CGM Group(including CEVA Logistics)
- DACHSER
- DHL Group
- DSV A/S
- Expeditors International of Washington, Inc.
- FedEx
- GEODIS
- Hellmann Worldwide Logistics
- Kerry Logistics Network, Ltd.
- Kintetsu World Express
- Kuehne+Nagel
- Lineage, Inc.
- LX Pantos
- Nippon Express Co., Ltd.
- Rhenus Logistics
- Sinotrans, Ltd.
- Toll Group
- Uber Freight LLC
- United Parcel Service of America, Inc.
- XPO, Inc.
- Yusen Logistics Co., Ltd.
第7章 市場機會與未來展望
According to Mordor Intelligence, the freight forwarding market size is expected to grow from USD 572.25 billion in 2025 to USD 602.58 billion in 2026 and is forecast to reach USD 776.04 billion by 2031 at 5.19% CAGR over 2026-2031.
This report is Segmented by Mode of Transport (Air Freight Forwarding and More), Enterprise Size (Large Enterprises and More), Forwarder Model (Traditional Asset-Light Forwarders and More), End-User Industry (Retail & E-Commerce, Automotive, Chemicals, and More), and Geography (North America, South America, Europe, Asia-Pacific, and More). The Market Forecasts are Provided in Terms of Value (USD).
Global Freight Forwarding Market Trends and Insights
Cross-Border E-Commerce Parcel Boom
Global cross-border parcels reached 2.1 billion in 2024 and are expected to exceed 3 billion by 2027, fragmenting full-container traffic into small consignments that need rapid consolidation. Forwarders now build parcel hubs and last-mile alliances to uphold 48-hour delivery windows in Southeast Asia. Regulatory frameworks such as the World Customs Organization's cross-border e-commerce standard drive investment in automated duty calculation that trims clearance delays. Providers unable to furnish real-time inventory visibility risk displacement by digital-native competitors. The freight forwarding market is therefore tilting toward flexible, data-rich operators that can optimize cost and speed simultaneously.
End-to-End Shipment Visibility Adoption
More than 12 million IoT container sensors were active in ocean trade by early 2025, feeding control-tower platforms that predict port congestion and customs holds. Machine-learning analytics help shippers re-route cargo before delays escalate, an advantage that cuts detention fees in temperature-sensitive pharma lanes. Blockchain bills of lading shorten letter-of-credit cycles and deter documentation fraud, yet widespread adoption is slowed by the need for carrier and customs interoperability. Forwarders that integrate these tools enhance trust and command premium rates in the freight forwarding market.
Port Congestion and Container Imbalances
Average dwell times at Los Angeles and Long Beach climbed to 6.2 days in early 2025, up from 4.8 days in 2023, while empty-container repositioning costs rose 22% in 2024. Structural imbalances create surplus boxes in import-heavy regions and scarcity in export zones, driving up detention fees. Inland depots and container-sharing pacts mitigate some expense, yet chassis shortages and rail yard congestion remain persistent bottlenecks that weigh on the freight forwarding market.
Other drivers and restraints analyzed in the detailed report include:
- Near-Shoring and China-Plus-One Trade Shifts
- Cold-Chain Investment for Pharma and Food
- Global Driver and Warehouse Labor Shortage
For complete list of drivers and restraints, kindly check the Table Of Contents.
Segment Analysis
Ocean freight forwarding retained a 61.77% freight forwarding market share in 2025, driven by cost efficiency on dense lanes. Yet multimodal and intermodal forwarding is advancing at a 6.40% CAGR (2026-2031) as shippers balance speed, cost, and carbon impact. Less-than-container load volumes increase with e-commerce fragmentation, widening consolidation complexity. Road forwarding connects last-mile nodes, but driver shortages and fuel volatility tilt inland moves toward rail where infrastructure allows. Air forwarding protects semiconductor and pharmaceutical supply lines, although capacity caps and carbon surcharges temper growth. Rail corridors such as the China-Europe Railway Express offer 15- to 20-day transits that fill the gap between air and ocean.
The freight forwarding market is restructuring networks to blend ocean trunk haul with rail or air final legs, reducing buffer inventory without incurring full air premiums. Digital cost-time simulators guide mode selection based on stockout penalties and inventory carrying costs. Regulatory pressure from the IMO Carbon Intensity Indicator spurs modal shifts toward lower-emission combinations, especially for non-urgent cargo. Forwarders that orchestrate seamless handoffs and provide unified visibility capture share as shippers exit single-mode contracts.
Large enterprises contributed 68.50% of forwarding revenue in 2025, leveraging volume to negotiate contract rates, but SMEs are expanding at a 6.53% CAGR (2026-2031) as digital tools democratize access. Historically, SMEs lacked the scale to secure competitive pricing or manage customs intricacies. Platforms such as Flexport aggregate fragmented demand, provide instant quotes, and automate documentation, removing broker dependency and helping SMEs expand faster.
As the freight forwarding market evolves, large shippers still prize tailored solutions and account teams, yet they pilot digital dashboards to benchmark incumbent service. A two-tier dynamic emerges: SMEs value transparency and speed, whereas large accounts prioritize relationship continuity. Providers that deliver self-service portals alongside white-glove expertise can span both clusters, capturing incremental volumes without diluting service quality.
Complete Report Scope:
- By Mode of Transport
- Ocean Freight Forwarding
- Full Container Load (FCL)
- Less-Than-Container Load (LCL)
- Road Freight Forwarding
- Full Truck Load (FTL)
- Less-Than-Truck Load (LTL)
- Air Freight Forwarding
- Rail Freight Forwarding
- Multimodal and Intermodal Forwarding
- Ocean Freight Forwarding
- By Enterprise Size
- Small and Medium Enterprises
- Large Enterprises
- By Forwarder Model
- Traditional Asset-Light Forwarders
- Digital-First / Online Platforms
- Hybrid Asset-Enabled Forwarders
- By End-user Industry
- Industrial and Manufacturing
- Retail and E-commerce
- Healthcare and Pharmaceuticals
- Oil, Gas and Energy
- Food and Beverages
- Automotive
- Chemicals
- Other End-users
- By Geography
- North America
- United States
- Canada
- Mexico
- South America
- Brazil
- Argentina
- Chile
- Rest of South America
- Europe
- Germany
- United Kingdom
- France
- Spain
- Italy
- Netherlands
- Russia
- Rest of Europe
- Asia-Pacific
- China
- India
- Japan
- South Korea
- Singapore
- Vietnam
- Indonesia
- Australia
- Rest of Asia-Pacific
- Middle East and Africa
- Saudi Arabia
- United Arab Emirates
- Turkey
- South Africa
- Nigeria
- Egypt
- Rest of Middle East and Africa
- North America
Geography Analysis
Asia-Pacific generated 36.49% of forwarding revenue in 2025 and is set to grow at a 7.80% CAGR between 2026-2031, the quickest regional climb in the freight forwarding market. China remains the largest single origin, yet Vietnam, India, and Indonesia collect rising investment under China-plus-one diversification. Singapore and Hong Kong anchor regional consolidations thanks to superior port efficiency and trade finance ecosystems. Japan and South Korea ship high-value electronics and automotive parts, while Australia ships bulk commodities and absorbs e-commerce imports.
North America remains an import-heavy destination, but chronic port congestion and labor scarcity inflate handling costs. Shippers divert to Gulf and East Coast gateways and expand cross-border rail through Mexico under USMCA provisions. Canada's forwarding flows align with energy and automotive trade, while Mexico benefits from near-shoring that relocates parts of electronics and auto production from Asia.
Europe holds a mature forwarding base centered on Germany, the Netherlands, and the United Kingdom. Brexit-induced customs friction and warehouse labor shortages moderate growth. Scandinavia and Central and Eastern Europe gain niche volumes through specialized corridors such as pharma and automotive parts. South America, the Middle East, and Africa account for smaller slices but rise as infrastructure upgrades and trade pacts improve connectivity, enlarging the freight forwarding market.
- A.P. Moller - Maersk
- C.H. Robinson
- CIMC Wetrans Logistics
- CMA CGM Group (including CEVA Logistics)
- DACHSER
- DHL Group
- DSV A/S
- Expeditors International of Washington, Inc.
- FedEx
- GEODIS
- Hellmann Worldwide Logistics
- Kerry Logistics Network, Ltd.
- Kintetsu World Express
- Kuehne+Nagel
- Lineage, Inc.
- LX Pantos
- Nippon Express Co., Ltd.
- Rhenus Logistics
- Sinotrans, Ltd.
- Toll Group
- Uber Freight LLC
- United Parcel Service of America, Inc.
- XPO, Inc.
- Yusen Logistics Co., Ltd.
Additional Benefits:
- The market estimate (ME) sheet in Excel format
- 3 months of analyst support
TABLE OF CONTENTS
1 Introduction
- 1.1 Study Assumptions and Market Definition
- 1.2 Scope of the Study
2 Research Methodology
3 Executive Summary
4 Market Landscape
- 4.1 Market Overview
- 4.2 Market Drivers
- 4.2.1 Cross-Border E-Commerce Parcel Boom
- 4.2.2 End-to-End Shipment-Visibility Adoption
- 4.2.3 Near-Shoring and "China-Plus-One" Trade Shifts
- 4.2.4 Cold-Chain Investment for Pharma and Food
- 4.2.5 Shipper ESG Targets and Carbon-Pricing Demand
- 4.2.6 Generative-AI Dynamic Load-Matching
- 4.3 Market Restraints
- 4.3.1 Port Congestion and Container Imbalances
- 4.3.2 Global Driver and Warehouse-Labor Shortage
- 4.3.3 Geopolitical Flashpoints and Route Risk
- 4.3.4 Tightening De-Minimis Thresholds and Compliance Burden
- 4.4 Value / Supply-Chain Analysis
- 4.5 Regulatory Landscape
- 4.6 Technological Outlook
- 4.7 Porter's Five Forces Analysis
- 4.7.1 Threat of New Entrants
- 4.7.2 Bargaining Power of Buyers
- 4.7.3 Bargaining Power of Suppliers
- 4.7.4 Threat of Substitutes
- 4.7.5 Intensity of Competitive Rivalry
- 4.8 Pricing Analysis
- 4.9 Impact of Geopolitical Events
5 Market Size and Growth Forecasts (Value)
- 5.1 By Mode of Transport
- 5.1.1 Ocean Freight Forwarding
- 5.1.1.1 Full Container Load (FCL)
- 5.1.1.2 Less-Than-Container Load (LCL)
- 5.1.2 Road Freight Forwarding
- 5.1.2.1 Full Truck Load (FTL)
- 5.1.2.2 Less-Than-Truck Load (LTL)
- 5.1.3 Air Freight Forwarding
- 5.1.4 Rail Freight Forwarding
- 5.1.5 Multimodal and Intermodal Forwarding
- 5.1.1 Ocean Freight Forwarding
- 5.2 By Enterprise Size
- 5.2.1 Small and Medium Enterprises
- 5.2.2 Large Enterprises
- 5.3 By Forwarder Model
- 5.3.1 Traditional Asset-Light Forwarders
- 5.3.2 Digital-First / Online Platforms
- 5.3.3 Hybrid Asset-Enabled Forwarders
- 5.4 By End-user Industry
- 5.4.1 Industrial and Manufacturing
- 5.4.2 Retail and E-commerce
- 5.4.3 Healthcare and Pharmaceuticals
- 5.4.4 Oil, Gas and Energy
- 5.4.5 Food and Beverages
- 5.4.6 Automotive
- 5.4.7 Chemicals
- 5.4.8 Other End-users
- 5.5 By Geography
- 5.5.1 North America
- 5.5.1.1 United States
- 5.5.1.2 Canada
- 5.5.1.3 Mexico
- 5.5.2 South America
- 5.5.2.1 Brazil
- 5.5.2.2 Argentina
- 5.5.2.3 Chile
- 5.5.2.4 Rest of South America
- 5.5.3 Europe
- 5.5.3.1 Germany
- 5.5.3.2 United Kingdom
- 5.5.3.3 France
- 5.5.3.4 Spain
- 5.5.3.5 Italy
- 5.5.3.6 Netherlands
- 5.5.3.7 Russia
- 5.5.3.8 Rest of Europe
- 5.5.4 Asia-Pacific
- 5.5.4.1 China
- 5.5.4.2 India
- 5.5.4.3 Japan
- 5.5.4.4 South Korea
- 5.5.4.5 Singapore
- 5.5.4.6 Vietnam
- 5.5.4.7 Indonesia
- 5.5.4.8 Australia
- 5.5.4.9 Rest of Asia-Pacific
- 5.5.5 Middle East and Africa
- 5.5.5.1 Saudi Arabia
- 5.5.5.2 United Arab Emirates
- 5.5.5.3 Turkey
- 5.5.5.4 South Africa
- 5.5.5.5 Nigeria
- 5.5.5.6 Egypt
- 5.5.5.7 Rest of Middle East and Africa
- 5.5.1 North America
6 Competitive Landscape
- 6.1 Market Concentration
- 6.2 Strategic Moves
- 6.3 Market Share Analysis
- 6.4 Company Profiles (includes Global level Overview, Market level overview, Core Segments, Financials as available, Strategic Information, Market Rank/Share for key companies, Products and Services, Recent Developments)
- 6.4.1 A.P. Moller - Maersk
- 6.4.2 C.H. Robinson
- 6.4.3 CIMC Wetrans Logistics
- 6.4.4 CMA CGM Group (including CEVA Logistics)
- 6.4.5 DACHSER
- 6.4.6 DHL Group
- 6.4.7 DSV A/S
- 6.4.8 Expeditors International of Washington, Inc.
- 6.4.9 FedEx
- 6.4.10 GEODIS
- 6.4.11 Hellmann Worldwide Logistics
- 6.4.12 Kerry Logistics Network, Ltd.
- 6.4.13 Kintetsu World Express
- 6.4.14 Kuehne+Nagel
- 6.4.15 Lineage, Inc.
- 6.4.16 LX Pantos
- 6.4.17 Nippon Express Co., Ltd.
- 6.4.18 Rhenus Logistics
- 6.4.19 Sinotrans, Ltd.
- 6.4.20 Toll Group
- 6.4.21 Uber Freight LLC
- 6.4.22 United Parcel Service of America, Inc.
- 6.4.23 XPO, Inc.
- 6.4.24 Yusen Logistics Co., Ltd.
7 Market Opportunities and Future Outlook
- 7.1 White-space and Unmet-need Assessment

 2026-2030年全球貨運市場
 東協貨運代理:市場佔有率分析、產業趨勢與統計及成長預測(2026-2031)
 航空貨運代理市場-2026-2032年全球市場預測
 全球貨運代理市場:2026 年
 貨運市場分析及至2035年預測:類型、服務、技術、組件、應用、最終用戶、解決方案、運輸方式
 貨運代理市場機會、成長促進因素、產業趨勢分析及2026-2035年預測。
 貨運代理市場:按運輸方式、客戶類型、服務、應用和地區分類的市場規模、佔有率和趨勢分析,以及細分市場預測(2026-2033 年)
 航空貨運代理市場報告:按類型、服務類型、最終用戶行業和地區分類(2026-2034 年)
 貨運市場:依運輸方式、服務類型、最終用戶產業及地區分類
 2026年全球國際貨運代理市場報告