


 |
市場調查報告書
商品編碼
2071372
貨運代理市場機會、成長促進因素、產業趨勢分析及2026-2035年預測。Freight Forwarding Market Opportunity, Growth Drivers, Industry Trend Analysis, and Forecast 2026 - 2035 |
||||||

全球貨運代理市場預計到 2025 年價值 1,662 億美元,年複合成長率為 5.2%,到 2035 年將達到 2,678 億美元。
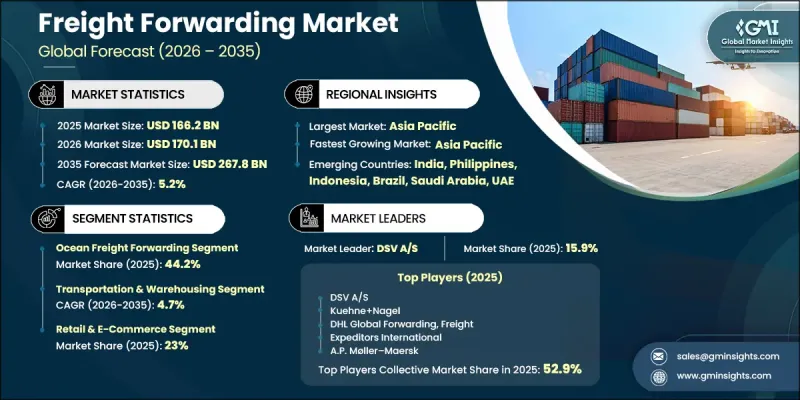
市場成長持續受到國際貿易活動活性化和全球供應鏈日益複雜化的驅動。貨運代理商在協調運輸網路、管理海關手續、最佳化運輸路線以及確保跨區域及時交付方面發揮著至關重要的作用。隨著企業製造和採購業務的多元化,全球市場對高效物流協調的需求日益成長。持續的供應鏈重組正在改變貨物的來源地和貿易模式,在不降低貨運代理服務整體需求的前提下,為貨運代理創造了新的機會。企業越來越尋求能夠管理跨國籌資策略和不斷變化的貿易需求的靈活物流解決方案。同時,運輸成本和燃油相關費用的波動持續影響市場動態,導致價格透明度和風險管理的重要性日益凸顯。數位化也在改變整個產業,先進的貨運管理平台正成為採購和物流營運中不可或缺的要素。隨著客戶對可視性、營運效率和即時貨物追蹤的需求不斷成長,技術驅動的貨運代理服務在全球運輸網路中的重要性也日益凸顯。
| 市場範圍 | |
|---|---|
| 開始年份 | 2025 |
| 預測期 | 2026-2035 |
| 上市時的市場規模 | 1662億美元 |
| 預計金額 | 2678億美元 |
| 複合年成長率 | 5.2% |
累計到2025年,運輸和倉儲產業的收入將達到1,034億美元,佔整體市場的62.2%。雖然這一成長率略低於市場平均水平,但這反映出物流業正向高附加價值解決方案轉型,而非核心運輸業務的萎縮。服務供應商正在拓展其綜合服務,將運輸管理、倉儲、庫存管理和物流協調相結合,從而在提升每次運輸附加價值的同時,加強客戶關係並提高營運效率。
中國貨運代理市場預計到2025年將達到414億美元,到2035年將達到711億美元。市場成長主要得益於中國強勁的出口活動、完善的物流基礎設施以及在國際貿易網路中的戰略地位。該地區作為重要的製造、採購和全球分銷中心,持續為貨運代理服務創造需求。不斷成長的貿易量、日益擴大的跨境物流需求以及供應鏈的日益複雜化,都全部區域的長期市場機會提供了支撐。
目錄
第1章:調查方法和範圍
第2章執行摘要
第3章 行業洞察
- 產業生態系分析
- 供應商情況
- 原物料供應商
- 零件供應商
- 製造商
- 服務供應商
- 分銷管道
- 最終用途
- 成本結構
- 利潤率
- 每個階段增加的價值
- 垂直整合趨勢
- 顛覆者
- 供應商情況
- 影響產業的因素
- 促進因素
- 全球貿易與跨境電子商務的擴張
- 電子商務和全通路零售物流的成長
- 供應鏈多元化和近岸外包的努力
- 物流與運輸職能外包增加
- 對高價值貨物的需求日益成長,這要求嚴格遵守交貨時間表。
- 產業潛在風險與挑戰
- 地緣政治緊張局勢與貿易不確定性
- 貨運和燃油價格波動
- 市場機遇
- 新興貿易走廊的擴張
- 引入數位化貨物和物流平台
- 低溫運輸和溫控物流的成長
- 對永續和環保物流解決方案的需求日益成長
- 擴展一體化端到端供應鏈服務
- 促進因素
- 成長潛力分析
- 價格分析
- 對過去價格趨勢的分析
- 依球員類型分類的定價策略(高級球員、超值球員、成本加成球員)
- 監理情勢
- 北美洲
- 美國:聯邦海事委員會(FMC)-關於海洋運輸仲介業者(OTI)的法規
- 美國:運輸安全局(TSA) 航空貨物安全要求
- 美國:海關與邊防安全(CBP),反恐海關與貿易夥伴關係(CTPAT)
- 加拿大:加拿大邊境服務局 (CBSA) 海關條例
- 加拿大:「合作夥伴保護計畫 (PIP)」供應鏈安全計畫
- 加拿大:各省電動自行車法規
- 歐洲
- 歐盟海關法(UCC)
- 經認證的經營者(AEO)計劃
- 歐盟進口管制系統2(ICS2)
- 歐盟公路貨運交通運輸一攬子計劃
- 歐盟排放交易體系(ETS)在航運業的應用
- 亞太地區
- 中國海關“先進認證企業(ACE)計畫”
- 中國對國際貨運代理經營者的規定
- 日本的經認證的經濟運營商(AEO)制度
- 澳洲可信賴貿易商計劃 (ATT)
- 新加坡海關的「貿易優先」和安全貿易夥伴關係(STP)
- 拉丁美洲
- 巴西的經認證的經營者(AEO)計劃
- 巴西國家陸路運輸管理局 (ANTT) 貨運法規
- 墨西哥認證經濟運營商(OEA)計劃
- 墨西哥海關法與對外貿易法規
- 中東和非洲
- 海灣合作理事會統一海關法
- 阿拉伯聯合大公國經認證的經營者(AEO)計劃
- 沙烏地阿拉伯天課稅和海關管理局 (ZATCA) 的物流法規
- 南非海關與消費稅法
- 非洲自由貿易區(AfCFTA)貿易便利化框架
- 北美洲
- 技術與創新展望
- 最新技術
- 新興技術
- 波特的分析
- PESTLE分析
- 專利分析
- 人工智慧和生成式人工智慧對市場的影響
- 利用人工智慧改造現有經營模式
- 設計自動化最佳化
- 用於需求預測的供應鏈人工智慧
- 按細分市場分類的生成式人工智慧用例和部署藍圖
- 風險、限制和監管考量
- 永續性和環境方面
- 永續計劃
- 減少廢棄物策略
- 生產中的能源效率
- 具有環保意識的舉措
- 考慮碳足跡
- 客戶和托運人分析
- 按公司規模分類的貨運採購趨勢
- 產業特定關鍵供應商選擇標準
- 客戶問題分析
- 貨運代理商轉換趨勢與客戶維繫因素
- 托運人對數位化採用的偏好
- 生產能力和運轉率分析
- 航空貨運能力利用率趨勢
- 海上貨櫃運輸能力和運轉率趨勢
- 卡車運輸能力供應狀況及運轉率
- 生產能力區域不平衡
- 全球貿易路線分析
- 亞洲-北美走廊
- 亞歐走廊
- 亞洲內部走廊
- 歐洲-北美走廊
- 中東-非洲走廊
- 新興的南南貿易走廊
- 市場風險評估
- 地緣政治風險矩陣
- 港口功能中斷風險評估
- 網路安全風險敞口
- 監管和合規風險
- 氣候和極端天氣風險
- 預測假設和情境分析
- 基本案例:驅動複合年成長率的關鍵宏觀經濟與產業變量
- 樂觀情境:宏觀經濟與產業的順風
- 悲觀情景:宏觀經濟放緩或產業逆風
第4章 競爭情勢
- 介紹
- 企業市佔率分析
- 北美洲
- 歐洲
- 亞太地區
- 拉丁美洲
- 中東和非洲
- 競爭定位矩陣
- 主要進展
- 併購
- 夥伴關係和聯盟
- 新產品發布
- 業務拓展計劃及資金籌措
- 按公司規模進行基準測試
- 排名分類標準與遴選標準
- 按銷售額、地區和創新能力分類的層級定位矩陣。
第5章 市場估計與預測:依運輸方式分類,2022-2035年
- 海運貨運代理
- 空運貨運代理
- 公路貨運代理
- 鐵路貨運代理
- 多模態/聯運貨運代理
第6章 市場估計與預測:依服務業分類,2022-2035年
- 運輸/倉儲業
- 附加價值服務
- 包裝
- 其他
第7章 市場估計與預測:依最終用途分類,2022-2035年
- 製造業和工業
- 零售與電子商務
- 醫療和藥品
- 車
- 石油、天然氣和能源
- 食品/飲料
- 其他
第8章 市場估算與預測:依客戶分類,2022-2035年
- B2B
- B2C
第9章 市場估計與預測:依公司規模分類,2022-2035年
- 小型企業
- 大公司
第10章 市場估價與預測:依地區分類,2022-2035年
- 北美洲
- 美國
- 加拿大
- 歐洲
- 英國
- 德國
- 法國
- 義大利
- 西班牙
- 比利時
- 荷蘭
- 瑞典
- 俄羅斯
- 亞太地區
- 中國
- 印度
- 日本
- 澳洲
- 新加坡
- 韓國
- 越南
- 印尼
- 泰國
- 拉丁美洲
- 巴西
- 墨西哥
- 阿根廷
- 中東和非洲
- 南非
- 沙烏地阿拉伯
- UAE
- 土耳其
第11章:公司簡介
- 全球公司:
- AP Moller-Maersk
- CH Robinson Worldwide
- CEVA Logistics
- DHL Global Forwarding
- DSV
- Expeditors International
- GEODIS
- Kuehne+Nagel International
- Nippon Express
- Sinotrans
- 當地公司
- Agility Logistics
- Aramex
- Bollore Logistics
- DACHSER
- Hellmann Worldwide Logistics
- Kerry Logistics Network(KLN)
- Morrison Express
- Savino Del Bene
- Toll
- Yusen Logistics
- 新興企業
- Flexport
- Forto
- Freights
- iContainers
- Zencargo
The Global Freight Forwarding Market was valued at USD 166.2 billion in 2025 and is estimated to grow at a CAGR of 5.2% to reach USD 267.8 billion by 2035.
Growth in the market continues to be supported by rising international trade activity and the increasing complexity of global supply chains. Freight forwarding providers play a critical role in coordinating transportation networks, managing customs requirements, optimizing shipping routes, and ensuring timely delivery across multiple regions. As companies diversify manufacturing and sourcing operations, demand for efficient logistics coordination is increasing across global markets. The ongoing reconfiguration of supply chains is changing shipment origins and trade patterns, creating new opportunities for freight forwarding companies without reducing overall demand for forwarding services. Businesses are increasingly seeking flexible logistics solutions capable of managing multi-country sourcing strategies and evolving trade requirements. At the same time, fluctuating transportation costs and fuel-related expenses continue to influence market dynamics, encouraging greater emphasis on pricing transparency and risk management. Digitalization is also transforming the industry, with advanced freight management platforms becoming an essential component of procurement and logistics operations. As customers demand greater visibility, operational efficiency, and real-time shipment tracking, technology-enabled freight forwarding services are becoming increasingly important across global transportation networks.
| Market Scope | |
|---|---|
| Start Year | 2025 |
| Forecast Year | 2026-2035 |
| Start Value | $166.2 Billion |
| Forecast Value | $267.8 Billion |
| CAGR | 5.2% |
The transportation and warehousing segment generated USD 103.4 billion in 2025, accounting for 62.2% share. Although growth remains slightly below the overall market average, this reflects an evolving service mix that increasingly favors higher-value logistics solutions rather than weakness in core transportation activities. Service providers are expanding integrated offerings that combine transportation management, storage capabilities, inventory control, and logistics coordination, enabling them to generate greater value per shipment while strengthening customer relationships and improving operational efficiency.
China Freight Forwarding Market accounted for USD 41.4 billion in 2025 and is expected to reach USD 71.1 billion by 2035. Market growth is supported by the country's strong export activity, extensive logistics infrastructure, and strategic role within international trade networks. The region continues to serve as a major hub for manufacturing, sourcing, and global distribution, creating sustained demand for freight forwarding services. Growing trade volumes, expanding cross-border logistics requirements, and increasing supply chain complexity continue to support long-term market opportunities throughout the country and the broader Asia Pacific region.
Key participants operating in the global freight forwarding market include DHL Global, Kuehne+Nagel International, DSV A/S, CEVA Logistics, Sinotrans, GEODIS, Expeditors International, Nippon Express, A.P. Moller - Maersk, and C.H. Robinson. Companies operating in the freight forwarding market are adopting a variety of strategic initiatives to strengthen their market position and expand their global presence. Investments in digital transformation remain a primary focus, with providers implementing advanced logistics platforms, real-time shipment visibility tools, data analytics, and automation technologies to improve service efficiency. Market participants are also expanding integrated logistics capabilities by combining transportation, warehousing, inventory management, and value-added supply chain services into comprehensive solutions. Strategic acquisitions, regional expansion initiatives, and partnerships with carriers and logistics providers are helping companies broaden their geographic reach and service offerings. In addition, businesses are prioritizing sustainability initiatives, operational optimization, and customer-centric service models to enhance competitiveness.
Table of Contents
Chapter 1 Methodology & Scope
- 1.1 Research approach
- 1.2 Quality Commitments
- 1.2.1 GMI AI policy & data integrity commitment
- 1.2.1.1 Source consistency protocol
- 1.2.1 GMI AI policy & data integrity commitment
- 1.3 Research Trail & Confidence Scoring
- 1.3.1 Research Trail Components
- 1.3.2 Scoring Components
- 1.4 Data Collection
- 1.4.1 Partial list of primary sources
- 1.5 Data mining sources
- 1.5.1 Paid sources
- 1.5.1.1 Sources, by region
- 1.5.1 Paid sources
- 1.6 Base estimates and calculations
- 1.6.1 Base year calculation
- 1.7 Forecast model
- 1.7.1 Quantified market impact analysis
- 1.7.1.1 Mathematical impact of growth parameters on forecast
- 1.7.1 Quantified market impact analysis
- 1.8 Research transparency addendum
- 1.8.1 Source attribution framework
- 1.8.2 Quality assurance metrics
- 1.8.3 Our commitment to trust
Chapter 2 Executive Summary
- 2.1 Industry 360° synopsis
- 2.2 Key market trends
- 2.2.1 Mode of Transport
- 2.2.2 Service
- 2.2.3 End Use
- 2.2.4 Customer
- 2.2.5 Enterprise Size
- 2.2.6 Region
- 2.3 TAM Analysis, 2026-2035
- 2.4 CXO perspectives: Strategic imperatives
Chapter 3 Industry Insights
- 3.1 Industry ecosystem analysis
- 3.1.1 Supplier landscape
- 3.1.1.1 Raw material suppliers
- 3.1.1.2 Component suppliers
- 3.1.1.3 Manufacturers
- 3.1.1.4 Service providers
- 3.1.1.5 Distribution channel
- 3.1.1.6 End Use
- 3.1.2 Cost structure
- 3.1.3 Profit margin
- 3.1.4 Value addition at each stage
- 3.1.5 Vertical integration trends
- 3.1.6 Disruptors
- 3.1.1 Supplier landscape
- 3.2 Industry impact forces
- 3.2.1 Growth drivers
- 3.2.1.1 Expansion of Global Trade and Cross-Border Commerce
- 3.2.1.2 Growth of E-Commerce and Omnichannel Retail Logistics
- 3.2.1.3 Supply Chain Diversification and Nearshoring Initiatives
- 3.2.1.4 Increasing Outsourcing of Logistics and Transportation Functions
- 3.2.1.5 Rising Demand for High-Value and Time-Sensitive Shipments
- 3.2.2 Industry pitfalls & challenges
- 3.2.2.1 Geopolitical Tensions and Trade Uncertainties
- 3.2.2.2 Volatility in Freight Rates and Fuel Prices
- 3.2.3 Market opportunities
- 3.2.3.1 Expansion of Emerging Trade Corridors
- 3.2.3.2 Adoption of Digital Freight and Logistics Platforms
- 3.2.3.3 Growth of Cold Chain and Temperature-Controlled Logistics
- 3.2.3.4 Increasing Demand for Sustainable and Green Logistics Solutions
- 3.2.3.5 Expansion of Integrated End-to-End Supply Chain Services
- 3.2.1 Growth drivers
- 3.3 Growth potential analysis
- 3.4 Pricing Analysis (Driven by Primary Research)
- 3.4.1 Historical Price Trend Analysis
- 3.4.2 Pricing Strategy by Player Type (Premium / Value / Cost-plus)
- 3.5 Regulatory landscape
- 3.5.1 North America
- 3.5.1.1 U.S.: Federal Maritime Commission (FMC) - Ocean Transportation Intermediary (OTI) Regulations
- 3.5.1.2 U.S.: Transportation Security Administration (TSA) Air Cargo Security Requirements
- 3.5.1.3 U.S.: Customs and Border Protection (CBP) Customs Trade Partnership Against Terrorism (CTPAT)
- 3.5.1.4 Canada: Canada Border Services Agency (CBSA) Customs Regulations
- 3.5.1.5 Canada: Partners in Protection (PIP) Supply Chain Security Program
- 3.5.1.6 Canada: Provincial E-Bike Regulations
- 3.5.2 Europe
- 3.5.2.1 European Union Customs Code (UCC)
- 3.5.2.2 Authorized Economic Operator (AEO) Program
- 3.5.2.3 EU Import Control System 2 (ICS2)
- 3.5.2.4 EU Mobility Package for Road Freight Transport
- 3.5.2.5 EU Emissions Trading System (ETS) for Maritime Transport
- 3.5.3 Asia-Pacific
- 3.5.3.1 China Customs Advanced Certified Enterprise (ACE) Program
- 3.5.3.2 China Regulations on International Freight Forwarding Enterprises
- 3.5.3.3 Japan Authorized Economic Operator (AEO) Framework
- 3.5.3.4 Australia Trusted Trader Program (ATT)
- 3.5.3.5 Singapore Customs TradeFIRST & Secure Trade Partnership (STP)
- 3.5.4 Latin America
- 3.5.4.1 Brazil Authorized Economic Operator (AEO) Program
- 3.5.4.2 Brazil National Land Transport Agency (ANTT) Freight Regulations
- 3.5.4.3 Mexico Authorized Economic Operator (OEA) Program
- 3.5.4.4 Mexico Customs Law and Foreign Trade Regulations
- 3.5.5 Middle East & Africa
- 3.5.5.1 GCC Unified Customs Law
- 3.5.5.2 UAE Authorized Economic Operator (AEO) Program
- 3.5.5.3 Saudi Arabia Zakat, Tax and Customs Authority (ZATCA) Logistics Regulations
- 3.5.5.4 South Africa Customs and Excise Act
- 3.5.5.5 African Continental Free Trade Area (AfCFTA) Trade Facilitation Framework
- 3.5.1 North America
- 3.6 Technology and Innovation landscape
- 3.6.1 Current technologies
- 3.6.2 Emerging technologies
- 3.7 Porter's analysis
- 3.8 PESTEL analysis
- 3.9 Patent analysis (Driven by Primary Research)
- 3.10 Impact of AI & generative AI on the market
- 3.10.1 AI-Driven Disruption of Existing Business Models
- 3.10.2 Automated design optimization
- 3.10.3 Supply chain AI for demand forecasting
- 3.10.4 GenAI use cases & adoption roadmap by segment
- 3.10.5 Risks, Limitations & Regulatory Considerations
- 3.11 Sustainability and environmental aspects
- 3.11.1 Sustainable practices
- 3.11.2 Waste reduction strategies
- 3.11.3 Energy efficiency in production
- 3.11.4 Eco-friendly Initiatives
- 3.11.5 Carbon footprint considerations
- 3.12 Customer & Shipper Analysis
- 3.12.1 Freight Procurement Behavior by Enterprise Size
- 3.12.2 Key Vendor Selection Criteria by Industry
- 3.12.3 Customer Pain Point Analysis
- 3.12.4 Freight Forwarder Switching Trends & Retention Factors
- 3.12.5 Digital Adoption Preferences Among Shippers
- 3.13 Capacity & Utilization Analysis
- 3.13.1 Air Freight Capacity Utilization Trends
- 3.13.2 Ocean Container Capacity Utilization Trends
- 3.13.3 Trucking Capacity Availability & Utilization
- 3.13.4 Regional Capacity Imbalances
- 3.14 Global Trade Lane Analysis
- 3.14.1 Asia-North America Corridor
- 3.14.2 Asia-Europe Corridor
- 3.14.3 Intra-Asia Corridor
- 3.14.4 Europe-North America Corridor
- 3.14.5 Middle East-Africa Corridor
- 3.14.6 Emerging South-South Trade Corridors
- 3.15 Market Risk Assessment
- 3.15.1 Geopolitical Risk Matrix
- 3.15.2 Port Disruption Risk Assessment
- 3.15.3 Cybersecurity Risk Exposure
- 3.15.4 Regulatory & Compliance Risks
- 3.15.5 Climate & Extreme Weather Risks
- 3.16 Forecast assumptions & scenario analysis (Driven by Primary Research)
- 3.16.1 Base Case - key macro & industry variables driving CAGR
- 3.16.2 Optimistic Scenarios - Favorable Macro and Industry Tailwinds
- 3.16.3 Pessimistic Scenario - Macroeconomic slowdown or industry headwinds
Chapter 4 Competitive Landscape, 2025
- 4.1 Introduction
- 4.2 Company market share analysis
- 4.2.1 North America
- 4.2.2 Europe
- 4.2.3 Asia-Pacific
- 4.2.4 Latin America
- 4.2.5 Middle East & Africa
- 4.3 Competitive positioning matrix
- 4.4 Key developments
- 4.4.1 Mergers & acquisitions
- 4.4.2 Partnerships & collaborations
- 4.4.3 New product launches
- 4.4.4 Expansion plans and funding
- 4.5 Company tier benchmarking
- 4.5.1 Tier classification criteria & qualifying thresholds
- 4.5.2 Tier positioning matrix by revenue, geography & innovation
Chapter 5 Market Estimates & Forecast, By Mode of Transport, 2022 - 2035 ($Mn, 000'Tons)
- 5.1 Key trends
- 5.2 Ocean freight forwarding
- 5.3 Air freight forwarding
- 5.4 Road freight forwarding
- 5.5 Rail freight forwarding
- 5.6 Multimodal/Intermodal Freight Forwarding
Chapter 6 Market Estimates & Forecast, By Service, 2022 - 2035 ($Mn)
- 6.1 Key trends
- 6.2 Transportation & warehousing
- 6.3 Value-added services
- 6.4 Packaging
- 6.5 Others
Chapter 7 Market Estimates & Forecast, By End Use, 2022 - 2035 ($Mn, 000'Tons)
- 7.1 Key trends
- 7.2 Manufacturing & Industrial
- 7.3 Retail & E-Commerce
- 7.4 Healthcare & Pharmaceuticals
- 7.5 Automotive
- 7.6 Oil, Gas & Energy
- 7.7 Food & Beverages
- 7.8 Others
Chapter 8 Market Estimates & Forecast, By Customer, 2022 - 2035 ($Mn, 000'Tons)
- 8.1 Key trends
- 8.2 B2B
- 8.3 B2C
Chapter 9 Market Estimates & Forecast, By Enterprise Size, 2022 - 2035 ($Mn, 000'Tons)
- 9.1 Key trends
- 9.2 Small and Medium Enterprises
- 9.3 Large Enterprises
Chapter 10 Market Estimates & Forecast, By Region, 2022 - 2035 ($Mn, 000'Tons)
- 10.1 North America
- 10.1.1 US
- 10.1.2 Canada
- 10.2 Europe
- 10.2.1 UK
- 10.2.2 Germany
- 10.2.3 France
- 10.2.4 Italy
- 10.2.5 Spain
- 10.2.6 Belgium
- 10.2.7 Netherlands
- 10.2.8 Sweden
- 10.2.9 Russia
- 10.3 Asia Pacific
- 10.3.1 China
- 10.3.2 India
- 10.3.3 Japan
- 10.3.4 Australia
- 10.3.5 Singapore
- 10.3.6 South Korea
- 10.3.7 Vietnam
- 10.3.8 Indonesia
- 10.3.9 Thailand
- 10.4 Latin America
- 10.4.1 Brazil
- 10.4.2 Mexico
- 10.4.3 Argentina
- 10.5 MEA
- 10.5.1 South Africa
- 10.5.2 Saudi Arabia
- 10.5.3 UAE
- 10.5.4 Turkey
Chapter 11 Company Profiles
- 11.1 Global players:
- 11.1.1 A.P. Moller - Maersk
- 11.1.2 C.H. Robinson Worldwide
- 11.1.3 CEVA Logistics
- 11.1.4 DHL Global Forwarding
- 11.1.5 DSV
- 11.1.6 Expeditors International
- 11.1.7 GEODIS
- 11.1.8 Kuehne+Nagel International
- 11.1.9 Nippon Express
- 11.1.10 Sinotrans
- 11.2 Regional Players
- 11.2.1 Agility Logistics
- 11.2.2 Aramex
- 11.2.3 Bollore Logistics
- 11.2.4 DACHSER
- 11.2.5 Hellmann Worldwide Logistics
- 11.2.6 Kerry Logistics Network (KLN)
- 11.2.7 Morrison Express
- 11.2.8 Savino Del Bene
- 11.2.9 Toll
- 11.2.10 Yusen Logistics
- 11.3 Emerging Players
- 11.3.1 Flexport
- 11.3.2 Forto
- 11.3.3 Freights
- 11.3.4 iContainers
- 11.3.5 Zencargo

 2026-2030年全球貨運市場
 東協貨運代理:市場佔有率分析、產業趨勢與統計及成長預測(2026-2031)貨運:市場佔有率分析、產業趨勢與統計、成長預測(2026-2031)
 航空貨運代理市場-2026-2032年全球市場預測
 全球貨運代理市場:2026 年
 貨運市場分析及至2035年預測:類型、服務、技術、組件、應用、最終用戶、解決方案、運輸方式
 貨運代理市場:按運輸方式、客戶類型、服務、應用和地區分類的市場規模、佔有率和趨勢分析,以及細分市場預測(2026-2033 年)
 航空貨運代理市場報告:按類型、服務類型、最終用戶行業和地區分類(2026-2034 年)
 貨運市場:依運輸方式、服務類型、最終用戶產業及地區分類
 2026年全球國際貨運代理市場報告