


 |
市場調查報告書
商品編碼
2123147
重型卡車:市場佔有率分析、行業趨勢和統計數據、成長預測(2026-2031 年)Heavy Duty Trucks - Market Share Analysis, Industry Trends & Statistics, Growth Forecasts (2026 - 2031) |
||||||

※ 本網頁內容可能與最新版本有所差異。詳細情況請與我們聯繫。
根據 Mordor Intelligence 預測,重型卡車市場規模將從 2025 年的 2,208.4 億美元成長到 2026 年的 2,325.7 億美元,到 2031 年將達到 3012.3 億美元,2026 年至 2031 年的複合年成長率為 5.31%。
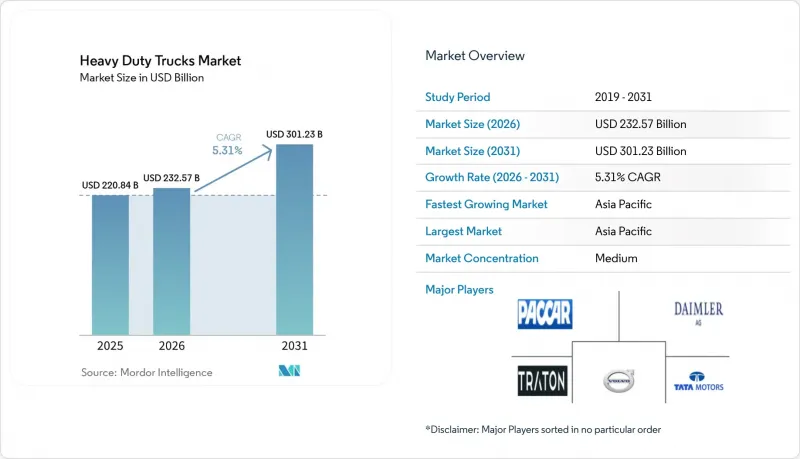
本報告按負載容量(10-15噸及15噸以上)、等級(7級及8級)、動力系統(柴油、純電動及其他)、應用領域(建築、採礦等)、車身類型(牽引車-半拖車等)、銷售管道(OEM等)及地區(北美等)進行細分。市場預測以貨幣價值(美元)和銷售(輛)兩種形式呈現。
全球重型卡車市場趨勢及洞察
不斷擴大的電子商務貨運量
電子商務的蓬勃發展帶動了貨運量的成長,透過最佳化最後一公里配送和提高本地配送網路密度,推動了對重型卡車的需求。線上零售的激增也催生了對中型電動卡車的需求,尤其是在零排放法規日益嚴格限制柴油車營運的都市區。隨著線上零售的進一步滲透,小包裹和零擔貨運正在改變車輛組成。美國卡車運輸協會 (ATA) 預測,美國貨運量將從 2024 年的 112.7 億噸增至 2035 年的 139.9 億噸,這將對本地運輸車輛構成持續壓力。加州、紐約州和一些歐洲城市零排放區的設立,迫使營運商轉向使用 7 級和更輕型的 8 級牽引車,這些車輛的運作週期與目前 200-300 公里的電池續航里程相匹配。亞馬遜承諾在2030年部署10萬輛電動送貨車,這清楚地表明了早期採用者願意承擔合規和品牌定位相關的更高資本成本。對於企業而言,對時效性貨物收取的附加費也是一項利好,可以部分抵消車輛價格上漲的影響。向高價值貨物的轉變進一步推動了對遠端資訊處理和預測性維護的投資,以最大限度地延長運作。
嚴格的全球排放氣體法規正在加速車輛更換。
主要市場的法律規範正對車輛電氣化施加前所未有的壓力。美國環保署 (EPA) 的第三階段標準要求到 2032 年,50% 的商用車輛必須實現零排放。監管機構正透過收緊氮氧化物 (NOx) 和二氧化碳 (CO2) 的排放限制來縮短車輛更換週期。 EPA 的「清潔卡車計畫」規定,到 2032 年車型,40% 的 8 級新售牽引車必須為零排放車輛,並於 2027 年開始分階段實施。將於 2027 年生效的歐盟 VII 標準將強制要求進行實際道路測試並安裝車載診斷系統,這將使柴油引擎的成本增加 10-15%,並縮小與電池式電動車的價格差距。車隊營運商如果推遲電氣化,將面臨在受監管區域內老舊柴油車輛轉售價值下降的風險,而加州的「先進清潔卡車 (ACT)」法規進一步加劇了這一趨勢。中國零排放重型車輛的快速普及(佔全球電動卡車銷售的 80% 以上)表明,政策可以加速市場轉型。
零排放重型卡車的初始成本很高
8級純電動曳引機的價格仍然是同類柴油車的兩到三倍,預計到2025年,純電動曳引機的標價將在35萬至40萬美元之間,而傳統柴油車的標價則在15萬至18萬美元之間。雖然加州的HVIP補貼券(每輛車最高可達24萬美元)等補貼措施可以緩解價格差異,但並不能完全消除這種差異。在對價格高度敏感的經濟體中,現金流的限制意味著小規模車隊營運商甚至無法承受補貼後的價格差額。此外,金融機構也要求更高的利率,以彌補七年後電池殘值和性能劣化帶來的不確定性。
細分市場分析
預計到2025年,重量超過15噸的重型卡車市場仍將佔據主導地位,銷量佔比高達61.40%。這反映了長途運輸和建築物流的重要性依然不減。儘管在基礎設施投資的支持下,這一細分市場持續成長,但由於電池增加的重量導致罰款不斷增加,其成長受到一定限制。同時,10-15噸級卡車市場正以9.50%的複合年成長率快速擴張。這一強勁成長主要得益於越來越多的城市給予輕型車輛配送特權。歐洲提案的純電動剛性卡車1噸重量限制旨在平衡有效負載容量,並鼓勵汽車製造商拓展產品線。
營運商表示,中型卡車在續航里程、負載容量和底盤成本之間實現了「恰到好處」的平衡。戴姆勒的eActros 300在瑞士的實地測試中實現了220公里的實際續航里程,足以滿足兩班工作日的需求,只需夜間充電即可。預計到2026年,電池價格將接近每千瓦時110美元,屆時中型卡車的電氣化將更具經濟吸引力,投資回收期不到三年。加州和巴黎等國發出的政策訊號——禁止12噸以上的柴油車輛在2030年後在城市範圍內行駛——進一步支撐了市場需求。因此,預計到2031年,10-15噸級卡車在重型卡車市場的佔有率將成長至約30%。
受州際運輸和大型建築項目需求的推動,即使到了2025年,8級牽引車仍保持著70.8%的市場佔有率。預計7級牽引車將以8.30%的複合年成長率成長,其150-200英里的運作里程與目前電池的續航里程相當,無需中途加油。加州空氣資源委員會(CARB)強制規定,到2032年,7級牽引車銷售量中必須有40%為零排放車輛,這加速了原始設備製造商(OEM)的藍圖。
麥克卡車的「MD Electric」電動卡車配備150千瓦時電池組,續航里程達140英里,在路線可預測、充電可規劃的飲料和餐飲服務業取得了成功。雖然8級重型卡車的電氣化仍處於試驗階段,但潛力巨大。兆瓦級充電樁正擴大部署在美國的5號州際公路和德國的高速公路上,充電時間最短可達45分鐘。隨著中型卡車的普及,預計到2031年,8級重型卡車的市佔率將降至68%以下。
區域分析
預計到2025年,亞太地區將以47.21%的市場佔有率引領全球市場,並在2031年之前保持9.30%的複合年成長率,這主要得益於中國龐大的製造業規模和區域氫能走廊的建設。中國重汽、一汽和東風三大汽車製造商在該地區佔超過60%的市場佔有率,這得益於中國國六標準加速都市區電氣化進程,以及北京和上海市政府的獎勵。印度塔塔汽車公司於2024年推出了Prima EV電動車,目標客戶為大都會圈的貨運以及特定礦業客戶。同時,德里和馬哈拉斯特拉邦的政府補貼計畫旨在2028年部署8,000輛零排放卡車。日本福島氫能高速公路支援燃料電池卡車的示範項目,而澳洲的Fort Esk Metals Group正在投資氫能運輸,以減少範圍1排放。
北美佔28%的市場佔有率,這主要得益於美國環保署的清潔卡車計畫和聯邦政府對充電基礎設施的津貼。加州的先進清潔卡車法規和高達每輛車24萬美元的獎勵,支持全美規模最大的零排放車輛推廣計畫。在加拿大,一項高達20萬加元的補貼計畫正在推動溫莎-魁北克路線上的電動卡車普及,而墨西哥的跨境運輸公司也在對其車輛進行電氣化改造,以確保能夠繼續進入加州。預計到2025年,歐洲將佔18%的市場佔有率,這主要得益於歐VII排放標準以及德國高速公路上安裝的兆瓦級充電樁。英國已強制規定到2030年,零排放卡車銷售必須佔卡車總銷量的10%,並計畫在2040年實現100%的目標。法國和義大利正在支持液化天然氣作為過渡燃料,而斯堪地那維亞國家則在各個層面推廣純電動卡車。
中東和非洲合計佔7%,其中中國產純電動卡車正在杜拜和利雅德進行都市區配送試辦。然而,由於極端溫度下需要先進的溫度控管,其普及速度較為緩慢。在智利和秘魯等拉丁美洲礦區,氫燃料電池的需求已初見端倪,但高昂的資金籌措成本和基礎設施不足限制了整體市場成長。
其他好處:
- Excel格式的市場預測(ME)表
- 3個月的分析師支持
目錄
第1章:引言
- 研究假設和市場定義
- 調查範圍
第2章:調查方法
第3章執行摘要
第4章 市場狀況
- 市場概覽
- 市場促進因素
- 電子商務推動貨運量成長
- 更嚴格的全球排放法規正在推動車輛更換。
- 基礎建設發展經濟刺激方案
- 亞太地區氫能走廊試驗計畫
- 利用OTA最佳化車隊管理員的TCO
- 南美洲採礦業的電氣化努力
- 市場限制因素
- 零排放重型卡車的初始成本高
- 柴油價格波動正在影響購買週期。
- 半導體短缺導致ADAS和電動車的生產延誤。
- 歐盟更嚴格的軸荷規定限制了負載容量的經濟效益。
- 價值供應鏈分析
- 監理情勢
- 技術展望
- 波特五力分析
第5章 市場規模與成長預測
- 按噸位
- 10-15噸
- 超過15噸
- 尺寸
- 七年級
- 八年級
- 依推進類型
- 柴油引擎
- 電池式電動車
- 燃料電池電動車(FCEV)
- 替代燃料(壓縮天然氣、液化天然氣、生質柴油)
- 透過使用
- 建築和採礦
- 貨運/物流
- 地方政府與公共產業
- 其他
- 卡車車身類型
- 聯結車
- 剛性傾卸
- 油輪
- 其他
- 按銷售管道
- OEM/首次採購
- 租賃和出租
- 改裝
- 按地區
- 北美洲
- 美國
- 加拿大
- 其他北美國家
- 南美洲
- 巴西
- 阿根廷
- 其他南美國家
- 歐洲
- 德國
- 英國
- 法國
- 義大利
- 俄羅斯
- 其他歐洲國家
- 亞太地區
- 中國
- 印度
- 日本
- 韓國
- 澳洲和紐西蘭
- 其他亞太國家
- 中東和非洲
- 沙烏地阿拉伯
- 阿拉伯聯合大公國
- 埃及
- 土耳其
- 南非
- 其他中東和非洲國家
- 北美洲
第6章 競爭情勢
- 市場集中度
- 策略趨勢
- 市佔率分析
- 公司簡介
- Daimler Truck Holding AG
- Traton SE
- Volvo Group
- PACCAR Inc.
- Dongfeng Motor Corporation
- Tata Motors Ltd.
- FAW Group Corp.
- CNHTC(Sinotruk)
- Ashok Leyland Ltd
- Isuzu Motors Ltd.
- Hino Motors Ltd.
- Navistar International
- Iveco Group NV
- Hyundai Motor Co.
- Nikola Corporation
- JAC Motors
- Kamaz PJSC
- Foton Motor Co. Ltd.
第7章 市場機會與未來展望
According to Mordor Intelligence, the heavy-duty trucks market size is expected to grow from USD 220.84 billion in 2025 to USD 232.57 billion in 2026 and is forecast to reach USD 301.23 billion by 2031 at a 5.31% CAGR over 2026-2031.
This report is Segmented by Tonnage Type (10 To 15 T and More Than 15 T), Class (Class 7 and Class 8), Propulsion Type (Diesel, Battery-Electric, and More), Application (Construction and Mining, and More), Truck Body Type (Tractor-Trailer, and More), Sales Channel (OEM, and More), and Geography (North America, and More). The Market Forecasts are Provided in Terms of Value (USD) and Volume (Units).
Global Heavy Duty Trucks Market Trends and Insights
Expanding E-commerce Freight Volumes
E-commerce freight expansion drives heavy-duty truck demand through last-mile delivery optimization and regional distribution network densification. The surge in online retail creates demand for medium-duty electric trucks in urban environments, where zero-emission mandates increasingly restrict diesel operations. Parcel and less-than-truckload shipments are reshaping fleet composition as online retail penetration deepens. The American Trucking Associations projects U.S. freight tonnage will rise from 11.27 billion tons in 2024 to 13.99 billion tons by 2035, placing sustained pressure on regional haul assets. Zero-emission zones in California, New York, and several European cities push operators toward Class 7 and lighter Class 8 tractors, duty cycles that align with the current battery range of 200-300 kilometers. Amazon's pledge to field 100,000 electric delivery vehicles by 2030 illustrates early-adopter willingness to absorb capital premiums for compliance and brand positioning. Operators also benefit from premium freight rates on time-sensitive cargo, partially offsetting higher vehicle prices. The shift toward higher-value goods further incentivizes investments in telematics and predictive maintenance that maximize uptime.
Strict Global Emission Mandates Driving Fleet Renewal
Regulatory frameworks across major markets create unprecedented pressure for fleet electrification, with the EPA's Phase 3 standards requiring 50% of vocational vehicles to be zero-emission by 2032. Regulators are compressing replacement cycles by tightening NOx and CO2 limits. The U.S. EPA Clean Trucks Plan stipulates that zero-emission models must reach 40% of new Class 8 tractor sales by model year 2032, with interim steps beginning in 2027. Euro VII standards entering force in 2027 impose real-world testing and onboard diagnostics that add 10-15% to diesel engine costs, narrowing the price gap with battery-electric alternatives. Fleets delaying electrification risk stranded assets as resale values for older diesels fall in restricted zones, a trend amplified by California's Advanced Clean Trucks rule. China's rapid adoption of zero-emission heavy-duty vehicles, with over 80% of global electric truck sales, demonstrates how policy can accelerate market transformation.
High Upfront Cost of Zero-emission Heavy Trucks
Battery-electric Class 8 tractors still cost two to three times more than diesel equivalents, with 2025 list prices of USD 350,000-400,000 versus USD 150,000-180,000 for conventional units. Subsidies such as California's HVIP vouchers, which can reach USD 240,000 per truck, ease but do not eliminate the premium. In price-sensitive economies, cash-flow constraints prevent smaller fleets from absorbing even subsidized differentials. Financiers also demand higher interest spreads to compensate for uncertain residual values and battery degradation beyond year 7.
Other drivers and restraints analyzed in the detailed report include:
- Infrastructure Stimulus Packages
- Hydrogen Corridor Pilot Programs in Asia Pacific
- Volatile Diesel Price Environment Impacting Purchase Cycles
For complete list of drivers and restraints, kindly check the Table Of Contents.
Segment Analysis
The heavy-duty trucks market size for vehicles above 15 tons stayed dominant with a 61.40% revenue share in 2025, reflecting the still-critical role of long-haul and construction logistics. The segment continues to grow, supported by infrastructure spending but tempered by higher battery mass penalties. Conversely, the 10-15 ton bracket is advancing at a 9.50% CAGR; cities granting delivery privileges to lighter gross vehicle weights foster this outperformance. Europe's proposed 1-ton allowance for battery-electric rigids aims to preserve payload parity and is catalyzing OEM portfolio additions.
Operators report that the "Goldilocks" mid-weight class balances range, payload, and chassis cost. Daimler's eActros 300 achieved a 220-kilometer real-world range in Swiss pilots, covering a full double-shift with overnight charging. Battery prices nearing USD 110 per kilowatt-hour in 2026 are making mid-weight electrification financially attractive within three-year payback windows. Policy signals in California and Paris that prohibit diesels over 12 tons inside city limits after 2030 further anchor demand. As a result, the 10-15 ton segment is set to raise its share of the heavy-duty trucks market to roughly 30% by 2031.
Class 8 maintained a commanding 70.8% presence in 2025, driven by interstate haulage and heavy construction. With an 8.30% CAGR forecast, Class 7 gains from duty cycles of 150-200 miles that match current battery ranges without en-route charging. CARB requires 40% zero-emission sales for Class 7 tractors by 2032, accelerating OEM roadmaps.
Mack's MD Electric offers a 150-kilowatt-hour pack and 140-mile range, succeeding in beverage and food-service fleets where predictable routes enable scheduled charging. Class 8 electrification remains experimental but promising; megawatt chargers rolling out on U.S. I-5 and German Autobahns enable 45-minute turnarounds. The heavy-duty trucks market share for Class 8 is projected to slip below 68% by 2031 as medium-duty adoption accelerates.
Complete Report Scope:
- By Tonnage Type
- 10 to 15 T
- More Than 15 T
- By Class
- Class 7
- Class 8
- By Propulsion Type
- Diesel
- Battery-Electric
- Fuel-Cell Electric (FCEV)
- Alternative Fuels (CNG, LNG, Biodiesel)
- By Application
- Construction and Mining
- Freight and Logistics
- Municipal and Utilities
- Others
- By Truck Body Type
- Tractor-Trailer
- Rigid Dump
- Tanker
- Others
- By Sales Channel
- OEM/First Purchase
- Lease and Rental
- After-market Retrofit
- By Geography
- North America
- United States
- Canada
- Rest of North America
- South America
- Brazil
- Argentina
- Rest of South America
- Europe
- Germany
- United Kingdom
- France
- Italy
- Russia
- Rest of Europe
- Asia-Pacific
- China
- India
- Japan
- South Korea
- Australia and New Zealand
- Rest of Asia-Pacific
- Middle East and Africa
- Saudi Arabia
- United Arab Emirates
- Egypt
- Turkey
- South Africa
- Rest of Middle East and Africa
- North America
Geography Analysis
Asia-Pacific led with a 47.21% revenue share in 2025 and is projected to grow at a 9.30% CAGR to 2031, buoyed by China's manufacturing scale and regional hydrogen corridors. Sinotruk, FAW, and Dongfeng captured over 60% of regional volumes as the National VI standard and municipal incentives in Beijing and Shanghai accelerated urban electrification. India's Tata Motors launched the Prima EV in 2024, addressing metropolitan freight and select mining customers, while state subsidies in Delhi and Maharashtra target 8,000 zero-emission trucks by 2028. Japan's Fukushima Hydrogen Highway underpins fuel-cell pilots, and Australia's Fortescue Metals Group invests in hydrogen haulage to cut Scope 1 emissions.
North America held a 28% share, animated by the U.S. EPA Clean Trucks Plan and federal charging grants. California's Advanced Clean Trucks rule and incentives reaching USD 240,000 per vehicle sustain the nation's largest zero-emission fleet pipeline. Canada's up-to-CAD 200,000 rebates drive uptake along the Windsor-Quebec corridor, while Mexico's cross-border carriers electrify to maintain California access. Europe contributed 18% in 2025, with Euro VII standards and Germany's Autobahn megawatt chargers catalyzing adoption. The United Kingdom mandates 10% zero-emission truck sales by 2030, scaling to 100% by 2040. France and Italy support LNG as a bridge fuel, whereas Scandinavia pushes battery-electric solutions across all classes.
The Middle East and Africa collectively accounted for 7%, with Dubai and Riyadh piloting Chinese battery-electric rigs for urban deliveries. Extreme temperatures necessitate advanced thermal management, slowing broader adoption. Latin America's mining belts in Chile and Peru represent early hydrogen fuel-cell demand, but broader market growth is constrained by financing costs and infrastructure gaps.
- Daimler Truck Holding AG
- Traton SE
- Volvo Group
- PACCAR Inc.
- Dongfeng Motor Corporation
- Tata Motors Ltd.
- FAW Group Corp.
- CNHTC (Sinotruk)
- Ashok Leyland Ltd
- Isuzu Motors Ltd.
- Hino Motors Ltd.
- Navistar International
- Iveco Group N.V.
- Hyundai Motor Co.
- Nikola Corporation
- JAC Motors
- Kamaz PJSC
- Foton Motor Co. Ltd.
Additional Benefits:
- The market estimate (ME) sheet in Excel format
- 3 months of analyst support
TABLE OF CONTENTS
1 Introduction
- 1.1 Study Assumptions and Market Definition
- 1.2 Scope of the Study
2 Research Methodology
3 Executive Summary
4 Market Landscape
- 4.1 Market Overview
- 4.2 Market Drivers
- 4.2.1 Expanding E-Commerce Freight Volumes
- 4.2.2 Strict Global Emission Mandates Driving Fleet Renewal
- 4.2.3 Infrastructure Stimulus Packages
- 4.2.4 Hydrogen Corridor Pilot Programs in Asia Pacific
- 4.2.5 OTA-Enabled TCO Optimization for Fleet Managers
- 4.2.6 Mining Sector Electrification Commitments in South America
- 4.3 Market Restraints
- 4.3.1 High Upfront Cost of Zero-Emission Heavy Trucks
- 4.3.2 Volatile Diesel Price Environment Impacting Purchase Cycles
- 4.3.3 Semiconductor Shortages Delaying ADAS/EV Production
- 4.3.4 Stricter EU Axle-Weight Rules Limiting Payload Economics
- 4.4 Value/Supply-Chain Analysis
- 4.5 Regulatory Landscape
- 4.6 Technological Outlook
- 4.7 Porter's Five Forces Analysis
- 4.7.1 Bargaining Power of Suppliers
- 4.7.2 Bargaining Power of Consumers
- 4.7.3 Threat of New Entrants
- 4.7.4 Threat of Substitute Products
- 4.7.5 Intensity of Competitive Rivalry
5 Market Size and Growth Forecasts (Value (USD) and Volume (Units))
- 5.1 By Tonnage Type
- 5.1.1 10 to 15 T
- 5.1.2 More Than 15 T
- 5.2 By Class
- 5.2.1 Class 7
- 5.2.2 Class 8
- 5.3 By Propulsion Type
- 5.3.1 Diesel
- 5.3.2 Battery-Electric
- 5.3.3 Fuel-Cell Electric (FCEV)
- 5.3.4 Alternative Fuels (CNG, LNG, Biodiesel)
- 5.4 By Application
- 5.4.1 Construction and Mining
- 5.4.2 Freight and Logistics
- 5.4.3 Municipal and Utilities
- 5.4.4 Others
- 5.5 By Truck Body Type
- 5.5.1 Tractor-Trailer
- 5.5.2 Rigid Dump
- 5.5.3 Tanker
- 5.5.4 Others
- 5.6 By Sales Channel
- 5.6.1 OEM/First Purchase
- 5.6.2 Lease and Rental
- 5.6.3 After-market Retrofit
- 5.7 By Geography
- 5.7.1 North America
- 5.7.1.1 United States
- 5.7.1.2 Canada
- 5.7.1.3 Rest of North America
- 5.7.2 South America
- 5.7.2.1 Brazil
- 5.7.2.2 Argentina
- 5.7.2.3 Rest of South America
- 5.7.3 Europe
- 5.7.3.1 Germany
- 5.7.3.2 United Kingdom
- 5.7.3.3 France
- 5.7.3.4 Italy
- 5.7.3.5 Russia
- 5.7.3.6 Rest of Europe
- 5.7.4 Asia-Pacific
- 5.7.4.1 China
- 5.7.4.2 India
- 5.7.4.3 Japan
- 5.7.4.4 South Korea
- 5.7.4.5 Australia and New Zealand
- 5.7.4.6 Rest of Asia-Pacific
- 5.7.5 Middle East and Africa
- 5.7.5.1 Saudi Arabia
- 5.7.5.2 United Arab Emirates
- 5.7.5.3 Egypt
- 5.7.5.4 Turkey
- 5.7.5.5 South Africa
- 5.7.5.6 Rest of Middle East and Africa
- 5.7.1 North America
6 Competitive Landscape
- 6.1 Market Concentration
- 6.2 Strategic Moves
- 6.3 Market Share Analysis
- 6.4 Company Profiles (Includes Global level Overview, Market level overview, Core Segments, Financials as available, Strategic Information, Market Rank/Share for key companies, Products and Services, and Recent Developments)
- 6.4.1 Daimler Truck Holding AG
- 6.4.2 Traton SE
- 6.4.3 Volvo Group
- 6.4.4 PACCAR Inc.
- 6.4.5 Dongfeng Motor Corporation
- 6.4.6 Tata Motors Ltd.
- 6.4.7 FAW Group Corp.
- 6.4.8 CNHTC (Sinotruk)
- 6.4.9 Ashok Leyland Ltd
- 6.4.10 Isuzu Motors Ltd.
- 6.4.11 Hino Motors Ltd.
- 6.4.12 Navistar International
- 6.4.13 Iveco Group N.V.
- 6.4.14 Hyundai Motor Co.
- 6.4.15 Nikola Corporation
- 6.4.16 JAC Motors
- 6.4.17 Kamaz PJSC
- 6.4.18 Foton Motor Co. Ltd.
7 Market Opportunities and Future Outlook
- 7.1 White-space and Unmet-Need Assessment

 美國重型卡車:市場佔有率分析、行業趨勢和統計數據以及成長預測(2026-2031 年)
 重型卡車市場預測至 2034 年:按車輛類型、等級、燃料類型、動力系統、應用、最終用戶和地區進行全球分析。
 大型車輛市場:2026-2032年全球市場預測(依車輛類型、動力傳動系統、重量等級、應用及銷售管道)
 全球中型卡車轉向系統市場分析及預測(至2035年):按類型、產品、技術、組件、應用、材料類型、最終用戶、功能和安裝類型分類
 2026年全球重型工業機械市場報告
 重型卡車市場機會、成長要素、產業趨勢分析及2026-2035年預測。2026年中型卡車轉向系統全球市場報告2026年全球重型卡車市場報告2026年全球重型卡車轉向系統市場報告
 全球重型卡車市場規模、佔有率、趨勢和成長分析報告(2026-2034)