


 |
市場調查報告書
商品編碼
2117366
美國重型卡車:市場佔有率分析、行業趨勢和統計數據以及成長預測(2026-2031 年)United States Heavy-Duty Truck - Market Share Analysis, Industry Trends & Statistics, Growth Forecasts (2026 - 2031) |
||||||

※ 本網頁內容可能與最新版本有所差異。詳細情況請與我們聯繫。
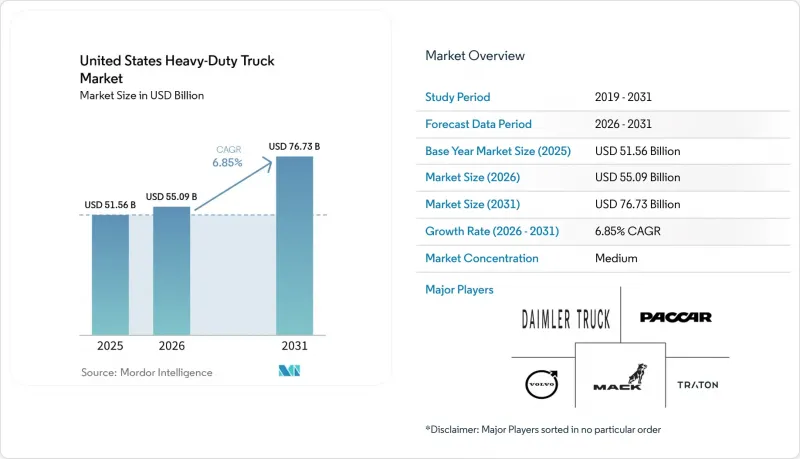
據 Mordor Intelligence 稱,2025 年美國重型卡車市值為 515.6 億美元,預計到 2031 年將達到 767.3 億美元,而 2026 年為 550.9 億美元,預測期內(2026-2031 年)的複合年成長率預計為 6.85%。
本報告按車輛總重(7級、8a級、其他)、動力系統(內燃機和電力驅動)、軸型(4x2、6x2、6x4、其他)、卡車類型(剛性卡車、鉸接式卡車、其他)以及應用領域(建築與採礦、貨運與物流、其他)進行分類。市場預測以貨幣價值(美元)和銷售(輛)兩種形式呈現。
美國重型卡車市場趨勢與洞察
基礎建設投資和經濟獎勵策略
美國國會已撥款巨資用於道路、橋樑和零排放卡車的基礎建設。這筆資金加速了限重橋樑的現代化改造,並使維修的高速公路能夠通行更大尺寸的車輛。洛杉磯、薩凡納和休士頓的港務局將這些資金與當地債券結合,從而催生了對純電動短程運輸牽引車的早期叢集。更新後的橋樑設計標準允許更輕的雙軸承載更大的負載容量。這項變更促使卡車運輸公司縮小軸規格以節省燃油成本。各州交通部門正在加快道路鋪設項目,以確保按時完成基礎設施建設資金的使用,這導致混凝土攪拌車和自動卸貨卡車的訂單激增。然而,「購買美國貨」的政策延長了在美國組裝的駕駛室和動力傳動系統的前置作業時間,造成部分交貨延誤。
電子商務推動貨運量成長
隨著零售商努力將庫存部署在更靠近客戶的位置,以履行兩天內送達的承諾,小包裹和小件貨物的運輸量增加。擁有大規模的亞馬遜正在將其部分長途柴油運輸業務轉移到純電動8級卡車上。此舉給競爭對手帶來了壓力,促使他們嘗試採用類似的零排放技術。 UPS和聯邦快遞都在使用遠端資訊處理技術來減少空運里程,從而延長現有卡車的使用壽命,並緩解近期更換的需求。同時,港口運輸量也顯著成長,這主要歸功於加州先進清潔車隊(Advanced Clean Fleets)的強制規定,該規定旨在加速零排放車輛的大規模應用。儘管擁塞有所緩解,但由於這項強制性規定,純電動和氫燃料卡車的訂單仍在增加。展望未來,電子商務預計將大幅增加卡車駕駛人的就業。這種預期的人手不足促使人們對自動駕駛和平台化技術產生了更大的興趣,以維持服務水準。
車輛供應過剩和庫存水準過高
貨運市場持續低迷已超過兩年,導致許多小規模承運商的現貨運費低於營運成本。二手卡車供應量的增加拉低了殘值,削弱了可用於置換的資產價值,並推遲了購買新車的決策。這種供需失衡在乾貨車和冷藏車運輸路線上尤其明顯,近期電子商務的波動導致訂單過剩。為此,汽車製造商正在調整生產速度,並針對大型合約承運商推出有針對性的獎勵計畫。雖然運能正在逐步最佳化,但在運費恢復到盈虧平衡點之前,預計在可預見的未來,購買新車的意願仍將保持低迷。
細分市場分析
總重33,001至54,000磅的8a級牽引車,預計到2025年將佔註冊總量的47.17%,並憑藉其均衡的載重能力和符合州際橋樑荷載標準,成為美國重型卡車市場佔有率的基礎。總重超過80,000磅的卡車正以9.45%的複合年成長率成長,因為內華達州、北卡羅來納州和猶他州的鋰和稀土元素礦項目需要8x6和8x8驅動系統,以便在未鋪設路面的運輸道路上運輸電池級精礦。 8b級車輛(54,001至80,000磅)仍用於長途貨運,但其市場佔有率正被更輕、在平坦道路上油耗更低的6x2串聯式車輛所取代。 IIJA 的橋樑維修資金將使某些路線的軸荷在 2028 年前得以增加,從而使承運商能夠在不犧牲法定負載容量的情況下採用更輕的車架作為規範。
超重型卡車的成長仍然受到分散的超尺寸和超重許可證的限制,這迫使卡車在州界進行成本高昂的轉運,並推高了物流成本15%至20%。奧什科甚和馬克卡車透過推出能夠承載12萬磅總重的加固底盤,正從傳統特種卡車品牌手中奪取市場佔有率。 7級卡車(26,001-33,000磅)的電池電動化普及速度最快,因為它們非常適合在可預測的市政路線上運營,在車庫進行夜間充電即可消除續航里程的擔憂。因此,市場趨勢呈現兩極化。雖然8a級卡車的數量構成了美國重型卡車市場規模的基準,但隨著關鍵礦產週期的成熟,超重型卡車將推動收入成長。
預計到2025年,柴油引擎將佔銷售量的91.12%,其優勢在於加註燃料速度快、服務網覆蓋全國以及高能量密度。同時,受特斯拉Semi量產和加州先進清潔車隊法規(ACF)實施的推動,純電動車(BELEV)預計將以7.87%的年成長率成長。目前,純電動牽引車僅占美國重型卡車市場的一小部分,主要用於短程運輸和本地配送,這些用途的日行駛里程相對有限。氫燃料電池卡車的市場佔有率雖然不大,但由於美國能源局(DOE)的樞紐津貼以及現代XCIENT車型在北加州的推出,其地位正在迅速提升。康明斯X15N天然氣燃氣引擎為垃圾收集者和本地運輸商提供了一種無需柴油即可符合法規要求的選擇,尤其適用於那些擁有現有CNG加氣站的企業。
由於領先購買量激增,預計柴油車組裝在可預見的未來仍將保持繁忙。然而,考慮到預期成本較高,那些較晚採用柴油車的業者可能會將重心轉向替代燃料,尤其是在保障數據的可靠性得到驗證之後。在電池重量會降低負載容量或電網無法滿足充電需求的線路上,氫燃料變得越來越有吸引力。目前市佔率較小的混合動力和插電式混合動力系統面臨挑戰。系統複雜性的增加會降低負載容量,而燃油成本的節省卻無法與之相符。展望未來,柴油車的市佔率預計將逐步下降,而非急劇下降。這是因為總擁有成本 (TCO) 的計算會根據運作週期而有所不同,這使得車主能夠在長期內維持多種動力系統的多樣化組合。
其他好處:
- Excel格式的市場預測(ME)表
- 3個月的分析師支持
目錄
第1章:引言
- 研究假設和市場定義
- 調查範圍
第2章:調查方法
第3章執行摘要
第4章 市場狀況
- 市場概覽
- 市場促進因素
- 基礎建設投資和經濟獎勵策略
- 電子商務導致貨運量增加
- 領先購買,趕在2027年EPA標準實施前
- 重要礦產資源的繁榮帶動了重型貨物運輸需求的成長。
- 為氫能中心提供資金正在加速燃料電池電動車(FCEV)的早期應用。
- 港口對相容自動駕駛的短途運輸服務的需求
- 市場限制因素
- 船隊供應過剩和庫存水準過高
- 利率上升增加了資金籌措成本。
- 兆瓦級充電過程中連接電網出現延遲
- 總重量超過 80,000 磅的車輛的州際通行許可證明細
- 價值供應鏈分析
- 監理情勢
- 技術展望
- 波特五力分析
第5章 市場規模與成長預測
- 依車輛總重額定值 (GVWR)
- 7級(26,001英鎊至33,000英鎊)
- 8a級(33,001英鎊至54,000英鎊)
- 8b 類(54,001 英鎊 – 80,000 英鎊)
- 其他(超過 80,000 磅)
- 透過推進力
- 內燃機(ICE)
- 柴油引擎
- 天然氣(CNG/LNG)
- 電的
- 電池式電動車(BEV)
- 混合動力汽車和插電式混合動力汽車(HEV 和 PHEV)
- 燃料電池汽車(FCEV)
- 內燃機(ICE)
- 按軸型
- 4x'2
- 6x2
- 6x4
- 6x6
- 8x6
- 8x8
- 其他
- 按卡車類型
- 死板的
- 關節
- 其他
- 透過使用
- 建築和採礦
- 貨運/物流
- 長途
- 其他
第6章 競爭情勢
- 市場集中度
- 策略趨勢
- 市佔率分析
- 公司簡介
- Daimler Truck
- PACCAR Inc.
- Volvo Group
- Mack Trucks
- Traton Group
- Hino Motors
- Oshkosh Corporation
- Autocar
- Nikola Corporation
- Tesla Inc.
- Lion Electric
- BYD Motors
- Cummins Inc.
- Hyundai Motor(XCIENT)
- Isuzu Commercial Truck
- Volvo Autonomous Solutions
- Einride
第7章 市場機會與未來展望
According to Mordor Intelligence, the United States heavy-duty truck market size was valued at USD 51.56 billion in 2025 and is estimated to grow from USD 55.09 billion in 2026 to reach USD 76.73 billion by 2031, at a CAGR of 6.85% during the forecast period (2026-2031).
This report is Segmented by Gross Vehicle Weight Rating (Class 7, Class 8a, and More), Propulsion (Internal-Combustion Engine (ICE) and Electric), Axle Type (4x'2, 6x2, 6x4, and More), Truck Type (Rigid, Articulated, and Others), and Application (Construction and Mining, Freight and Logistics, and More). The Market Forecasts are Provided in Terms of Value (USD) and Volume (Units).
United States Heavy-Duty Truck Market Trends and Insights
Infrastructure Investment and IIJA Stimulus
Congress allocated significant funding for roads and bridges, as well as for zero-emission truck infrastructure. This funding is accelerating the replacement of weight-restricted spans and enabling higher-capacity configurations on rehabilitated corridors. Port authorities in Los Angeles, Savannah, and Houston matched these funds with local bonds, creating early demand clusters for battery-electric drayage tractors. Updated bridge-formula guidance now allows lighter tandems to carry increased payloads. This change is prompting fleets to downspec axles to save on fuel. State DOTs are accelerating pavement programs to obligate infrastructure dollars before deadlines, leading to a surge in concrete-mixer and dump-truck orders. However, Buy America rules have lengthened lead times for U.S.-assembled cabs and drivelines, causing some deliveries to shift to later timeframes.
E-Commerce-Driven Freight Tonnage Growth
Parcel and less-than-truckload tonnage grew, driven by retailers' efforts to position inventory closer to customers to uphold two-day delivery commitments. Amazon, with a large fleet of tractors, is transitioning a portion of its diesel linehaul to battery-electric Class 8 units. This move is pressuring competing carriers to experiment with similar zero-emission technologies. Both UPS and FedEx are leveraging telematics to minimize empty miles, thereby prolonging the lifespan of their current trucks and moderating the immediate need for replacements. Meanwhile, port drayage is experiencing a distinct surge. This is largely due to the California Advanced Clean Fleets mandate, which aims to accelerate significant adoption of zero-emission vehicles. This regulation is driving up orders for battery-electric and hydrogen trucks, even as congestion levels ease. Looking ahead, e-commerce is expected to create a substantial number of additional truck-driver roles. This anticipated shortfall is spurring heightened interest in autonomous and platooning technologies to maintain service standards.
Fleet Over-Capacity and High Inventory Levels
Lingering freight recession conditions have stretched to more than two years, pushing spot-rate indices below operating cost for many small carriers. Elevated used-truck volumes weigh on residual values, weakening equity available for trade-ins and delaying new-truck purchase decisions. The imbalance is particularly sharp in dry-van and refrigerated lanes where e-commerce volatility led to over-ordering in recent times. OEMs have responded by flexing build-rates and offering selective incentive programs targeted at large contract carriers. Although capacity discipline is gradually improving, near-term appetite for incremental equipment remains restrained until freight indices recover to profitable thresholds.
Other drivers and restraints analyzed in the detailed report include:
- Pre-Buying Ahead of EPA 2027 Standards
- Critical-Minerals Boom Increasing Heavy-Haul Demand
- Elevated Interest Rates Raising Financing Costs
For complete list of drivers and restraints, kindly check the Table Of Contents.
Segment Analysis
Class 8a tractors spanning 33,001-54,000 lb gross vehicle weight captured 47.17% of 2025 registrations, anchoring the United States heavy-duty truck market share because they balance payload capacity with interstate bridge-formula compliance. Trucks exceeding 80,000 lb are expanding at a 9.45% CAGR as lithium and rare-earth mining projects in Nevada, North Carolina, and Utah demand 8X6 and 8X8 drivetrains to haul battery-grade concentrate on unpaved haul roads. Class 8b units (54,001-80,000 lb) still serve long-haul freight but are ceding momentum to lighter 6X2 tandems that lower fuel burn on flat corridors. IIJA bridge-rehabilitation funds will permit higher axle weights on select corridors by 2028, letting fleets spec lighter frames without sacrificing legal payload.
Super-heavy growth remains hemmed in by fragmented oversize-overweight permits that force costly transloading at state borders and add 15-20% to logistics expense. Oshkosh and Mack have launched a reinforced chassis that withstands 120,000-lb gross weights, carving share from legacy vocational brands. Class 7 trucks (26,001-33,000 lb) benefit from predictable municipal routes, so battery-electric adoption is fastest in this class, where overnight depot charging eliminates range anxiety. The upshot is a bifurcated trajectory: while Class 8a volumes secure baseline scale for the United States heavy-duty truck market size, super-heavy rigs will set the pace for incremental revenue as the critical minerals cycle matures.
Diesel engines retained 91.12% of 2025 volume, underscoring their refueling speed, nationwide service network, and high energy density, while battery-electric units climbed 7.87% per year as the Tesla Semi began series production, coinciding with the activation of California's Advanced Clean Fleets rule. Battery-electric tractors now represent a small portion of the U.S. heavy-duty truck market, primarily in drayage and regional distribution, where daily mileage is typically limited. While hydrogen fuel-cell trucks hold a minimal market share, they've gained traction following DOE hub grants and Hyundai's deployment of XCIENT units in Northern California. Cummins' X15N natural-gas engine provides a diesel-free route to compliance for refuse and regional-haul carriers, especially those with existing CNG stations.
Due to the pre-buy wave, diesel assembly lines will remain busy for the near term. However, with cost premiums expected, late adopters are likely to pivot towards alternative fuels, especially once warranty data proves reliable. Hydrogen becomes increasingly appealing on routes where battery weight reduces payload, and grid connections can't keep up with charger demand. Hybrid and plug-in hybrid systems, currently holding a niche market share, face challenges: their added complexity diminishes payload without delivering equivalent fuel savings. Looking ahead, while diesel's market share will gradually decline, it's unlikely to plummet. This is due to varying total-cost-of-ownership calculations based on duty cycles, allowing fleets to maintain a diverse propulsion portfolio well into the future.
Complete Report Scope:
- By Gross Vehicle Weight Rating (GVWR)
- Class 7 (26,001 to 33,000 lb)
- Class 8a (33,001 to 54,000 lb)
- Class 8b (54,001 to 80,000 lb)
- Others (Over 80,000 lb)
- By Propulsion
- Internal-Combustion Engine (ICE)
- Diesel
- Natural Gas (CNG/LNG)
- Electric
- Battery-Electric (BEV)
- Hybrid and Plug-in Hybrid (HEV and PHEV)
- Fuel-Cell Electric (FCEV)
- Internal-Combustion Engine (ICE)
- By Axle Type
- 4x'2
- 6x2
- 6x4
- 6x6
- 8x6
- 8x8
- Others
- By Truck Type
- Rigid
- Articulated
- Others
- By Application
- Construction and Mining
- Freight and Logistics
- Long Haul
- Other
List of Companies Covered in this Report:
- Daimler Truck
- PACCAR Inc.
- Volvo Group
- Mack Trucks
- Traton Group
- Hino Motors
- Oshkosh Corporation
- Autocar
- Nikola Corporation
- Tesla Inc.
- Lion Electric
- BYD Motors
- Cummins Inc.
- Hyundai Motor (XCIENT)
- Isuzu Commercial Truck
- Volvo Autonomous Solutions
- Einride
Additional Benefits:
- The market estimate (ME) sheet in Excel format
- 3 months of analyst support
TABLE OF CONTENTS
1 Introduction
- 1.1 Study Assumptions and Market Definition
- 1.2 Scope of the Study
2 Research Methodology
3 Executive Summary
4 Market Landscape
- 4.1 Market Overview
- 4.2 Market Drivers
- 4.2.1 Infrastructure Investment and IIJA Stimulus
- 4.2.2 E-Commerce-Driven Freight Tonnage Growth
- 4.2.3 Pre-Buying Ahead of EPA 2027 Standards
- 4.2.4 Critical-Minerals Boom Increasing Heavy-Haul Demand
- 4.2.5 Hydrogen-Hub Funding Accelerating Early FCEV Uptake
- 4.2.6 Autonomous-Ready Drayage Demand at Ports
- 4.3 Market Restraints
- 4.3.1 Fleet Over-Capacity and High Inventory Levels
- 4.3.2 Elevated Interest Rates Raising Financing Costs
- 4.3.3 Utility-Grid Interconnection Delays for Megawatt Charging
- 4.3.4 Interstate Permit Fragmentation Above 80 K Lb GVW
- 4.4 Value / Supply-Chain Analysis
- 4.5 Regulatory Landscape
- 4.6 Technological Outlook
- 4.7 Porter's Five Forces Analysis
- 4.7.1 Bargaining Power of Suppliers
- 4.7.2 Bargaining Power of Buyers
- 4.7.3 Threat of New Entrants
- 4.7.4 Threat of Substitutes
- 4.7.5 Intensity of Competitive Rivalry
5 Market Size and Growth Forecasts (Value, Volume)
- 5.1 By Gross Vehicle Weight Rating (GVWR)
- 5.1.1 Class 7 (26,001 to 33,000 lb)
- 5.1.2 Class 8a (33,001 to 54,000 lb)
- 5.1.3 Class 8b (54,001 to 80,000 lb)
- 5.1.4 Others (Over 80,000 lb)
- 5.2 By Propulsion
- 5.2.1 Internal-Combustion Engine (ICE)
- 5.2.1.1 Diesel
- 5.2.1.2 Natural Gas (CNG/LNG)
- 5.2.2 Electric
- 5.2.2.1 Battery-Electric (BEV)
- 5.2.2.2 Hybrid and Plug-in Hybrid (HEV and PHEV)
- 5.2.2.3 Fuel-Cell Electric (FCEV)
- 5.2.1 Internal-Combustion Engine (ICE)
- 5.3 By Axle Type
- 5.3.1 4x'2
- 5.3.2 6x2
- 5.3.3 6x4
- 5.3.4 6x6
- 5.3.5 8x6
- 5.3.6 8x8
- 5.3.7 Others
- 5.4 By Truck Type
- 5.4.1 Rigid
- 5.4.2 Articulated
- 5.4.3 Others
- 5.5 By Application
- 5.5.1 Construction and Mining
- 5.5.2 Freight and Logistics
- 5.5.3 Long Haul
- 5.5.4 Other
6 Competitive Landscape
- 6.1 Market Concentration
- 6.2 Strategic Moves
- 6.3 Market Share Analysis
- 6.4 Company Profiles (Includes Global Level Overview, Market Level Overview, Core Segments, Financials as Available, Strategic Information, Market Rank/Share for Key Companies, Products and Services, SWOT Analysis, and Recent Developments)
- 6.4.1 Daimler Truck
- 6.4.2 PACCAR Inc.
- 6.4.3 Volvo Group
- 6.4.4 Mack Trucks
- 6.4.5 Traton Group
- 6.4.6 Hino Motors
- 6.4.7 Oshkosh Corporation
- 6.4.8 Autocar
- 6.4.9 Nikola Corporation
- 6.4.10 Tesla Inc.
- 6.4.11 Lion Electric
- 6.4.12 BYD Motors
- 6.4.13 Cummins Inc.
- 6.4.14 Hyundai Motor (XCIENT)
- 6.4.15 Isuzu Commercial Truck
- 6.4.16 Volvo Autonomous Solutions
- 6.4.17 Einride
7 Market Opportunities and Future Outlook
- 7.1 White-space and Unmet-Need Assessment

 重型卡車:市場佔有率分析、行業趨勢和統計數據、成長預測(2026-2031 年)
 重型卡車市場預測至 2034 年:按車輛類型、等級、燃料類型、動力系統、應用、最終用戶和地區進行全球分析。
 大型車輛市場:2026-2032年全球市場預測(依車輛類型、動力傳動系統、重量等級、應用及銷售管道)
 全球中型卡車轉向系統市場分析及預測(至2035年):按類型、產品、技術、組件、應用、材料類型、最終用戶、功能和安裝類型分類
 2026年全球重型工業機械市場報告
 重型卡車市場機會、成長要素、產業趨勢分析及2026-2035年預測。2026年中型卡車轉向系統全球市場報告2026年全球重型卡車市場報告2026年全球重型卡車轉向系統市場報告
 全球重型卡車市場規模、佔有率、趨勢和成長分析報告(2026-2034)