


 |
市場調查報告書
商品編碼
2123095
面板級封裝:市場佔有率分析、產業趨勢與統計、成長預測(2026-2031 年)Panel Level Packaging - Market Share Analysis, Industry Trends & Statistics, Growth Forecasts (2026 - 2031) |
||||||

※ 本網頁內容可能與最新版本有所差異。詳細情況請與我們聯繫。
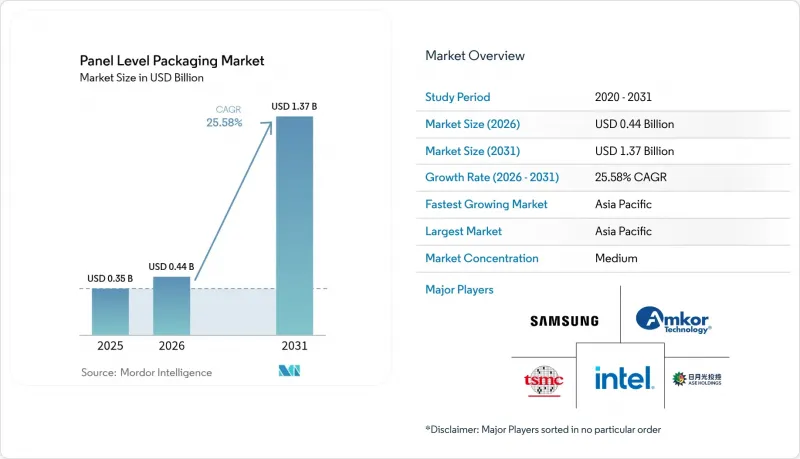
根據 Mordor Intelligence 預測,面板級包裝市場規模將從 2025 年的 3.5 億美元成長到 2026 年的 4.4 億美元,到 2031 年將達到 13.7 億美元,2026 年至 2031 年的複合年成長率為 25.58%。
本報告依封裝技術(扇出型面板級封裝、嵌入式橋接等)、基板材料(有機層壓板、玻璃芯等)、面板尺寸(300mm x 300mm以下、301-510mm x 510mm、511mm x 600mm以上)、工業應用(消費、汽車等歐洲)細分地區(消費、汽車等歐洲)進行細分、汽車、汽車等歐洲。市場預測以美元計價。
全球面板級包裝市場趨勢及洞察
成本降低與晶圓層次電子構裝的比較
向面板封裝形式的轉變可將多晶片設計中的基板利用率提高高達 40%,即使考慮到昂貴的模具成本,也能降低單晶片成本。日月光 (ASE) 投資 2 億美元建設 310mm x 310mm 生產線,顯示其致力於擴大生產規模,大規模生產的消費電子產品可提供所需的晶圓開片量,從而在較短的生命週期內攤銷模具成本。亞洲契約製造製造商將基板製造、線路重布處理和最終測試整合到同一園區內,獲得了更多優勢並降低了物流成本。產量較低的西方製造商則面臨更陡峭的成本曲線,與競爭對手的差距進一步擴大。因此,面板優先策略正日益成為承包封裝競標中訂單的關鍵因素。
人工智慧/高效能運算晶片需求激增
大規模語言模型推理和訓練環境對GPU叢集的密度要求比以往任何時候都高,這就需要更大尺寸、無中介層的封裝,同時也要確保頻寬。台積電的晶片封裝(CoPoS)藍圖計畫於2027年開始試生產,由於CoWoS光罩的限制,晶片尺寸將翻倍,但同時也要維持恆定的熱阻。台積電計畫在2026年每年將其CoWoS產能提高60%以上,但預計其高頻寬記憶體(HBM)生產線仍將面臨訂單積壓,這將迫使一級客戶考慮在面板級封裝市場尋找下一代加速卡的替代方案。率先在面板級封裝中實現超過20kW的貨架級散熱的先驅企業最有希望獲得多年供貨合約。
高資本密集度和扭曲問題
一條600毫米生產線運作運轉需要超過5億美元的沉積、圖形化和測量設備投資。面板基板在熱負荷下會膨脹,如果沒有補償,其撓曲幅度可能超過2毫米。 SK Key Foundry和LB Semicon的Direct-RDL製程透過在固化過程中固定面板邊緣來抑制撓曲,但這種改進使設備成本增加了15%。小規模的OSAT(外包組裝服務提供者)難以資金籌措這些升級費用,阻礙了全球供應的擴張。在低模量介電材料和主動式翹曲校正卡盤實現實用化之前,較低的良率仍將是短期內阻礙面板級封裝市場滲透的因素。
細分市場分析
扇出型面板級封裝預計在2025年將佔銷售額的44.60%,是消費性電子和行動裝置的關鍵元件,因為這些裝置對I/O密度的要求適中。此細分市場的面板級封裝規模預計將達到1.6億美元,並在2031年之前以19.80%的年均成長率成長。領先的OSAT(外包半導體工廠)正在利用成熟的晶片面朝下製程將良率提高到97%以上,每月晶圓產量超過2萬片,其成本比晶圓扇出封裝方法低兩位數百分比。然而,頻寬密集型加速器正在突破這種方法的焊盤間距極限,迫使創新者轉向2.5D/3D面板解決方案。
2.5D/3D面板整合是成長最快的細分市場,複合年成長率高達29.20%,但到2025年僅佔總營收的19.10%。異質堆疊技術透過將運算、儲存和類比晶片放置在被動玻璃載體上,可將互連長度縮短高達70%。早期商業化應用主要集中在人工智慧推理卡上,單一封裝中包含16個或更多晶片。隨著該技術走出資料中心的小眾市場,並滲透到汽車網域控制器領域,預計到2031年,採用2.5D/3D方法的面板級封裝市場佔有率將達到31.80%。
有機層壓板受益於低成本樹脂體系和成熟的供應鏈,預計2025年將維持56.10%的市場佔有率,市場規模達到2億美元。然而,該細分市場的複合年成長率(CAGR)將維持在20.40%,落後於整體面板級封裝市場,這反映出層數方面的物理限制以及熱膨脹係數(CTE)的不匹配。相較之下,去年市佔率僅12.30%的玻璃芯材,預計到2031年將以28.90%的複合年成長率成長。三星的H-玻璃藍圖旨在2026年實現量產,透過實現0.3 ppm/ 度C的尺寸漂移(僅為有機材料的十分之一),釋放線寬小於5µm的線路重布的潛力。矽和模塑重建面板仍然是小眾市場,主要面向高功率或超低成本應用。
區域分析
預計到2025年,亞太地區將佔全球銷售額的69.20%,並將繼續以27.60%的複合年成長率(CAGR)推動面板級封裝市場的發展,直至2031年。中國正大力投資國家級獎勵,以支持其主導的人工智慧晶片計劃,並大力發展面板級封裝生產線。日本2024年的資本投資將達到70億美元,年增82%,以支持其國內工藝能力的提升。韓國正在推動玻璃芯基板的研發,而台灣的台積電則在推廣一體化代工封裝流程,將CoWoS、CoPoS和測試整合到一個晶圓廠叢集中。
北美地區也緊追在後,核心資金來自《晶片封裝和整合產品法案》(CHIPS Act)下撥出的16億美元先進封裝專款。安靠(Amkor)位於亞利桑那州、投資4億美元的工廠將於2026年運作,該工廠與台積電(TSMC)新建的Fab 21工廠位於同一廠址,將縮短美國客戶的生產週期。同樣,SK海力士(SK Hynix)也已在印第安納州投資4.5億美元用於HBM封裝,這表明各州都在積極吸引高附加價值後端企業。
儘管歐洲的市佔率仍只有個位數,但隨著本土OSAT(契約製造)公司的建立,以及人們對國內生產的擔憂日益加劇,歐洲的市佔率正在上升。富士康和泰雷茲決定投資2.5億歐元,為航太和國防領域新建一座扇出型半導體製造廠。同時,英飛凌正與安靠合作,擴大在葡萄牙的面板產能,計畫於2025年中期運作。中東、非洲和南美洲目前仍主要由消費主導,組裝基地有限,但由於沙烏地阿拉伯和巴西的優惠政策,這種格局可能會在本十年後半期發生轉變。
其他好處:
- Excel格式的市場預測(ME)表
- 3個月的分析師支持
目錄
第1章:引言
- 研究假設和市場定義
- 調查範圍
第2章:調查方法
第3章執行摘要
第4章 市場狀況
- 市場概覽
- 市場促進因素
- 成本降低與晶圓層次電子構裝的比較
- 人工智慧/高效能運算晶片需求激增
- 5G/6G和邊緣設備的普及
- 尼康600 x 600毫米數位微影術簡介。
- 2026年起過渡到玻璃芯基板
- 歐盟和美國的回流補貼與先進包裝技術有關
- 市場限制因素
- 高資本密集度和扭曲相關的問題
- 製程整合複雜度超過 300 毫米
- 大型面板中亞微米級光刻製程的良率急劇下降。
- ABF-GCP介電薄膜供應瓶頸
- 產業價值鏈分析
- 監理情勢
- 技術展望
- 波特五力分析
第5章 市場規模與成長預測
- 生產力
- 扇出型面板級封裝(FOPLP)
- 嵌入式橋接器(eBridge)
- 2.5D/3D面板整合
- 扇入式面板級封裝
- 按基板
- 有機層壓板
- 玻璃芯
- 矽
- 模製和重新配置的面板
- 按面板尺寸
- 300 毫米 x 300 毫米或更小
- 301-510 毫米 x 510 毫米
- 511毫米 x 600毫米或更大
- 透過工業應用
- 消費性電子產品
- 汽車(ADAS、電動車電源)
- 通訊(5G/6G基礎設施)
- 航太/國防
- 工業和物聯網
- 按地區
- 北美洲
- 美國
- 加拿大
- 墨西哥
- 南美洲
- 巴西
- 阿根廷
- 其他南美國家
- 歐洲
- 德國
- 英國
- 法國
- 義大利
- 其他歐洲國家
- 亞太地區
- 中國
- 日本
- 韓國
- 印度
- 其他亞太國家
- 中東
- 沙烏地阿拉伯
- 阿拉伯聯合大公國
- 其他中東國家
- 非洲
- 南非
- 其他非洲國家
- 北美洲
第6章 競爭情勢
- 市場集中度
- 策略趨勢
- 市佔率分析
- 公司簡介
- Samsung Electronics Co., Ltd.
- Taiwan Semiconductor Manufacturing Company Limited(TSMC)
- Intel Corporation
- ASE Technology Holding Co., Ltd.
- Amkor Technology, Inc.
- Powertech Technology Inc.
- Nepes Corporation
- Unimicron Technology Corp.
- DECA Technologies, Inc.
- JCET Group Co., Ltd.
- Fraunhofer Institute for Reliability and Microintegration IZM
- Nikon Corporation
- Ajinomoto Fine-Techno Co., Inc.
- Shinko Electric Industries Co., Ltd.
- LG Innotek Co., Ltd.
- K&S(Kulicke & Soffa Industries, Inc.)
- Veeco Instruments Inc.
- Applied Materials, Inc.
- Ultratech(Veeco)
- Tokyo Electron Limited
- Brewer Science, Inc.
第7章 市場機會與未來展望
According to Mordor Intelligence, the panel-level packaging market size is expected to grow from USD 0.35 billion in 2025 to USD 0.44 billion in 2026 and is forecast to reach USD 1.37 billion by 2031 at 25.58% CAGR over 2026-2031.
This report is Segmented by Packaging Technology (Fan-Out Panel Level Packaging, Embedded Bridge, and More), Substrate Material (Organic Laminate, Glass Core, and More), Panel Size (<=300mmX300mm, 301-510mmX510mm, >=511mmX600mm), Industry Application (Consumer Electronics, Automotive, and More), and Geography (North America, Europe, and More). The Market Forecasts are Provided in Terms of Value (USD).
Global Panel Level Packaging Market Trends and Insights
Cost Reduction Versus Wafer-Level Packaging
Moving to panel formats yields up to 40% better substrate utilization for multi-die designs, cutting cost per placement even after accounting for expensive tooling. ASE's USD 200 million investment in 310 mm X 310 mm lines signals a commitment to volume scaling, and high-volume consumer devices supply the wafer starts needed to amortize tools across short life cycles. Asian contract manufacturers gain further leverage by clustering substrate fabrication, redistribution-layer processing, and final test inside single campuses, reducing logistics overhead. Western houses with lower volumes face a steeper cost curve, widening the competitiveness gap. As a result, panel-first strategies increasingly determine win rates in turnkey package bids.
Surge of AI/HPC Chip Demand
Large language-model inference and training floors require ever-denser GPU clusters, driving packaging toward larger interposer-free footprints that sustain bandwidth. TSMC's Chip-on-Panel-on-Substrate (CoPoS) roadmap, slated for 2027 risk production, doubles reticle-limited dimensions of CoWoS while holding thermal resistance steady. The foundry is expanding CoWoS capacity more than 60% annually through 2026, yet still projects backlog in high-bandwidth memory (HBM) lines, pushing Tier-1 customers to evaluate panel-level packaging market alternatives for next-generation accelerator cards. Early movers able to demonstrate >20 kW shelf-level cooling in panel packages are best positioned to secure multi-year supply agreements.
High Capital Intensity and Warpage Issues
A full 600 mm line demands more than USD 500 million in deposition, patterning, and metrology gear. Panel substrates expand under thermal load, generating a bow that can exceed 2 mm if not compensated. SK Key Foundry and LB Semicon's Direct-RDL flow clamps panel edges during cure to limit deflection, but equipment retrofits add 15% to tool cost. Smaller OSATs struggle to finance those upgrades, constraining global supply expansion. Until low-modulus dielectrics or active warp-compensation chucks mature, yield drag remains a check on near-term penetration of the panel-level packaging market.
Other drivers and restraints analyzed in the detailed report include:
- Proliferation of 5G/6G and Edge Devices
- Nikon 600 X 600 mm digital lithography adoption
- Process-Integration Complexity Beyond 300 mm
For complete list of drivers and restraints, kindly check the Table Of Contents.
Segment Analysis
Fan-Out Panel Level Packaging commanded 44.60% of 2025 revenue, making it the workhorse for consumer and mobile devices where moderate I/O density is sufficient. The panel-level packaging market size for this segment reached USD 0.16 billion and is projected to grow at 19.80% through 2031. Large OSATs leverage mature die-face-down flows to drive yields above 97%, beating wafer fan-out costs by double-digit margins on runs above 20,000 panels per month. Nevertheless, bandwidth-hungry accelerators are stretching the approach's pad pitch limits, pressing innovators toward 2.5D/3D panel solutions.
2.5D/3D panel integration, while holding only 19.10% of 2025 sales, is the fastest mover at a 29.20% CAGR. Heterogeneous stacking places compute, memory, and analog tiles on passive glass carriers, cutting interconnect length by up to 70%. Early commercial wins center on AI inference cards where a single package hosts >16 chiplets. The panel-level packaging market share for 2.5D/3D approaches is expected to hit 31.80% by 2031 as the technique escapes datacenter niches and filters into automotive domain controllers.
Organic laminate retained a 56.10% share in 2025, valued at USD 0.20 billion, benefiting from low-cost resin systems and entrenched supply chains. However, the segment's 20.40% CAGR lags the overall panel-level packaging market, reflecting physical limits on layer count and CTE mismatch. Glass cores, in contrast, posted only an 12.30% share last year but will grow at a 28.90% CAGR to 2031. Samsung's H-glass roadmap targets volume ramp in 2026, offering 0.3 ppm/°C dimensional drift, one-tenth that of organics, unlocking sub-5 µm line-width redistribution layers. Silicon and molded reconstituted panels remain niche, serving high-power or ultra-low-cost corners.
Complete Report Scope:
- By Packaging Technology
- Fan-Out Panel Level Packaging (FOPLP)
- Embedded Bridge (eBridge)
- 2.5D/3D Panel Integration
- Fan-In Panel Level Packaging
- By Substrate Material
- Organic Laminate
- Glass Core
- Silicon
- Molded Reconstituted Panel
- By Panel Size
- <=300 mm X 300 mm
- 301 - 510 mm X 510 mm
- >=511 mm X 600 mm
- By Industry Application
- Consumer Electronics
- Automotive (ADAS, EV Power)
- Telecommunications (5G/6G Infrastructure)
- Aerospace and Defense
- Industrial and IoT
- By Geography
- North America
- United States
- Canada
- Mexico
- South America
- Brazil
- Argentina
- Rest of South America
- Europe
- Germany
- United Kingdom
- France
- Italy
- Rest of Europe
- Asia-Pacific
- China
- Japan
- South Korea
- India
- Rest of Asia-Pacific
- Middle East
- Saudi Arabia
- United Arab Emirates
- Rest of Middle East
- Africa
- South Africa
- Rest of Africa
- North America
Geography Analysis
Asia-Pacific captured 69.20% of 2025 revenue and continues to lead the panel-level packaging market at a 27.60% CAGR through 2031. China funnels state incentives toward panel packaging lines aligned with sovereign AI chip programs, and Japan's equipment outlays rose 82% in 2024 to USD 7 billion, underpinning domestic process capability. South Korea advances glass-core substrates, while Taiwan's TSMC pushes integrated foundry-packaging flows that bundle CoWoS, CoPoS, and testing in a single fab cluster.
North America follows, anchored by CHIPS-Act funding of USD 1.6 billion earmarked for advanced packaging. Amkor's USD 400 million Arizona plant comes online in 2026, co-located with TSMC's new Fab 21 to shorten cycle times for U.S. customers. SK Hynix likewise has earmarked USD 450 million for HBM packaging in Indiana, demonstrating that states are bidding aggressively for high-value backend operations.
Europe's share remains single-digit but is rising as sovereignty concerns spur local OSAT formation. Foxconn and Thales committed EUR 250 million to a new fan-out facility aimed at aerospace and defense, while Infineon partnered with Amkor to add panel capacity in Portugal that comes online mid-2025. Middle East and Africa and South America remain consumption-centric, with limited assembly footprints yet, though incentive schemes in Saudi Arabia and Brazil could shift that balance later in the decade.
- Samsung Electronics Co., Ltd.
- Taiwan Semiconductor Manufacturing Company Limited (TSMC)
- Intel Corporation
- ASE Technology Holding Co., Ltd.
- Amkor Technology, Inc.
- Powertech Technology Inc.
- Nepes Corporation
- Unimicron Technology Corp.
- DECA Technologies, Inc.
- JCET Group Co., Ltd.
- Fraunhofer Institute for Reliability and Microintegration IZM
- Nikon Corporation
- Ajinomoto Fine-Techno Co., Inc.
- Shinko Electric Industries Co., Ltd.
- LG Innotek Co., Ltd.
- K&S (Kulicke & Soffa Industries, Inc.)
- Veeco Instruments Inc.
- Applied Materials, Inc.
- Ultratech (Veeco)
- Tokyo Electron Limited
- Brewer Science, Inc.
Additional Benefits:
- The market estimate (ME) sheet in Excel format
- 3 months of analyst support
TABLE OF CONTENTS
1 Introduction
- 1.1 Study Assumptions and Market Definition
- 1.2 Scope of the Study
2 Research Methodology
3 Executive Summary
4 Market Landscape
- 4.1 Market Overview
- 4.2 Market Drivers
- 4.2.1 Cost reduction versus wafer-level packaging
- 4.2.2 Surge of AI/HPC chip demand
- 4.2.3 Proliferation of 5G/6G and edge devices
- 4.2.4 Nikon 600 x 600 mm digital lithography adoption
- 4.2.5 Shift to glass-core substrates >=2026
- 4.2.6 EU/US reshoring subsidies tied to advanced packaging
- 4.3 Market Restraints
- 4.3.1 High capital intensity and warpage issues
- 4.3.2 Process-integration complexity beyond 300 mm
- 4.3.3 Sub-1 µm lithography yield cliff on large panels
- 4.3.4 Supply bottleneck for ABF-GCP dielectric films
- 4.4 Industry Value Chain Analysis
- 4.5 Regulatory Landscape
- 4.6 Technological Outlook
- 4.7 Porter's Five Forces Analysis
- 4.7.1 Bargaining Power of Suppliers
- 4.7.2 Bargaining Power of Buyers
- 4.7.3 Threat of New Entrants
- 4.7.4 Threat of Substitutes
- 4.7.5 Intensity of Rivalry
5 Market Size and Growth Forecasts (Value)
- 5.1 By Packaging Technology
- 5.1.1 Fan-Out Panel Level Packaging (FOPLP)
- 5.1.2 Embedded Bridge (eBridge)
- 5.1.3 2.5D/3D Panel Integration
- 5.1.4 Fan-In Panel Level Packaging
- 5.2 By Substrate Material
- 5.2.1 Organic Laminate
- 5.2.2 Glass Core
- 5.2.3 Silicon
- 5.2.4 Molded Reconstituted Panel
- 5.3 By Panel Size
- 5.3.1 <=300 mm X 300 mm
- 5.3.2 301 - 510 mm X 510 mm
- 5.3.3 >=511 mm X 600 mm
- 5.4 By Industry Application
- 5.4.1 Consumer Electronics
- 5.4.2 Automotive (ADAS, EV Power)
- 5.4.3 Telecommunications (5G/6G Infrastructure)
- 5.4.4 Aerospace and Defense
- 5.4.5 Industrial and IoT
- 5.5 By Geography
- 5.5.1 North America
- 5.5.1.1 United States
- 5.5.1.2 Canada
- 5.5.1.3 Mexico
- 5.5.2 South America
- 5.5.2.1 Brazil
- 5.5.2.2 Argentina
- 5.5.2.3 Rest of South America
- 5.5.3 Europe
- 5.5.3.1 Germany
- 5.5.3.2 United Kingdom
- 5.5.3.3 France
- 5.5.3.4 Italy
- 5.5.3.5 Rest of Europe
- 5.5.4 Asia-Pacific
- 5.5.4.1 China
- 5.5.4.2 Japan
- 5.5.4.3 South Korea
- 5.5.4.4 India
- 5.5.4.5 Rest of Asia-Pacific
- 5.5.5 Middle East
- 5.5.5.1 Saudi Arabia
- 5.5.5.2 United Arab Emirates
- 5.5.5.3 Rest of Middle East
- 5.5.6 Africa
- 5.5.6.1 South Africa
- 5.5.6.2 Rest of Africa
- 5.5.1 North America
6 Competitive Landscape
- 6.1 Market Concentration
- 6.2 Strategic Moves
- 6.3 Market Share Analysis
- 6.4 Company Profiles (includes Global level Overview, Market level overview, Core Segments, Financials as available, Strategic Information, Market Rank/Share for key companies, Products and Services, and Recent Developments)
- 6.4.1 Samsung Electronics Co., Ltd.
- 6.4.2 Taiwan Semiconductor Manufacturing Company Limited (TSMC)
- 6.4.3 Intel Corporation
- 6.4.4 ASE Technology Holding Co., Ltd.
- 6.4.5 Amkor Technology, Inc.
- 6.4.6 Powertech Technology Inc.
- 6.4.7 Nepes Corporation
- 6.4.8 Unimicron Technology Corp.
- 6.4.9 DECA Technologies, Inc.
- 6.4.10 JCET Group Co., Ltd.
- 6.4.11 Fraunhofer Institute for Reliability and Microintegration IZM
- 6.4.12 Nikon Corporation
- 6.4.13 Ajinomoto Fine-Techno Co., Inc.
- 6.4.14 Shinko Electric Industries Co., Ltd.
- 6.4.15 LG Innotek Co., Ltd.
- 6.4.16 K&S (Kulicke & Soffa Industries, Inc.)
- 6.4.17 Veeco Instruments Inc.
- 6.4.18 Applied Materials, Inc.
- 6.4.19 Ultratech (Veeco)
- 6.4.20 Tokyo Electron Limited
- 6.4.21 Brewer Science, Inc.
7 Market Opportunities and Future Outlook
- 7.1 White-space and Unmet-need Assessment


