


 |
市場調查報告書
商品編碼
2123085
IaaS(洞察即服務)應用:市場佔有率分析、行業趨勢和統計數據、成長預測(2026-2031 年)Insight As A Service Application - Market Share Analysis, Industry Trends & Statistics, Growth Forecasts (2026 - 2031) |
||||||

※ 本網頁內容可能與最新版本有所差異。詳細情況請與我們聯繫。
據 Mordor Intelligence 稱,IaaS(洞察即服務)應用市場預計到 2026 年價值 86.4 億美元,高於 2025 年的 72.3 億美元,預計到 2031 年將達到 211.2 億美元。
預計 2026 年至 2031 年的複合年成長率為 19.56%。
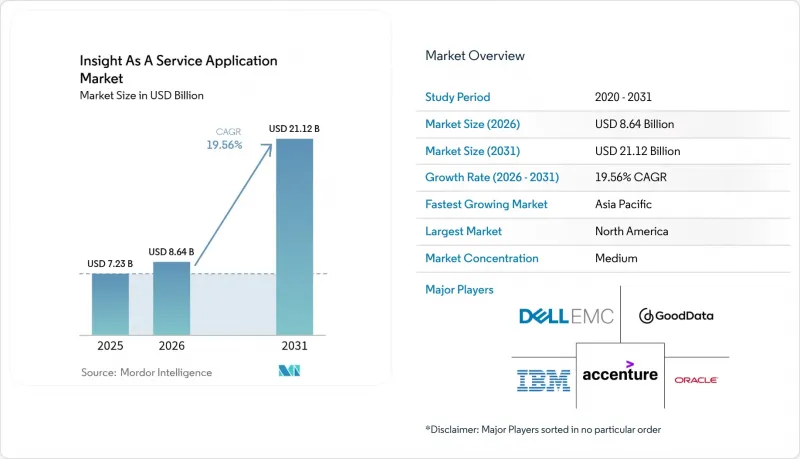
本報告按部署模式(例如,公共雲端)、服務類型(例如,預測性洞察)、應用(例如,客戶生命週期管理)、組織規模(例如,大型企業、中小企業)、最終用戶行業(例如,銀行、金融服務和保險 (BFSI)、IT 和電信)以及地區(例如,北美)進行細分。市場預測以美元 (USD) 為單位。
全球 IaaS(IaaS,即洞察即服務)應用市場趨勢與洞察
擴大生成式人工智慧在自動化洞察生成的應用
生成式人工智慧將獲取洞察所需的時間從數天縮短至數分鐘。 IBM 的「watsonx.Data」將大規模語言模型整合到 Lakehouse 環境中,使分析師能夠以對話的方式查詢結構化和非結構化資料。 Snowflake 在第一季處理了 120 億次 Cortex AI查詢,其中 35% 使用了文件摘要等生成式功能。 SAP 客戶在將 Joule Copilot 與 Analytics Cloud 整合後,將月末結算週期縮短了 60%。生成式人工智慧透過自動化敘事創建和異常檢測,使分析更易於普及,從而擴展了 IaaS(洞察即服務)應用市場。
遷移到基於使用量的分析訂閱
混合定價模式結合了基礎費用和按使用量計費,目前已有 61% 的 SaaS 供應商採用該模式,高於 2022 年的 38%。 Databricks 的計量型收入年增 75%,是其基於授權模式成長率的三倍,這得益於客戶即時和機器學習工作負載的擴展。這種靈活的模式消除了中小企業的資金壁壘,並將供應商的獎勵與績效掛鉤,從而使客戶維繫時間比固定套餐延長了 18 個月。
資料安全與保障問題
2024年6月,Snowflake發生安全漏洞事件,攻擊者利用重複使用的憑證入侵了165個客戶環境,動搖了人們對雲端分析的信心。 IBM X-Force的研究表明,28%的漏洞是由於配置錯誤造成的,其中許多錯誤與分析服務複雜的權限模型有關。歐盟NIS2指令要求在24小時內揭露安全事件,這加大了合規壓力。日益嚴格的監控也限制了短期業務擴張,導致採購流程放緩,概念驗證(PoC)週期延長。
細分市場分析
預計到 2025 年,公共雲端將佔據 IaaS(基礎設施即服務)應用市場 55.02% 的佔有率,而混合雲環境預計將以 20.24% 的複合年成長率成長至 2031 年。 IBM 的研究表明,87% 的企業使用多個雲端平台,其中 62% 的企業表示合規性是主要原因。隨著企業在本地和公共雲端之間編配Kubernetes,Red Hat OpenShift 的訂閱量比去年同期成長了 34%。
隨著金融機構將敏感資料儲存在本地,同時繼續在超大規模資料中心業者訓練模型,混合雲環境的採用率正在不斷提高。谷歌雲端的敏感運算功能透過加密處理過程中的數據,使得受監管的工作負載能夠遷移到公共基礎設施,預計到2024年,醫療保健行業的客戶數量將增加58%。工廠和零售店的邊緣節點如今已成為混合雲端的延伸,進一步加深了IaaS(洞察即服務)應用市場的滲透。
儘管在收入方面,指導性洞察目前落後於預測性洞察,但隨著企業營運決策自動化,其複合年成長率正以 23.12% 的速度成長。 Anaplan 的「互聯規劃」可將消費品製造商的手動場景建模工作量減少 70%。 Workday 於 2024 年收購一家最佳化引擎公司,凸顯了其轉型為建議型服務的趨勢。
深度強化學習已展現出其強大的預測能力。 DeepMind 曾經幫助Google資料中心在 2024 年降低了 40% 的能耗。隨著越來越多的公司將決策引擎直接整合到工作流程中,面向預測平台的 IaaS(洞察即服務)應用市場規模將會擴大。
區域分析
到2025年,北美將佔據IaaS(洞察即服務)應用市場40.77%的佔有率。美國聯邦資料戰略要求在2025年使用開放API來存取公共資料集,這推動了政府對分析需求的成長。加拿大正透過撥款24億加元(約18億美元)用於聯邦政府機構的雲端遷移,促進該地區的成長。墨西哥的開放銀行監理政策正在推動金融科技分析的發展,預計2024年底,每月API呼叫量將達到4.5億次。
亞太地區預計將以21.77%的複合年成長率成長,成為全球成長最快的地區。中國的「數位經濟發展規劃」旨在實現數據驅動型產業每年10%的成長。印度的「數位印度」舉措正使12億居民能夠使用數位身分和支付服務,從而擴大公共服務的分析工作負載。新加坡已在其「智慧國家」計畫中部署了11萬個感測器,為即時最佳化模型提供數據。政府監管和超大規模資料中心業者資料中心的投資正在進一步鞏固IaaS(洞察即服務)應用市場的地位。
歐洲的《一般資料保護規範》(GDPR) 透過嚴格的資料最小化和刪除規則影響架構設計,導致專案成本增加 15% 至 20%。德國的 Gaia-X 聯盟的目標是在 2024 年底前擁有 350 家成員公司,這將刺激對分散式分析平台的需求。英國已累計12 億英鎊(約 15 億美元)用於公共部門資料現代化,其中 40% 將用於國家醫療服務體系 (NHS) 的計畫。新興市場也出現了局部的發展勢頭,例如沙烏地阿拉伯耗資 5000 億美元的智慧城市“NEOM”,邊緣分析正在推動交通和能源的最佳化。
其他好處:
- Excel格式的市場預測(ME)表
- 3個月的分析師支持
目錄
第1章:引言
- 研究假設和市場定義
- 調查範圍
第2章:調查方法
第3章執行摘要
第4章 市場狀況
- 市場概覽
- 宏觀經濟因素對市場的影響
- 市場促進因素
- 巨量資料和物聯網的應用日益廣泛
- 對客戶參與日益成長的需求
- 擴大生成式人工智慧在自動化洞察獲取方面的應用
- 過渡到基於消費的分析訂閱
- 隨著合規性變得越來越複雜,對外包洞察的需求也不斷成長。
- 產業專用的人工智慧平台的擴展
- 市場限制因素
- 資料安全與保障問題
- 特定領域資料科學人才短缺
- 供應商鎖定和互通性挑戰
- 雲端處理成本不斷上漲,給企業帶來了越來越大的壓力。
- 產業價值鏈分析
- 監理情勢
- 技術展望
- 波特五力分析
第5章 市場規模與成長預測
- 部署模式
- 公共雲端
- 私有雲端
- 混合雲端
- 按服務類型
- 預測性洞察
- 說明見解
- 處方見解
- 透過使用
- 客戶生命週期管理
- 收入周期管理
- 品牌和行銷方面的見解
- 策略管理
- 供應鏈最佳化
- 其他用途
- 按組織規模
- 大公司
- 小型企業
- 按最終用戶行業分類
- BFSI
- 資訊科技/通訊
- 衛生保健
- 零售與電子商務
- 製造業
- 能源公用事業
- 其他終端用戶產業
- 按地區
- 北美洲
- 美國
- 加拿大
- 墨西哥
- 南美洲
- 巴西
- 阿根廷
- 其他南美國家
- 歐洲
- 德國
- 英國
- 法國
- 義大利
- 西班牙
- 其他歐洲國家
- 亞太地區
- 中國
- 日本
- 印度
- 韓國
- 其他亞太國家
- 中東和非洲
- 中東
- 沙烏地阿拉伯
- 阿拉伯聯合大公國
- 土耳其
- 其他中東國家
- 非洲
- 南非
- 奈及利亞
- 肯亞
- 其他非洲國家
- 中東
- 北美洲
第6章 競爭情勢
- 市場集中度
- 策略趨勢
- 市佔率分析
- 公司簡介
- Oracle Corporation
- Accenture plc
- International Business Machines Corporation
- Dell Technologies Inc.
- Deloitte Touche Tohmatsu Limited
- GoodData Corporation
- Capgemini SE
- SmartFocus Ltd.
- Zephyr AI Health Inc.
- NTT Data Corporation
- Microsoft Corporation
- Amazon Web Services Inc.
- Google LLC
- SAP SE
- SAS Institute Inc.
- Salesforce Inc.
- TIBCO Software Inc.
- Alteryx Inc.
- QlikTech International AB
- Tableau Software LLC
- Sisense Inc.
- Domo Inc.
- Teradata Corporation
- MicroStrategy Incorporated
第7章 市場機會與未來展望
According to Mordor Intelligence, the insight-as-a-service application market size in 2026 is estimated at USD 8.64 billion, growing from 2025 value of USD 7.23 billion with 2031 projections showing USD 21.12 billion, growing at 19.56% CAGR over 2026-2031.
This report is Segmented by Deployment Mode (Public Cloud, and More), Service Type (Predictive Insights, and More), Application (Customer Life-Cycle Management, and More), Organization Size (Large Enterprises, and Small and Medium Enterprises), End-User Industry (BFSI, IT and Telecom, and More), and Geography (North America, and More). The Market Forecasts are Provided in Terms of Value (USD).
Global Insight As A Service Application Market Trends and Insights
Growing Use of Generative AI for Automated Insights
Generative AI is compressing insight delivery from days to minutes. IBM's watsonx.Data embeds large language models inside lakehouse environments, allowing analysts to query structured and unstructured data conversationally. Snowflake processed 12 billion Cortex AI queries in its first quarter, with 35% of these queries utilizing generative functions, such as document summarization. SAP customers cut month-end close cycles by 60% after integrating the Joule Copilot with Analytics Cloud. By automating narrative creation and anomaly detection, generative AI democratizes analytics and broadens the insight-as-a-service application market.
Migration Toward Consumption-Based Analytics Subscriptions
Hybrid pricing, which combines a base fee with usage overages, now covers 61% of software-as-a-service vendors, up from 38% in 2022. Databricks' consumption revenue rose 75% year over year, triple its seat-based growth, after customers expanded real-time and machine-learning workloads. The flexible model removes capital barriers for SMEs and aligns vendor incentives with performance, fueling retention that averages 18 months longer than fixed plans.
Data Security and Safety Concerns
Snowflake's June 2024 breach exposed 165 customer environments after attackers used recycled credentials, shaking confidence in cloud analytics. IBM's X-Force found misconfigurations caused 28% of breaches, many tied to complex permission models on analytics services. Europe's NIS2 directive now requires incident disclosure within 24 hours, adding compliance pressure. Heightened scrutiny slows procurement and lengthens proof-of-concept cycles, limiting near-term expansion.
Other drivers and restraints analyzed in the detailed report include:
- Increasing Adoption of Big Data and IoT
- Increasing Customer Engagement Demand
- Shortage of Domain-Specific Data-Science Talent
For complete list of drivers and restraints, kindly check the Table Of Contents.
Segment Analysis
Hybrid environments are projected to grow at a 20.24% CAGR through 2031, despite the public cloud holding a 55.02% share of the insight-as-a-service application market in 2025. IBM found 87% of enterprises use multiple clouds, with 62% citing compliance as a driver. Red Hat OpenShift subscriptions rose 34% year over year as firms orchestrated Kubernetes across on-premise and public clouds.
Hybrid adoption is on the rise as financial institutions continue to store sensitive data on-premises while training models in hyperscaler regions. Google Cloud's confidential computing encrypts data during processing, bringing regulated workloads to public infrastructure and lifting healthcare customer count 58% in 2024. Edge nodes at factories and stores are now extensions of hybrid clouds, deepening the penetration of the insight-as-a-service application market.
Prescriptive insights, though trailing predictive insight revenue today, are advancing at a 23.12% CAGR as companies automate operational choices. Anaplan's connected planning reduces manual scenario modeling by 70% for consumer goods manufacturers. Workday's 2024 purchase of an optimization engine confirms the pivot toward recommendation-oriented services.
Deep reinforcement learning demonstrates its prescriptive power: DeepMind reduced Google's data-center energy use by 40% in 2024. As more firms embed decision engines directly into workflows, the insight-as-a-service application market size for prescriptive platforms will widen.
Complete Report Scope:
- By Deployment Mode
- Public Cloud
- Private Cloud
- Hybrid Cloud
- By Service Type
- Predictive Insights
- Descriptive Insights
- Prescriptive Insights
- By Application
- Customer Life-Cycle Management
- Revenue Cycle Management
- Branding and Marketing Insights
- Strategy Management
- Supply-Chain Optimization
- Other Applications
- By Organization Size
- Large Enterprises
- Small and Medium Enterprises
- By End-user Industry
- BFSI
- IT and Telecom
- Healthcare
- Retail and E-Commerce
- Manufacturing
- Energy and Utilities
- Other End-user Industries
- By Geography
- North America
- United States
- Canada
- Mexico
- South America
- Brazil
- Argentina
- Rest of South America
- Europe
- Germany
- United Kingdom
- France
- Italy
- Spain
- Rest of Europe
- Asia Pacific
- China
- Japan
- India
- South Korea
- Rest of Asia Pacific
- Middle East and Africa
- Middle East
- Saudi Arabia
- United Arab Emirates
- Turkey
- Rest of Middle East
- Africa
- South Africa
- Nigeria
- Kenya
- Rest of Africa
- Middle East
- North America
Geography Analysis
North America accounted for 40.77% of the insight-as-a-service application market in 2025. The United States Federal Data Strategy mandates the use of open APIs for public datasets by 2025, thereby expanding government analytics demand. Canada allocated CAD 2.4 billion (USD 1.8 billion) for cloud migration in federal agencies, supporting regional growth. Mexico's open-banking regulation generated 450 million API calls monthly by year-end 2024, catalyzing fintech analytics.
The Asia Pacific is projected to post a 21.77% CAGR, the fastest growth rate worldwide. China's Digital Economy Development Plan aims for a 10% annual expansion in data-driven industries. India's Digital India initiative connected 1.2 billion residents to digital ID and payments, broadening analytics workloads in public services. Singapore deployed 110,000 sensors under its Smart Nation program, feeding real-time optimization models. Government mandates and hyperscaler investment combine to deepen the insight-as-a-service application market footprint.
Europe's GDPR influences architectural design through strict data minimization and deletion rules, adding 15-20% to project costs. Germany's Gaia-X federation enrolled 350 firms by late 2024, spurring demand for distributed analytics platforms. The United Kingdom budgeted GBP 1.2 billion (USD 1.5 billion) for public-sector data modernization, with National Health Service projects taking 40% of spending. Emerging markets show pockets of momentum, such as Saudi Arabia's USD 500 billion NEOM smart-city deployment, where edge analytics underpin transport and energy optimization.
- Oracle Corporation
- Accenture plc
- International Business Machines Corporation
- Dell Technologies Inc.
- Deloitte Touche Tohmatsu Limited
- GoodData Corporation
- Capgemini SE
- SmartFocus Ltd.
- Zephyr AI Health Inc.
- NTT Data Corporation
- Microsoft Corporation
- Amazon Web Services Inc.
- Google LLC
- SAP SE
- SAS Institute Inc.
- Salesforce Inc.
- TIBCO Software Inc.
- Alteryx Inc.
- QlikTech International AB
- Tableau Software LLC
- Sisense Inc.
- Domo Inc.
- Teradata Corporation
- MicroStrategy Incorporated
Additional Benefits:
- The market estimate (ME) sheet in Excel format
- 3 months of analyst support
TABLE OF CONTENTS
1 INTRODUCTION
- 1.1 Study Assumptions and Market Definition
- 1.2 Scope of the Study
2 RESEARCH METHODOLOGY
3 EXECUTIVE SUMMARY
4 MARKET LANDSCAPE
- 4.1 Market Overview
- 4.2 Impact of Macroeconomic Factors on the Market
- 4.3 Market Drivers
- 4.3.1 Increasing Adoption of Big Data and IoT
- 4.3.2 Increasing Customer Engagement Demand
- 4.3.3 Growing Use of Generative AI for Automated Insights
- 4.3.4 Migration Toward Consumption-Based Analytics Subscriptions
- 4.3.5 Rising Compliance Complexity Driving Outsourced Insight Demand
- 4.3.6 Expansion of Industry-Specific Vertical AI Platforms
- 4.4 Market Restraints
- 4.4.1 Data Security and Safety Concerns
- 4.4.2 Shortage of Domain-Specific Data-Science Talent
- 4.4.3 Vendor Lock-In and Interoperability Challenges
- 4.4.4 Escalating Cloud-Compute Cost Pressures
- 4.5 Industry Value Chain Analysis
- 4.6 Regulatory Landscape
- 4.7 Technological Outlook
- 4.8 Porter's Five Forces Analysis
- 4.8.1 Threat of New Entrants
- 4.8.2 Bargaining Power of Buyers
- 4.8.3 Bargaining Power of Suppliers
- 4.8.4 Threat of Substitute Products
- 4.8.5 Intensity of Competitive Rivalry
5 MARKET SIZE AND GROWTH FORECASTS (VALUE)
- 5.1 By Deployment Mode
- 5.1.1 Public Cloud
- 5.1.2 Private Cloud
- 5.1.3 Hybrid Cloud
- 5.2 By Service Type
- 5.2.1 Predictive Insights
- 5.2.2 Descriptive Insights
- 5.2.3 Prescriptive Insights
- 5.3 By Application
- 5.3.1 Customer Life-Cycle Management
- 5.3.2 Revenue Cycle Management
- 5.3.3 Branding and Marketing Insights
- 5.3.4 Strategy Management
- 5.3.5 Supply-Chain Optimization
- 5.3.6 Other Applications
- 5.4 By Organization Size
- 5.4.1 Large Enterprises
- 5.4.2 Small and Medium Enterprises
- 5.5 By End-user Industry
- 5.5.1 BFSI
- 5.5.2 IT and Telecom
- 5.5.3 Healthcare
- 5.5.4 Retail and E-Commerce
- 5.5.5 Manufacturing
- 5.5.6 Energy and Utilities
- 5.5.7 Other End-user Industries
- 5.6 By Geography
- 5.6.1 North America
- 5.6.1.1 United States
- 5.6.1.2 Canada
- 5.6.1.3 Mexico
- 5.6.2 South America
- 5.6.2.1 Brazil
- 5.6.2.2 Argentina
- 5.6.2.3 Rest of South America
- 5.6.3 Europe
- 5.6.3.1 Germany
- 5.6.3.2 United Kingdom
- 5.6.3.3 France
- 5.6.3.4 Italy
- 5.6.3.5 Spain
- 5.6.3.6 Rest of Europe
- 5.6.4 Asia Pacific
- 5.6.4.1 China
- 5.6.4.2 Japan
- 5.6.4.3 India
- 5.6.4.4 South Korea
- 5.6.4.5 Rest of Asia Pacific
- 5.6.5 Middle East and Africa
- 5.6.5.1 Middle East
- 5.6.5.1.1 Saudi Arabia
- 5.6.5.1.2 United Arab Emirates
- 5.6.5.1.3 Turkey
- 5.6.5.1.4 Rest of Middle East
- 5.6.5.2 Africa
- 5.6.5.2.1 South Africa
- 5.6.5.2.2 Nigeria
- 5.6.5.2.3 Kenya
- 5.6.5.2.4 Rest of Africa
- 5.6.5.1 Middle East
- 5.6.1 North America
6 COMPETITIVE LANDSCAPE
- 6.1 Market Concentration
- 6.2 Strategic Moves
- 6.3 Market Share Analysis
- 6.4 Company Profiles (includes Global Level Overview, Market Level Overview, Core Segments, Financials as available, Strategic Information, Market Rank / Share for Key Companies, Products and Services, and Recent Developments)
- 6.4.1 Oracle Corporation
- 6.4.2 Accenture plc
- 6.4.3 International Business Machines Corporation
- 6.4.4 Dell Technologies Inc.
- 6.4.5 Deloitte Touche Tohmatsu Limited
- 6.4.6 GoodData Corporation
- 6.4.7 Capgemini SE
- 6.4.8 SmartFocus Ltd.
- 6.4.9 Zephyr AI Health Inc.
- 6.4.10 NTT Data Corporation
- 6.4.11 Microsoft Corporation
- 6.4.12 Amazon Web Services Inc.
- 6.4.13 Google LLC
- 6.4.14 SAP SE
- 6.4.15 SAS Institute Inc.
- 6.4.16 Salesforce Inc.
- 6.4.17 TIBCO Software Inc.
- 6.4.18 Alteryx Inc.
- 6.4.19 QlikTech International AB
- 6.4.20 Tableau Software LLC
- 6.4.21 Sisense Inc.
- 6.4.22 Domo Inc.
- 6.4.23 Teradata Corporation
- 6.4.24 MicroStrategy Incorporated
7 MARKET OPPORTUNITIES AND FUTURE OUTLOOK
- 7.1 White-Space and Unmet-Need Assessment

 洞察即服務市場規模、佔有率和成長分析:按服務類型、部署模式、組織規模、最終用戶產業和地區分類-2026-2033 年產業預測
 洞察即服務市場:2026-2032年全球市場預測(依洞察類型、部署模式、應用、組織規模及最終用戶產業分類)
 2026年全球洞察即服務市場報告
 洞察即服務市場分析及至2035年預測:按類型、產品類型、服務、技術、組件、應用、部署類型、最終用戶、解決方案和交付類型分類
 SCREEN:趨勢與市場洞察服務
 洞察即服務市場-全球產業規模、佔有率、趨勢、機會和預測(按應用、組織規模、部署模式、最終用戶產業、地區和競爭格局分類,2020-2030 年預測)洞察即服務應用市場-全球產業規模、佔有率、趨勢、機會及預測(按部署模式、最終用戶產業、地區和競爭格局分類,2020-2030 年預測)
 IaaS(洞察即服務)市場規模、佔有率、趨勢分析報告:按類型、部署、公司規模、最終用途、地區和細分市場進行預測,2025 年至 2030 年