


 |
市場調查報告書
商品編碼
2122946
美國行銷分析:市場佔有率分析、產業趨勢與統計、成長預測(2026-2031)United States Marketing Analytics - Market Share Analysis, Industry Trends & Statistics, Growth Forecasts (2026 - 2031) |
||||||

※ 本網頁內容可能與最新版本有所差異。詳細情況請與我們聯繫。
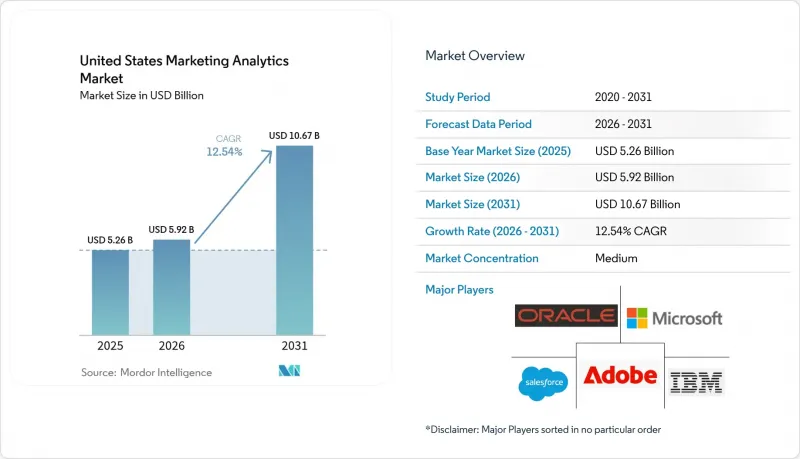
據 Mordor Intelligence 稱,2025 年美國行銷分析市場價值 52.6 億美元,預計將從 2026 年的 59.2 億美元成長到 2031 年的 106.7 億美元。
預測期(2026-2031 年)的複合年成長率預計為 12.54%。
本報告按部署類型(雲端和本地部署)、分析類型(說明、診斷性、預測性、指導性)、應用領域(線上、電子郵件、內容、社交媒體及其他)和最終用戶(零售、銀行、金融服務和保險 (BFSI)、教育、醫療保健、製造業、旅遊和酒店業及其他)進行細分。市場預測以美元 (USD) 為單位。
美國行銷分析市場趨勢與洞察
越來越需要有效利用行銷預算來實現投資報酬率。
董事會正在更嚴格地審查可自由支配的支出,行銷長 (CMO) 也被要求證明每項宣傳活動對收入的直接貢獻。杜克大學的一項 CMO 調查發現,截至 2024 年秋季,行銷科技的採用率仍低於 40%,凸顯了投資與實際價值之間的差距,儘管預算佔企業收入的比例保持在 9.1% 不變。整合來自廣告、客戶關係管理 (CRM) 和電商平台資料的集中式儀錶板正在取代孤立的獨立解決方案,從而實現多點觸控歸因和生命週期價值 (LTV) 建模。提供無程式碼連接器的供應商正在將實施時間從幾個季度縮短到幾週,使不具備技術專長的團隊也能利用高階分析功能。隨著廣告支出回報率 (ROAS) 成為最重要的指標,那些已將分析功能整合到營運中的公司正在經歷更短的預算核准週期和更快的宣傳活動部署。
雲端運算和巨量資料技術的應用
彈性雲端基礎設施已成為行銷技術工作負載的事實標準。到 2024 年,71% 的公司將至少將一項行銷分析流程遷移到雲端,高於 2023 年的 58%。雲端資料湖從網路、行動裝置和銷售點 (POS) 系統攝取串流事件,並運行機器學習模型以即時建立微細分。 Snowflake 和 Adobe Experience Platform 等夥伴關係的整合,使得無需重複儲存即可使用第一方數據,從而降低延遲並節省成本。 Apache Spark 等開放原始碼引擎支援增量處理,可在幾秒鐘內更新使用者畫像,而無需每晚進行大量處理。這些架構優勢有助於加快敏捷實驗和回饋循環。
高昂的實施成本和系統整合問題
實施全端分析解決方案需要授權、雲端資源、資料工程和變更管理。中型企業通常管理 90 個或更多行銷應用程式,導致資料模式分散、客戶識別碼重複,以及整合工作量增加。此外,資料量的激增導致雲端支出超出預期,迫使財務部門重新評估總體擁有成本 (TCO)。雖然供應商現在提供捆綁式託管服務、付費使用制和預先建置連接器,但初始部署負擔仍然會延緩資源有限的買家獲得洞察所需的時間。
細分市場分析
預計到2025年,美國行銷分析市場的雲端採用率將達到37.3億美元,複合年成長率(CAGR)為13.74%,鞏固對本地部署解決方案的主導地位。到2025年,雲端將佔據美國行銷分析市場70.88%的佔有率,反映出企業對彈性容量、自動化功能發布和按需收費的偏好。由於基礎設施即服務(IaaS)能夠減少硬體更新周期和降低資料中心營運成本,投資正進一步轉向IaaS。
領先的供應商現在提供符合 HIPAA 標準的環境、FedRAMP 認證和 SOC 2 II 型認證,使合規團隊能夠自信地遷移受監管的工作負載。即使是監管嚴格的行業也在試點混合架構,將敏感資料保留在本地,同時將運算密集型分析處理卸載到雲端。整合到同一環境中的機器學習服務降低了資料遷移成本並加快了模型部署速度,這對於面臨資料科學人才短缺的中型企業來說是一項顯著優勢。
到2025年,預測分析將繼續佔據美國行銷分析市場最大佔有率,達到18.1億美元,市佔率34.35%。同時,處方分析正以13.28%的複合年成長率快速成長,反映出行銷人員對自動化「最佳行動方案」建議的需求,這些建議能夠彌合洞察與執行之間的差距。處方分析引擎會評估發送時間、優惠價值和創新變體等多種因素的組合,從而即時執行最具盈利的行動。
整合到雲端平台的自動化機器學習 (AutoML) 工具可自動進行特徵工程和模型調優,即使是資料科學資源有限的團隊也能輕鬆使用。診斷和說明分析仍然是經營團隊報告的重要組成部分,但其被動性限制了其策略影響力。隨著演算法決策在日常營運中日益普及,可解釋性和偏差檢驗的管治流程正日趨標準化,尤其是在金融服務和醫療保健等應用情境中。
其他好處:
- Excel格式的市場預測(ME)表
- 3個月的分析師支持
目錄
第1章:引言
- 研究假設和市場定義
- 調查範圍
第2章:調查方法
第3章執行摘要
第4章 市場狀況
- 市場概覽
- 市場促進因素
- 有效利用行銷預算以實現投資報酬率的需求日益成長
- 雲端運算和巨量資料技術的應用
- 社群媒體管道的傳播
- 監管機構越來越關注第一方資料策略。
- 向即時個人化引擎的轉變正在加速。
- 隱私保護分析框架的出現
- 市場限制因素
- 系統整合實施成本高且面臨許多挑戰
- 功能豐富的開放原始碼工具的可用性
- 各州消費者資料保護法律的增加
- 高階分析和數據工程領域人才短缺。
- 產業價值鏈分析
- 宏觀經濟因素對市場的影響
- 技術展望
- 波特五力分析
- 監理情勢
第5章 市場規模與成長預測
- 不同的發展
- 雲
- 現場
- 按分析類型
- 說明分析
- 診斷分析
- 預測分析
- 指示性分析
- 透過使用
- 網路行銷
- 電子郵件行銷
- 內容行銷
- 社群媒體行銷
- 其他用途
- 最終用戶
- 零售
- 銀行業、金融服務業及保險業
- 教育
- 衛生保健
- 製造業
- 旅遊與飯店
- 其他最終用戶
第6章 競爭情勢
- 市場集中度
- 策略趨勢
- 市佔率分析
- 公司簡介
- IBM Corporation
- Microsoft Corporation
- Oracle Corporation
- Salesforce Inc.
- Adobe Inc.
- SAS Institute Inc.
- Teradata Corporation
- Accenture plc
- Neustar Inc.
- Pegasystems Inc.
- Alphabet Inc.
- HubSpot Inc.
- Amplitude Inc.
- Mixpanel Inc.
- Sprinklr Inc.
- Hootsuite Inc.
- Klaviyo Inc.
- Nielsen Holdings plc
- Experian plc
- Similarweb Ltd.
第7章 市場機會與未來展望
According to Mordor Intelligence, the United States marketing analytics market size was valued at USD 5.26 billion in 2025 and estimated to grow from USD 5.92 billion in 2026 to reach USD 10.67 billion by 2031, at a CAGR of 12.54% during the forecast period (2026-2031).
This report is Segmented by Deployment (Cloud, and On-Premise), Analytics Type (Descriptive, Diagnostic, Predictive, and Prescriptive), Application (Online, E-Mail, Content, Social Media, and Other), End User (Retail, BFSI, Education, Healthcare, Manufacturing, Travel and Hospitality, and More). The Market Forecasts are Provided in Terms of Value (USD).
United States Marketing Analytics Market Trends and Insights
Increasing Need to Utilize Marketing Budgets for an Effective ROI
Boards are scrutinizing discretionary spending, prompting chief marketing officers to demonstrate the direct contribution of every campaign to revenue. The Duke CMO Survey showed that martech utilization remained below 40% in Fall 2024, even as budgets held steady at 9.1% of firm revenue, underscoring a gap between investment and realized value. Unified dashboards that consolidate data from advertising, CRM, and commerce platforms are replacing siloed point solutions, enabling multi-touch attribution and lifetime-value modeling. Vendors offering no-code connectors shorten implementation windows from quarters to weeks, making advanced analytics accessible to non-technical teams. As return-on-ad-spend becomes the North Star metric, enterprises that operationalize analytics experience faster budget approval cycles and higher campaign velocity.
Adoption of Cloud Technology and Big Data
Elastic cloud infrastructure has become the default for martech workloads, with 71% of enterprises migrating at least one marketing analytics process to the cloud in 2024, up from 58% in 2023. Cloud data lakes ingest streaming web, mobile, and point-of-sale events, then execute machine-learning models that create micro-segments in real time. Partnerships such as Snowflake's integration with Adobe Experience Platform allow activation of first-party data without duplicating storage, cutting latency and reducing cost. Open-source engines like Apache Spark now power incremental processing that updates profiles within seconds rather than overnight batches. These architectural gains translate into agile experimentation and faster feedback loops.
High Cost of Implementation and System Integration Issues
Deploying a full-stack analytics solution requires software licenses, cloud resources, data engineering, and change management. Mid-market firms often manage more than 90 marketing applications, which creates fragmented schemas and duplicate customer identifiers that inflate the labor needed for integration. Cloud spending can also exceed projections as data volumes surge, prompting finance teams to re-examine total cost of ownership. Vendors now respond with bundled managed services, consumption-based pricing, and pre-built connectors, yet the up-front lift still delays time-to-insight for resource-constrained buyers.
Other drivers and restraints analyzed in the detailed report include:
- Proliferation of Social Media Channels
- Growing Regulatory Focus on First-Party Data Strategies
- Increasing State-Level Consumer Data-Protection Statutes
For complete list of drivers and restraints, kindly check the Table Of Contents.
Segment Analysis
The United States marketing analytics market size for cloud deployment stood at USD 3.73 billion in 2025 and is forecast to rise at a 13.74% CAGR, cementing its dominance over on-premise alternatives. Cloud captured 70.88% of United States marketing analytics market share in 2025, reflecting enterprises' preference for elastic capacity, automatic feature releases, and usage-based billing. Cost avoidance from hardware refresh cycles and data-center overhead further tilts investment toward infrastructure-as-a-service.
Major providers now offer HIPAA-eligible environments, FedRAMP authorizations, and SOC 2 Type II attestations, giving compliance teams confidence to migrate regulated workloads. Even highly regulated sectors are piloting hybrid architectures that keep sensitive data on-premise while offloading compute-intensive analytics to the cloud. Machine-learning services embedded within the same environment reduce data-movement costs and speed model deployment, a benefit resonating with mid-market firms lacking data-science headcount.
Predictive analytics maintained the largest slice of the United States marketing analytics market size at USD 1.81 billion in 2025, equal to 34.35% share in 2025. Prescriptive analytics, however, is expanding at a 13.28% CAGR, reflecting marketer appetite for automated next-best-action recommendations that close the gap between insight and activation. Prescriptive engines evaluate permutations of send times, offer values, and creative variants, then trigger the highest-yield action in real time.
AutoML tooling embedded in cloud platforms automates feature engineering and model tuning, democratizing access for teams with limited data-science resources. Diagnostic and descriptive analytics remain table stakes for executive reporting, yet their reactive nature limits strategic impact. As algorithmic decision-making permeates daily operations, governance processes around explainability and bias review are becoming standard, particularly in financial-services and healthcare use cases.
Complete Report Scope:
- By Deployment
- Cloud
- On-Premise
- By Analytics Type
- Descriptive Analytics
- Diagnostic Analytics
- Predictive Analytics
- Prescriptive Analytics
- By Application
- Online Marketing
- E-Mail Marketing
- Content Marketing
- Social Media Marketing
- Other Applications
- By End User
- Retail
- Banking, Financial Services and Insurance
- Education
- Healthcare
- Manufacturing
- Travel and Hospitality
- Other End Users
List of Companies Covered in this Report:
- IBM Corporation
- Microsoft Corporation
- Oracle Corporation
- Salesforce Inc.
- Adobe Inc.
- SAS Institute Inc.
- Teradata Corporation
- Accenture plc
- Neustar Inc.
- Pegasystems Inc.
- Alphabet Inc.
- HubSpot Inc.
- Amplitude Inc.
- Mixpanel Inc.
- Sprinklr Inc.
- Hootsuite Inc.
- Klaviyo Inc.
- Nielsen Holdings plc
- Experian plc
- Similarweb Ltd.
Additional Benefits:
- The market estimate (ME) sheet in Excel format
- 3 months of analyst support
TABLE OF CONTENTS
1 INTRODUCTION
- 1.1 Study Assumptions and Market Definition
- 1.2 Scope of the Study
2 RESEARCH METHODOLOGY
3 EXECUTIVE SUMMARY
4 MARKET LANDSCAPE
- 4.1 Market Overview
- 4.2 Market Drivers
- 4.2.1 Increasing Need to Utilize Marketing Budgets for an Effective ROI
- 4.2.2 Adoption of Cloud Technology and Big Data
- 4.2.3 Proliferation of Social Media Channels
- 4.2.4 Growing Regulatory Focus on First-Party Data Strategies
- 4.2.5 Accelerated Shift to Real-Time Personalization Engines
- 4.2.6 Emergence of Privacy-Preserving Analytics Frameworks
- 4.3 Market Restraints
- 4.3.1 High Cost of Implementation and System Integration Issues
- 4.3.2 Availability of Feature-Rich Open-Source Tools
- 4.3.3 Increasing State-Level Consumer Data-Protection Statutes
- 4.3.4 Talent Shortage in Advanced Analytics and Data Engineering
- 4.4 Industry Value Chain Analysis
- 4.5 Impact of Macroeconomic Factors on the Market
- 4.6 Technological Outlook
- 4.7 Porter's Five Forces Analysis
- 4.7.1 Threat of New Entrants
- 4.7.2 Bargaining Power of Buyers
- 4.7.3 Bargaining Power of Suppliers
- 4.7.4 Threat of Substitute Products
- 4.7.5 Intensity of Competitive Rivalry
- 4.8 Regulatory Landscape
5 MARKET SIZE AND GROWTH FORECASTS (VALUE)
- 5.1 By Deployment
- 5.1.1 Cloud
- 5.1.2 On-Premise
- 5.2 By Analytics Type
- 5.2.1 Descriptive Analytics
- 5.2.2 Diagnostic Analytics
- 5.2.3 Predictive Analytics
- 5.2.4 Prescriptive Analytics
- 5.3 By Application
- 5.3.1 Online Marketing
- 5.3.2 E-Mail Marketing
- 5.3.3 Content Marketing
- 5.3.4 Social Media Marketing
- 5.3.5 Other Applications
- 5.4 By End User
- 5.4.1 Retail
- 5.4.2 Banking, Financial Services and Insurance
- 5.4.3 Education
- 5.4.4 Healthcare
- 5.4.5 Manufacturing
- 5.4.6 Travel and Hospitality
- 5.4.7 Other End Users
6 COMPETITIVE LANDSCAPE
- 6.1 Market Concentration
- 6.2 Strategic Moves
- 6.3 Market Share Analysis
- 6.4 Company Profiles (includes Global level Overview, Market level overview, Core Segments, Financials as available, Strategic Information, Market Rank/Share for key companies, Products and Services, and Recent Developments)
- 6.4.1 IBM Corporation
- 6.4.2 Microsoft Corporation
- 6.4.3 Oracle Corporation
- 6.4.4 Salesforce Inc.
- 6.4.5 Adobe Inc.
- 6.4.6 SAS Institute Inc.
- 6.4.7 Teradata Corporation
- 6.4.8 Accenture plc
- 6.4.9 Neustar Inc.
- 6.4.10 Pegasystems Inc.
- 6.4.11 Alphabet Inc.
- 6.4.12 HubSpot Inc.
- 6.4.13 Amplitude Inc.
- 6.4.14 Mixpanel Inc.
- 6.4.15 Sprinklr Inc.
- 6.4.16 Hootsuite Inc.
- 6.4.17 Klaviyo Inc.
- 6.4.18 Nielsen Holdings plc
- 6.4.19 Experian plc
- 6.4.20 Similarweb Ltd.
7 MARKET OPPORTUNITIES AND FUTURE OUTLOOK
- 7.1 White-Space and Unmet-Need Assessment

 行銷分析市場:全球市場預測(2026-2032)
 行銷資料管理:市場佔有率分析、產業趨勢與統計、成長預測(2026-2031)行銷分析市場:市場佔有率分析、產業趨勢與統計、成長預測(2026-2031 年)
 潛在客戶開發軟體市場規模、佔有率和成長分析:按組件、部署類型、組織規模、應用、最終用戶和地區分類-2026-2033年產業預測潛在客戶開發軟體市場:2026-2032年全球市場預測(潛在客戶開發管道、組件類型、組織規模、部署模式及最終用戶產業分類)
 資料仲介市場規模、佔有率和成長分析:按資料類別、資料結構類型、收入和定價模式、最終用戶產業和地區分類-2026-2033年產業預測資料仲介市場:2026-2032年全球市場預測(按資料類型、交付方式、部署模式、應用程式和最終用戶產業分類)
 2026年全球PI到雲端資料仲介解決方案市場報告2026年全球潛在客戶開發軟體市場報告2026年全球數據仲介市場報告