


 |
市場調查報告書
商品編碼
2122593
收入週期管理:市場佔有率分析、產業趨勢與統計、成長預測(2026-2031)Revenue Cycle Management - Market Share Analysis, Industry Trends & Statistics, Growth Forecasts (2026 - 2031) |
||||||

※ 本網頁內容可能與最新版本有所差異。詳細情況請與我們聯繫。
根據 Mordor Intelligence 預測,收入週期管理 (RCM) 市場將從 2025 年的 864.5 億美元成長到 2026 年的 952.2 億美元,然後在 2031 年達到 1543.9 億美元,2026 年至 2031 年的複合年成長率為 10.15%。
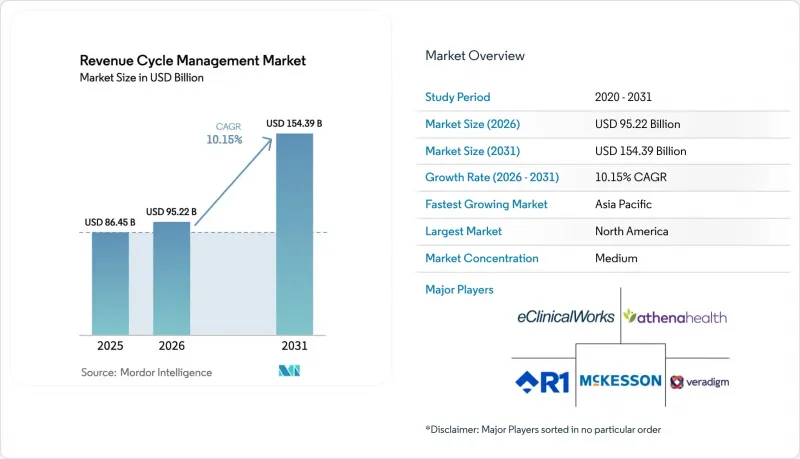
本報告按組件(軟體[例如整合式RCM套件]和服務[例如RCM BPO外包])、部署模式(雲端和本地部署)、功能(例如計費和拒付管理)、最終用戶(醫院、實驗室等)、專業領域(放射科、腫瘤科等)和地區(北美、歐洲等)進行細分。市場預測以美元計價。
全球收入周期管理市場趨勢及洞察
全球轉向基於價值和基於績效的還款模式。
以價值為基礎的醫療保健模式現已納入與主要保險公司的契約,它通過將支付與臨床質量而非服務量掛鉤,重新定義了收入周期管理行業的優先事項。採用責任制醫療框架的醫療系統已實現超過7億美元的成本節約,證明如果機構能夠妥善管理品質指標,就能獲得經濟效益。為了應對這一挑戰,RCM平台整合了一個“人群健康儀錶板”,該儀錶板將臨床結果轉化為報銷觸發條件,使醫療服務提供者能夠在支付風險出現之前追蹤護理缺口。這種演變隱含地要求對來自不同來源的資料進行標準化,從而為互通性創造了新的商業性緊迫性。
管理成本壓力不斷增加,推動了RCM的自動化。
由於行政成本始終占美國醫療支出的20%至25%,經營團隊將自動化視為遏止成本上漲的有效途徑。人工智慧驅動的機器人現在只需幾秒鐘即可完成以往需要手動審核和數天員工跟進的常規預核准流程。一些醫院報告稱,自實施自動化以來,發票創建時間縮短了50%。這些改進使計費負責人能夠專注於處理複雜的例外情況,從而帶來意想不到的生產力提升,經營團隊可以將這些資源重新分配到患者護理中。更重要的是,那些已實現從入院到現金支付流程自動化的醫療機構報告稱,員工滿意度有所提高,因為繁瑣且容易出錯的數據輸入工作已被消除。
保險公司規則和編碼標準多種多樣且不斷變化。
10%-15%左右的拒付率表明,支付方的審核標準和政策能夠迅速駁回原本符合規定的索賠。醫療集團領導者預計2024年拒付率將進一步上升,促使各機構投資於持續的程式碼更新和預測性審核工具,以便在提交前發出潛在拒付的警告。具有前瞻性的醫療系統設立了專門團隊來調查拒付的根本原因,編碼員和臨床醫生之間的迭代回饋循環縮短了糾正週期。人工智慧驅動的規則引擎能夠從支付方的聲明中學習,從而將附件要求降低到可衡量的水平,並降低了管理成本。
細分市場分析
在2025年的收入週期管理(RCM)市場中,服務業將佔據77.30%的市場佔有率,這反映出醫療服務提供者在勞動力短缺的情況下傾向於選擇承包專業解決方案的趨勢。客戶將外包視為提高投資報酬率的直接途徑,因為服務合作夥伴負責技術投資和持續的流程改善。儘管如此,基於雲端的軟體仍以13.65%的年複合成長率(CAGR),預計到2031年將持續成長。這是因為訂閱定價模式使成本與使用量相匹配,並消除了巨額資本投資的障礙。
已實施基於雲端的收入週期管理 (RCM) 套件的醫院通常會發現一些額外的益處,例如,儀表板可以即時顯示醫生文件的不足之處。這使得醫院能夠在一次輪班內提供糾正指導。隨著時間的推移,這些分析功能促使醫院內部團隊從行政工作轉向確保收入穩定的策略角色。這種雙重成長模式表明,將選擇性外包與內部監管相結合的混合營運模式將成為常態,從而為軟體公司和服務供應商在收入週期管理行業拓展更多商機。
到2025年,本地部署仍將佔據收入週期管理市場57.90%的佔有率,這反映了先前的資本投資和持續存在的安全隱患。然而,在靈活的基礎設施、自動化升級以及與支付方API的便利整合等因素的推動下,雲端採用率將以13.65%的複合年成長率成長至2031年。在HFMA技術採用曲線中不斷攀升的機構通常將向雲端遷移視為週期時間指標開始下降的轉折點。一項已證實的優勢是監管程式碼集的部署速度加快,因為雲端供應商可以集中提供更新,而無需依賴客戶的IT團隊。
隨著網路安全框架的日趨成熟,董事會層級對於異地託管的抵觸情緒正在減弱,財務長指出,可預測的訂閱費用簡化了多年預算編制。這種成本透明度正在悄悄地推動整個收入週期管理 (RCM) 市場的成長,因為曾經僅限於大規模大學醫院的功能現在也適用於中型醫院。
區域分析
北美目前佔據全球收入週期管理市場47.20%的佔有率,這得益於其複雜的多方支付系統和長期採用電子健康記錄(EHR)的歷史。 R1 RCM以89億美元完成的交易表明,供應商整合勢頭強勁,這反映出私募股權公司對規模化流程專業知識能夠帶來顯著現金流成長的信心。 46%的美國醫院表示,他們已在收入週期工作流程中以某種形式應用了人工智慧。值得注意的是,即使在加拿大的單一支付體系下,省級結算處理仍需要RCM工具,這表明支付方的複雜性並非推動成長的唯一因素。該地區關於報銷透明度的法規產生了豐富的資料集,使供應商能夠比其他地區更快地改進機器學習模型,從而進一步鞏固了北美的領先地位。
亞太地區預計到2031年將以15.92%的複合年成長率成長,這主要得益於政府主導的數位醫療投資以及中產階級對私人保險日益成長的需求,使其成為收入周期管理行業成長最快的地區。在印度,國家醫療保險的擴展正在加速標準化計費基礎設施的建設,而那些早期實現計費業務數位化的醫院則縮短了結算時間。在中國的三線城市,醫院正擴大採用基於雲端的收入周期管理(RCM)方案,以跨越傳統的客戶端-伺服器模式,這與智慧型手機普及率在其他行業的成長曲線類似。在日本等市場,由於資料本地化法律對託管架構進行規範,本地合作夥伴對於獲得監管部門的批准仍然至關重要。這種適應性需求對全球供應商構成了進入門檻,但對於佔據先機的公司而言,卻能帶來豐厚的回報。
在歐洲,收入週期管理 (RCM) 的市場佔有率保持穩定,但由於許多國家已採用統一計費標準的單一支付方模式,因此成長更為穩健。然而,GDPR 的要求正迫使醫院遷移到具有嚴格加密和審計追蹤功能的雲端環境,這促使美國和歐洲在隱私工程領域擁有專業知識的軟體公司之間開展更多合資項目。在英國,國家醫療服務體系 (NHS) 再次將重點放在減少積壓病例上,這推動了人們對類似於私營部門 RCM 的人工智慧驅動的排班和計費分診功能的興趣。同時,中東、非洲和南美洲是新興市場,私立醫院連鎖機構推動了初期需求,一旦法律規範成熟,將為加速採用 RCM 提供沃土。
其他好處:
- Excel格式的市場預測(ME)表
- 3個月的分析師支持
目錄
第1章:引言
- 研究假設和市場定義
- 調查範圍
第2章:調查方法
第3章執行摘要
第4章 市場狀況
- 市場概覽
- 市場促進因素
- 全球向基於價值和基於績效的還款體系轉型
- 不斷增加的成本控制壓力正在推動 RCM(監管控制管理)的自動化。
- 加快全球數位健康和互通性的強制性要求
- 醫療保健的消費化使得病患計費變得更加複雜。
- 雲端原生醫療IT平台的普及和SaaS的經濟效益
- 市場限制因素
- 支付機構的規則和編碼標準多種多樣且不斷變化。
- 熟練的編碼和收入周期管理人員長期短缺
- 資料隱私與網路安全風險:受保護健康資訊的處理
- 高昂的初始投資和變革管理障礙
- 技術展望
- 波特五力模型
第5章 市場規模與成長預測
- 按組件
- 軟體
- 整合式 RCM 套件
- 獨立模組
- 服務
- RCM BPO 外包
- 諮詢和培訓
- 軟體
- 不同的發展
- 基於雲端的
- 現場
- 按功能
- 保險索賠和拒付管理
- 醫療編碼和計費操作
- 電子健康記錄(整合RCM)
- 臨床文件改進(CDI)
- 確認保險資格
- 其他功能(患者預約管理、價格透明度)
- 最終用戶
- 醫院
- 診所和醫療辦公室
- 門診手術中心
- 研究所
- 診斷影像中心
- 其他最終用戶
- 專業領域
- 放射科
- 腫瘤學
- 循環系統
- 病理
- 多學科領域及其他
- 地區
- 北美洲
- 美國
- 加拿大
- 墨西哥
- 歐洲
- 德國
- 英國
- 法國
- 義大利
- 西班牙
- 其他歐洲國家
- 亞太地區
- 中國
- 日本
- 印度
- 澳洲
- 韓國
- 其他亞太國家
- 中東和非洲
- GCC
- 南非
- 其他中東和非洲國家
- 南美洲
- 巴西
- 阿根廷
- 其他南美國家
- 北美洲
第6章 競爭情勢
- 市場集中度
- 市佔率分析
- 公司簡介
- Optum(UnitedHealth Group)
- R1 RCM Inc.
- Conifer Health Solutions
- Cognizant(Trizetto)
- athenahealth
- Oracle Cerner
- Epic Systems
- Veradigm LLC
- Solventum
- GeBBS Healthcare
- MCKESSON Corporation
- Accenture Health
- Infosys Limited
- Med-Metrix
- Access Healthcare
- Conduent
- eClinicalWorks
- XIFIN
- Quest Diagnostics RCM
- HCLTech Healthcare
第7章 市場機會與未來展望
According to Mordor Intelligence, the revenue cycle management market size is expected to grow from USD 86.45 billion in 2025 to USD 95.22 billion in 2026 and is forecast to reach USD 154.39 billion by 2031 at 10.15% CAGR over 2026-2031.
This report Segments by Component (Software [Integrated RCM Suite, and More], and Services [Outsourced RCM BPO, and More]), Deployment (Cloud-Based and On-Premise), Function (Claims & Denial Management, and More) End User (Hospitals, Laboratories, and More), Specialty (Radiology, Oncology, and More) and Geography (North America, Europe, and More). The Market Forecasts are Provided in Terms of Value (USD).
Global Revenue Cycle Management Market Trends and Insights
Global Shift Toward Value-Based & Outcome-Linked Reimbursement
Value-based care, now written into major payer contracts, is recasting Revenue Cycle Management industry priorities by tying payment to clinical quality rather than service volume. Health systems that adopted accountable care frameworks recorded collective savings in excess of USD 700 million, proving that financial upside exists once organizations master quality metrics. As a response, RCM platforms are integrating population-health dashboards that translate clinical outcomes into reimbursement triggers, ensuring that providers track gaps in care before payment risk materializes. That evolution implicitly demands normalized data from disparate sources, giving interoperability a new commercial urgency.
Escalating Administrative Cost Pressure Prompting RCM Automation
Administrative expenses routinely consume 20 - 25 % of United States healthcare spending, so executives view automation as a proven lever to arrest cost inflation. AI-enabled bots now complete routine prior authorization transactions in seconds, a process that previously required manual review and days of staff follow-up, and some hospitals have documented a 50 % reduction in claim preparation time after deployment. These improvements free billing professionals to concentrate on complex exceptions, generating an unplanned productivity dividend that management can redeploy toward patient-facing roles. Importantly, institutions that automate admit-through-cash workflows report heightened staff satisfaction because tedious, error-prone data entry tasks disappear.
Heterogeneous, Ever-Changing Payer Rules and Coding Standards
Denial rates hovering around 10 - 15 % illustrate how quickly payer edits and policy updates can overturn otherwise compliant claims. Medical group leaders confirm that denials climbed further in 2024, so organizations are investing in continuous code updates and predictive scrubbers that flag likely rejections before submission. Forward-looking health systems allocate dedicated teams to mine denial root causes, and iterative feedback loops between coders and clinicians are shortening correction cycles. AI-driven rules engines that self-learn from payer remittances now deliver measurable reductions in attachment requests, cutting administrative overhead.
Other drivers and restraints analyzed in the detailed report include:
- Accelerated Digital-Health & Interoperability Mandates Worldwide
- Consumerization of Healthcare Increasing Patient Billing Complexity
- Persistent Shortage of Skilled Coding and RCM Talent
For complete list of drivers and restraints, kindly check the Table Of Contents.
Segment Analysis
Services hold 77.30% market share of the Revenue Cycle Management market size in 2025, mirroring providers' preference for turnkey expertise amid staffing shortages. Clients view outsourcing as an immediate route to improved collections because service partners assume responsibility for technology investment and continuous process refinement. Nevertheless, cloud-based software is posting a 13.65% CAGR through 2031, more than the overall market growth, because subscription pricing aligns cost with usage and removes large capital hurdles.
Hospitals that implement cloud RCM suites often discover secondary benefits, such as real-time dashboards that spotlight physician documentation gaps, enabling corrective coaching within a single shift. Over time, these analytics capabilities encourage in-house teams to transition from transactional tasks to strategic revenue integrity roles. The dual-track growth pattern implies that hybrid operating models, combining retained oversight with selective outsourcing-will become common, broadening the Revenue Cycle Management industry opportunity for both software firms and service bureaus.
On-premise deployments retain 57.90% Revenue Cycle Management market share in 2025, reflecting earlier capital purchases and residual security concerns. Yet cloud installations are expanding at a 13.65% CAGR to 2031, propelled by flexible infrastructure, automatic upgrades, and easier integration with payer APIs. Organizations that climb the HFMA technology-adoption curve frequently cite cloud moves as the inflection point when cycle-time metrics start to trend downward. One observed benefit is faster implementation of regulatory code sets, since cloud vendors push updates centrally instead of relying on client IT teams.
As cyber-security frameworks mature, board-level resistance to off-site hosting is receding, and CFOs note that predictable subscription fees simplify multi-year budgeting. This cost transparency acts as a hidden accelerant to overall Revenue Cycle Management market size growth because even mid-tier hospitals can now access features that were once reserved for large academic centers.
Complete Report Scope:
- By Component
- Software
- Integrated RCM Suite
- Standalone Modules
- Services
- Outsourced RCM BPO
- Consulting & Training
- Software
- By Deployment
- Cloud-based
- On-premise
- By Function
- Claims & Denial Management
- Medical Coding & Billing
- Electronic Health Record (Integrated RCM)
- Clinical Documentation Improvement (CDI)
- Insurance Eligibility Verification
- Other Functions (Patient Scheduling, Pricing Transparency)
- By End User
- Hospitals
- Physician Offices & Clinics
- Ambulatory Surgery Centers
- Laboratories
- Diagnostic Imaging Centers
- Other End Users
- By Specialty
- Radiology
- Oncology
- Cardiology
- Pathology
- Multi-specialty & Others
- Geography
- North America
- United States
- Canada
- Mexico
- Europe
- Germany
- United Kingdom
- France
- Italy
- Spain
- Rest of Europe
- Asia-Pacific
- China
- Japan
- India
- Australia
- South Korea
- Rest of Asia-Pacific
- Middle East and Africa
- GCC
- South Africa
- Rest of Middle East and Africa
- South America
- Brazil
- Argentina
- Rest of South America
- North America
Geography Analysis
North America commands 47.20% of the current Revenue Cycle Management market size, supported by complex multi-payer frameworks and a long history of EHR adoption. Vendor consolidation is active, evidenced by R1 RCM's USD 8.9 billion transaction, signaling private-equity conviction that scaled process expertise can deliver outsized cash-flow gains. Hospitals in the United States report that 46% already utilize some form of AI in revenue-cycle workflows. Interestingly, Canadian single-payer structures still require RCM tools for provincial reconciliation, revealing that payer complexity is not the only growth driver. The region's reimbursement transparency mandates create rich data sets, enabling vendors to refine machine-learning models faster than elsewhere, reinforcing North American leadership.
Asia-Pacific is forecast to post a 15.92% CAGR through 2031, the fastest regional pace in the Revenue Cycle Management industry, propelled by government-backed digital-health investments and swelling middle-class demand for private insurance. India's national insurance expansion is catalyzing standardized claims infrastructure, and hospitals that digitize billing early capture accelerated settlement times. China's tier-three city hospitals increasingly seek cloud RCM to leapfrog older client-server models, mirroring the smartphone adoption curve seen in other industries. Local partners remain critical for navigating regulatory approval in markets such as Japan, where data localization laws shape hosting architecture. This need for contextual adaptation presents a barrier to entry for global vendors but simultaneously offers high returns to firms that secure first-mover standing.
Europe retains meaningful Revenue Cycle Management market share, although growth is steadier because many countries operate single-payer models that centralize claim standards. Even so, GDPR requirements push hospitals toward cloud environments with strict encryption and audit trails, spurring joint ventures between U.S. and European software firms experienced in privacy engineering. In the United Kingdom, the National Health Service's renewed focus on backlog reduction has elevated interest in AI scheduling and billing triage features that resemble private-sector RCM. Meanwhile, Middle East, Africa, and South America represent emerging territories where private hospital chains drive early demand, setting a foundation for accelerated adoption once regulatory frameworks mature.
- Optum (UnitedHealth Group)
- R1 RCM
- Conifer Health Solutions
- Cognizant (Trizetto)
- athenahealth
- Oracle
- Epic Systems
- Veradigm
- Solventum
- GeBBS Healthcare
- MCKESSON Corporation
- Accenture Health
- Infosys
- Med-Metrix
- Access Healthcare
- Conduent
- eClinicalWorks
- XIFIN
- Quest Diagnostics RCM
- HCLTech Healthcare
Additional Benefits:
- The market estimate (ME) sheet in Excel format
- 3 months of analyst support
TABLE OF CONTENTS
1 Introduction
- 1.1 Study Assumptions & Market Definition
- 1.2 Scope of the Study
2 Research Methodology
3 Executive Summary
4 Market Landscape
- 4.1 Market Overview
- 4.2 Market Drivers
- 4.2.1 Global Shift Toward Value-Based & Outcome-Linked Reimbursement
- 4.2.2 Escalating Administrative Cost Pressure Prompting RCM Automation
- 4.2.3 Accelerated Digital-Health & Interoperability Mandates Worldwide
- 4.2.4 Consumerization of Healthcare Increasing Patient Billing Complexity
- 4.2.5 Proliferation of Cloud-Native Health IT Platforms & SaaS Economics
- 4.3 Market Restraints
- 4.3.1 Heterogeneous, Ever-Changing Payer Rules and Coding Standards
- 4.3.2 Persistent Shortage of Skilled Coding & RCM Talent
- 4.3.3 Data-Privacy & Cyber-security Risks Handling Protected Health Info
- 4.3.4 High Up-Front Investment and Change-Management Barriers
- 4.4 Technological Outlook
- 4.5 Porter's Five Forces
- 4.5.1 Threat of New Entrants
- 4.5.2 Bargaining Power of Buyers
- 4.5.3 Bargaining Power of Suppliers
- 4.5.4 Threat of Substitutes
- 4.5.5 Intensity of Rivalry
5 Market Size & Growth Forecasts (Value, USD)
- 5.1 By Component
- 5.1.1 Software
- 5.1.1.1 Integrated RCM Suite
- 5.1.1.2 Standalone Modules
- 5.1.2 Services
- 5.1.2.1 Outsourced RCM BPO
- 5.1.2.2 Consulting & Training
- 5.1.1 Software
- 5.2 By Deployment
- 5.2.1 Cloud-based
- 5.2.2 On-premise
- 5.3 By Function
- 5.3.1 Claims & Denial Management
- 5.3.2 Medical Coding & Billing
- 5.3.3 Electronic Health Record (Integrated RCM)
- 5.3.4 Clinical Documentation Improvement (CDI)
- 5.3.5 Insurance Eligibility Verification
- 5.3.6 Other Functions (Patient Scheduling, Pricing Transparency)
- 5.4 By End User
- 5.4.1 Hospitals
- 5.4.2 Physician Offices & Clinics
- 5.4.3 Ambulatory Surgery Centers
- 5.4.4 Laboratories
- 5.4.5 Diagnostic Imaging Centers
- 5.4.6 Other End Users
- 5.5 By Specialty
- 5.5.1 Radiology
- 5.5.2 Oncology
- 5.5.3 Cardiology
- 5.5.4 Pathology
- 5.5.5 Multi-specialty & Others
- 5.6 Geography
- 5.6.1 North America
- 5.6.1.1 United States
- 5.6.1.2 Canada
- 5.6.1.3 Mexico
- 5.6.2 Europe
- 5.6.2.1 Germany
- 5.6.2.2 United Kingdom
- 5.6.2.3 France
- 5.6.2.4 Italy
- 5.6.2.5 Spain
- 5.6.2.6 Rest of Europe
- 5.6.3 Asia-Pacific
- 5.6.3.1 China
- 5.6.3.2 Japan
- 5.6.3.3 India
- 5.6.3.4 Australia
- 5.6.3.5 South Korea
- 5.6.3.6 Rest of Asia-Pacific
- 5.6.4 Middle East and Africa
- 5.6.4.1 GCC
- 5.6.4.2 South Africa
- 5.6.4.3 Rest of Middle East and Africa
- 5.6.5 South America
- 5.6.5.1 Brazil
- 5.6.5.2 Argentina
- 5.6.5.3 Rest of South America
- 5.6.1 North America
6 Competitive Landscape
- 6.1 Market Concentration
- 6.2 Market Share Analysis
- 6.3 Company Profiles (includes Global level Overview, Market level overview, Core Business Segments, Financials, Headcount, Key Information, Market Rank, Market Share, Products and Services, and analysis of Recent Developments)
- 6.3.1 Optum (UnitedHealth Group)
- 6.3.2 R1 RCM Inc.
- 6.3.3 Conifer Health Solutions
- 6.3.4 Cognizant (Trizetto)
- 6.3.5 athenahealth
- 6.3.6 Oracle Cerner
- 6.3.7 Epic Systems
- 6.3.8 Veradigm LLC
- 6.3.9 Solventum
- 6.3.10 GeBBS Healthcare
- 6.3.11 MCKESSON Corporation
- 6.3.12 Accenture Health
- 6.3.13 Infosys Limited
- 6.3.14 Med-Metrix
- 6.3.15 Access Healthcare
- 6.3.16 Conduent
- 6.3.17 eClinicalWorks
- 6.3.18 XIFIN
- 6.3.19 Quest Diagnostics RCM
- 6.3.20 HCLTech Healthcare
7 Market Opportunities & Future Outlook
- 7.1 White-space & Unmet-Need Assessment

 全球收入週期管理市場規模、佔有率、趨勢和成長分析報告(2026-2034年)
 2026年全球醫療保健收入週期管理軟體市場報告
 收入週期管理市場:按組件、流程、部署模式、組織規模和最終用戶分類-2026-2032年全球市場預測
 收入週期管理市場:按解決方案和服務類型、部署方式、系統類型、最終用戶和地區分類:產業趨勢和全球市場預測(至 2035 年)
 收入週期管理市場:按類型、部署模式、組件、功能、最終用戶和地區分類收益管理市場(至2035年):依組件、解決方案、服務、部署模式、產業和地區劃分:產業趨勢和全球預測
 2026-2030年全球醫療保健收入週期管理(RCM)軟體市場2026年全球捆綁支付管理軟體市場報告
 收入週期管理市場分析及預測(至2035年):按類型、產品類型、服務、技術、組件、應用、最終用戶、模組、部署類型和功能分類收入週期管理市場規模、佔有率、成長及全球產業分析:按類型、應用和地區分類的洞察,2026-2034 年預測