


 |
市場調查報告書
商品編碼
2122426
鋼鐵產品:市場佔有率分析、產業趨勢與統計、成長預測(2026-2031)Finished Steel Products - Market Share Analysis, Industry Trends & Statistics, Growth Forecasts (2026 - 2031) |
||||||

※ 本網頁內容可能與最新版本有所差異。詳細情況請與我們聯繫。
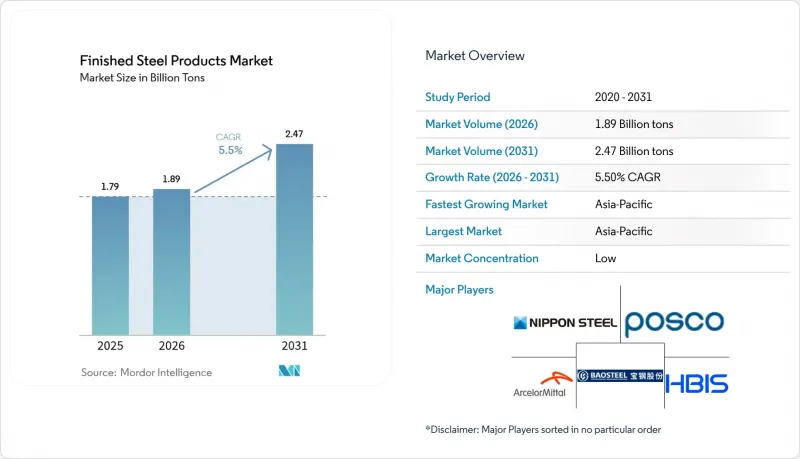
根據 Mordor Intelligence 估計,到 2026 年,鋼鐵產品市場規模將達到 18.9 億噸,高於 2025 年的 17.9 億噸,預計到 2031 年將達到 24.7 億噸。
預計從 2026 年到 2031 年,其複合年成長率將達到 5.50%。
本報告依形式(鋼板、鋼帶、鋼筋、結構鋼、鋼管、線材及其他形式)、工藝(軋延、軋延、鍛造、鑄造及其他)、最終用戶行業(建築基礎設施、交通運輸、能源、貨櫃和包裝、電氣和電子設備及其他)以及非洲地區(亞太地區、北美地區、歐洲地區、南美地區以及中東地區和非洲地區)。
全球鋼鐵產品市場趨勢及洞察
亞洲和非洲的基礎建設熱潮
亞洲每年約1.7兆美元的基礎建設需求,以及非洲每年676億至1,075億美元的基礎建設需求,正在推動結構鋼筋、型材和鋼筋需求的成長。中國的「一帶一路」舉措正為140個國家的區域性鋼鐵廠帶來大量訂單。印度的國家基礎設施計畫預計到2025年將達到1.4兆美元,將持續提升國內產能。因此,主要生產商正在專案現場附近建立下游加工基地,以縮短前置作業時間並增強鋼鐵產品市場。此外,促進本地化生產也有助於減少長途運輸產生的二氧化碳排放。
電動車的需求推動了對高抗張強度鋼(AHSS)和電工鋼板的需求。
目前,先進高抗張強度鋼(AHSS)在典型電動車車身結構中的比例高達35-40%,遠高於傳統車型的20%。隨著特斯拉200萬輛的產能以及比亞迪積極擴張產能,預計到2030年,汽車用鋼的消耗量將達到2,500萬至3,000萬噸。用於800伏特驅動馬達的取向矽鋼片的需求正以每年15-20%的速度成長,從而形成溢價。供應商正透過加快合金研發週期、擴建熱沖壓生產線以及改進塗層技術來應對這項挑戰,以保護其市場佔有率免受鋁材和複合材料等替代材料的衝擊。隨著汽車製造商從重量、安全性和成本的角度重新評估其材料平衡,這些投資正在重振成品鋼市場。
原料成本波動
2024年至2025年間,供應中斷及外匯波動,加上需求復甦不平衡,導致鐵礦石及煉焦煤價格劇烈波動。淡水河谷、力拓和必和必拓佔據了海運鐵礦石市場相當大的佔有率,停產和天氣災害會進一步加劇價格波動。歐洲不斷上漲的電價(通常是亞洲和美國的兩到三倍)削弱了當地鋼鐵廠之間的競爭。這些趨勢迫使鋼鐵生產商簽訂長期供應合約、實施避險計畫並進行垂直整合,以保護其在鋼鐵產品市場的EBITDA獲利率)。
細分市場分析
受汽車面板、家電機殼和建築覆材等需求的推動,帶材產品預計將佔據31.78%的市場佔有率,並在2025年創下最大的產量紀錄。單體式車身平台和標準化建築構件的強勁需求,使得鋼廠保持高產能運轉率。隨著對錶面品質要求的提高,帶材成品鋼材市場規模預計將保持穩定成長。儘管管材產量較小,但預計其成長率最高,到2031年複合年成長率將達到6.24%,主要得益於管道擴建、可再生能源塔架建設和暖通空調設備安裝等需求。用於汽車燃油管路和航太液壓系統的精密管材利潤率高,推動了對先進焊接和檢測系統的投資。
新興市場持續的基礎設施投資支撐了鋼板銷售,而鋼筋和線材則受益於鋼筋混凝土的需求。結構鋼和線材在工程結構和電子設備應用領域佔據了重要地位。生產商不斷最佳化生產線的柔軟性,並根據終端市場趨勢在帶鋼和管材生產之間靈活切換,從而保持其在鋼鐵產品市場的競爭力。
區域分析
預計到2025年,亞太地區將佔據全球60.88%的最大佔有率,該地區擁有龐大的國內消費和出口能力,並以6.12%的複合年成長率成長。儘管中國粗鋼產量在2024年突破10億噸,但碳定價機制的實施和產能交換限制正迫使鋼鐵廠轉向高品質精煉和綠色鋼鐵計畫。印度1.4兆美元的國家基礎設施計畫正在加速國內需求,而東南亞則受惠於電子產品和家用電器製造業的擴張。支持以氫氣為燃料的直接還原鐵(DRI)和以廢鋼為原料的電弧爐(EAF)的政策旨在平衡成長與減排目標,從而維持鋼鐵產品市場。
北美將於2025年3月起對進口鋼材徵收25%的關稅,這將促使供應鏈重組,並專注於供應鏈安全。以現代鋼鐵路易斯安那州計畫為例,電弧爐(EAF)的擴建正在利用豐富的廢鋼和廉價能源。區域性原始設備製造商(OEM)越來越重視在地採購,以降低關稅成本和地緣政治風險,從而在建築業週期性低迷的情況下支撐鋼鐵產品市場。
歐洲正面臨脫碳和進口保障措施的挑戰,其「鋼鐵行動計畫」旨在2026年將歐盟以外的鋼鐵進口量減少15%。儘管電力價格差異和碳排放稅正在擠壓利潤空間,但歐洲鋼鐵廠正透過氫燃料直接還原鐵(DRI)試點項目和循環經濟廢鋼計劃,成為低碳優質鋼鐵領域的先驅。南美洲正利用其豐富的鐵礦石蘊藏量和再生能源吸引綠色鋼鐵投資。同時,佔全球DRI產量45%的中東和非洲地區,正致力於為新興的「綠色鋼鐵走廊」提供原料,該走廊連接資源豐富的地區與歐洲和亞洲的需求中心。這些區域策略共同將增強鋼鐵產品市場的長期韌性。
其他好處
- Excel格式的市場預測(ME)表
- 3個月的分析師支持
目錄
第1章:引言
- 研究假設和市場定義
- 調查範圍
第2章:調查方法
第3章執行摘要
第4章 市場狀況
- 市場促進因素
- 亞洲和非洲的基礎建設熱潮
- 電動車的需求推動了對高抗張強度鋼(AHSS)和電工鋼板的需求。
- 擴大可再生能源設施(風力渦輪機、太陽能板)
- 由於廢鋼供應激增,電弧爐(EAF)產能正在擴大。
- 由於國防領域的重新武裝,對淬火(Q&T)裝甲板的需求增加。
- 市場限制因素
- 原料成本波動
- 交通運輸領域的輕質替代材料(鋁、碳纖維增強複合材料)
- 歐盟CBAM和綠色溢價之間的成本差異
- 中國和海灣合作理事會的結構性供應過剩
- 價值鏈分析
- 監理情勢
- 波特五力模型
第5章 市場規模與成長預測
- 按形式
- 鋼板
- 鋼帶
- 鋼筋
- 異形鋼
- 鋼管
- 線材
- 其他形式
- 透過流程
- 軋延
- 軋延
- 鍛造
- 鑄件
- 擠壓和拉伸
- 鋼材積層製造
- 按最終用戶行業分類
- 建設基礎設施
- 運輸
- 能源
- 容器和包裝
- 電氣和電子設備
- 機械/設備
- 國防與安全
- 按地區
- 亞太地區
- 中國
- 印度
- 日本
- 韓國
- ASEAN
- 澳洲和紐西蘭
- 北美洲
- 美國
- 加拿大
- 墨西哥
- 歐洲
- 德國
- 英國
- 義大利
- 法國
- 西班牙
- 俄羅斯
- 其他歐洲國家
- 南美洲
- 巴西
- 阿根廷
- 其他南美國家
- 中東和非洲
- 沙烏地阿拉伯
- 南非
- 土耳其
- 其他中東和非洲國家
- 亞太地區
第6章 競爭情勢
- 市場集中度
- 策略趨勢
- 市佔率/排名分析
- 公司簡介
- ArcelorMittal
- Baosteel Group
- BMWIL
- China Ansteel Group Corporation Limited
- Gerdau S/A
- HBIS Group
- Hyundai Steel
- JFE Steel Corporation
- Jiangsu Shagang Group
- JSW Steel Ltd
- Nippon Steel Corporation
- Nucor
- Outokumpu
- POSCO
- Shougang Group
- SSAB AB
- Steel Authority of India Limited(SAIL)
- Tata Steel
- ThyssenKrupp AG
- United States Steel
- Voestalpine AG
第7章 市場機會與未來展望
According to Mordor Intelligence, finished steel products market size in 2026 is estimated at 1.89 billion tons, growing from 2025 value of 1.79 billion tons with 2031 projections showing 2.47 billion tons, growing at 5.50% CAGR over 2026-2031.
This report is Segmented by Form (Plate, Strip, Rod and Bar, Profile, Tube, Wire, Other Forms), Process (Hot-Rolling, Cold-Rolling, Forging, Casting, and More), End-User Industry (Construction and Infrastructure, Transportation, Energy, Containers and Packaging, Electrical and Electronics, and More), and Geography (Asia-Pacific, North America, Europe, South America, Middle-East and Africa).
Global Finished Steel Products Market Trends and Insights
Infrastructure boom in Asia and Africa
Annual infrastructure needs of USD 1.7 trillion in Asia and USD 67.6-107.5 billion in Africa are expanding demand for structural bars, beams, and rebar. China's Belt and Road Initiative spans 140 countries, funneling large tonnage orders to regional mills. India's National Infrastructure Pipeline, valued at USD 1.4 trillion through 2025, continues to stimulate domestic capacity additions. Major producers are therefore establishing downstream finishing hubs nearer to project locations, shortening lead times and strengthening the finished steel products market. Intensified localization is also helping reduce CO2 emissions tied to long-haul shipping.
EV-driven demand for AHSS and electrical steels
Advanced high-strength steel (AHSS) presently constitutes 35-40% of a typical EV body, up from 20% in conventional models. Tesla's 2 million-unit capacity and BYD's aggressive scaling point toward automotive steel consumption reaching 25-30 million tons by 2030. Grain-oriented electrical steels required for 800-volt traction motors are growing 15-20% annually, fetching premium price differentials. Suppliers are responding with rapid alloy-development cycles, hot-stamping expansions, and coating upgrades to safeguard market share against aluminum and composite alternatives. These investments enhance the finished steel products market as automakers recalibrate material balances for weight, safety, and cost.
Raw-material cost volatility pressuring margins
Iron ore and coking coal prices fluctuated sharply during 2024 and 2025 as supply disruptions and currency changes intersected with uneven demand recovery. Vale, Rio Tinto, and BHP collectively control a significant share of seaborne ore, magnifying price swings during outages or weather events. Elevated power prices in Europe-often two to three times those in Asia or the United States-erode local mill competitiveness. These dynamics compel steelmakers to pursue long-term supply contracts, hedging programs, and vertical integration to shield EBITDA margins in the finished steel products market.
Other drivers and restraints analyzed in the detailed report include:
- Renewable-energy build-out driving steel intensity
- Scrap-availability surge enabling EAF capacity growth
- Lightweight substitutes challenging traditional applications
For complete list of drivers and restraints, kindly check the Table Of Contents.
Segment Analysis
Strip products generated the highest volume, capturing a 31.78% share in 2025 on the strength of automotive panels, appliance casings, and construction cladding. Robust demand from unibody vehicle platforms and standardized building components keeps mill utilization high. The finished steel products market size for strip products is forecast to maintain steady growth as surface-quality requirements rise. Tube products, although smaller in volume, are projected to achieve the fastest 6.24% CAGR through 2031, supported by pipeline expansions, renewable-energy towers, and HVAC installations. Precision tubes for automotive fuel lines and aerospace hydraulics command premium margins, encouraging investment in advanced welding and inspection systems.
Ongoing infrastructure spending in emerging markets supports heavy-section plate sales, whereas rod and bar benefit from reinforced-concrete demand. Profile and wire forms secure niche positions in engineered structures and electronic applications. Producers continue to optimize line flexibility to shift between strip and tube output as end-market signals evolve, preserving competitiveness within the finished steel products market.
Complete Report Scope:
- By Form
- Plate
- Strip
- Rod and Bar
- Profile
- Tube
- Wire
- Other Forms
- By Process
- Hot-Rolling
- Cold-Rolling
- Forging
- Casting
- Extrusion and Drawing
- Additive Manufacturing of Steel
- By End-user Industry
- Construction and Infrastructure
- Transportation
- Energy
- Containers and Packaging
- Electrical and Electronics
- Machinery and Equipment
- Defence and Security
- By Geography
- Asia-Pacific
- China
- India
- Japan
- South Korea
- ASEAN Countries
- Australia and New Zealand
- North America
- United States
- Canada
- Mexico
- Europe
- Germany
- United Kingdom
- Italy
- France
- Spain
- Russia
- Rest of Europe
- South America
- Brazil
- Argentina
- Rest of South America
- Middle-East and Africa
- Saudi Arabia
- South Africa
- Turkey
- Rest of Middle-East and Africa
- Asia-Pacific
Geography Analysis
Asia-Pacific generated the largest share at 60.88% in 2025 and is forecast to expand at a 6.12% CAGR, combining massive domestic consumption with export capability. China's crude-steel output exceeded 1 billion tons in 2024, though carbon-pricing trials and capacity-swap regulations are nudging mills toward high-quality finishing and green-steel projects. India's USD 1.4 trillion National Infrastructure Pipeline accelerates domestic demand, while Southeast Asia benefits from rising electronics and appliance manufacturing. Policy incentives for hydrogen-based direct-reduced-iron (DRI) and scrap-based EAFs aim to balance growth with emission commitments, thereby sustaining the finished steel products market.
North America is reorganizing around supply-chain security after the March 2025 imposition of 25% import tariffs. EAF expansions, such as Hyundai Steel's Louisiana project, exploit abundant scrap and inexpensive energy. Regional OEMs increasingly favor local sourcing to mitigate tariff costs and geopolitical risk, supporting the finished steel products market despite cyclical construction softness.
Europe faces decarbonization and import-safeguard challenges under its Steel Action Plan, targeting a 15% reduction in non-EU inflows by 2026. Power-price differentials and carbon taxes pressure margins, yet hydrogen-driven DRI pilots and circular-economy scrap programs are positioning European mills as early movers in low-carbon premium grades. South America leverages abundant iron-ore reserves and renewable power to court green-steel investments, while Middle East and Africa, responsible for 45% of global DRI, aim to serve emerging green-iron corridors linking resource-rich regions with demand centers in Europe and Asia. These regional strategies collectively support long-term resilience in the finished steel products market.
- ArcelorMittal
- Baosteel Group
- BMWIL
- China Ansteel Group Corporation Limited
- Gerdau S/A
- HBIS Group
- Hyundai Steel
- JFE Steel Corporation
- Jiangsu Shagang Group
- JSW Steel Ltd
- Nippon Steel Corporation
- Nucor
- Outokumpu
- POSCO
- Shougang Group
- SSAB AB
- Steel Authority of India Limited (SAIL)
- Tata Steel
- ThyssenKrupp AG
- United States Steel
- Voestalpine AG
Additional Benefits:
- The market estimate (ME) sheet in Excel format
- 3 months of analyst support
TABLE OF CONTENTS
1 Introduction
- 1.1 Study Assumptions and Market Definition
- 1.2 Scope of the Study
2 Research Methodology
3 Executive Summary
4 Market Landscape
- 4.1 Market Drivers
- 4.1.1 Infrastructure Boom in Asia and Africa
- 4.1.2 EV-driven demand for AHSS and electrical steels
- 4.1.3 Renewable-energy build-out (wind-tower, solar-frame plate)
- 4.1.4 Scrap-availability surge powering EAF capacity growth
- 4.1.5 Defence re-armament boosting Q&T armour plate
- 4.2 Market Restraints
- 4.2.1 Raw-material cost volatility
- 4.2.2 Lightweight substitutes (Al, CFRP) in transport
- 4.2.3 EU-CBAM and green-premium cost divergence
- 4.2.4 Structural over-capacity in China and GCC
- 4.3 Value Chain Analysis
- 4.4 Regulatory Landscape
- 4.5 Porter's Five Forces
- 4.5.1 Bargaining Power of Suppliers
- 4.5.2 Bargaining Power of Buyers
- 4.5.3 Threat of New Entrants
- 4.5.4 Threat of Substitutes
- 4.5.5 Degree of Competition
5 Market Size and Growth Forecasts (Volume)
- 5.1 By Form
- 5.1.1 Plate
- 5.1.2 Strip
- 5.1.3 Rod and Bar
- 5.1.4 Profile
- 5.1.5 Tube
- 5.1.6 Wire
- 5.1.7 Other Forms
- 5.2 By Process
- 5.2.1 Hot-Rolling
- 5.2.2 Cold-Rolling
- 5.2.3 Forging
- 5.2.4 Casting
- 5.2.5 Extrusion and Drawing
- 5.2.6 Additive Manufacturing of Steel
- 5.3 By End-user Industry
- 5.3.1 Construction and Infrastructure
- 5.3.2 Transportation
- 5.3.3 Energy
- 5.3.4 Containers and Packaging
- 5.3.5 Electrical and Electronics
- 5.3.6 Machinery and Equipment
- 5.3.7 Defence and Security
- 5.4 By Geography
- 5.4.1 Asia-Pacific
- 5.4.1.1 China
- 5.4.1.2 India
- 5.4.1.3 Japan
- 5.4.1.4 South Korea
- 5.4.1.5 ASEAN Countries
- 5.4.1.6 Australia and New Zealand
- 5.4.2 North America
- 5.4.2.1 United States
- 5.4.2.2 Canada
- 5.4.2.3 Mexico
- 5.4.3 Europe
- 5.4.3.1 Germany
- 5.4.3.2 United Kingdom
- 5.4.3.3 Italy
- 5.4.3.4 France
- 5.4.3.5 Spain
- 5.4.3.6 Russia
- 5.4.3.7 Rest of Europe
- 5.4.4 South America
- 5.4.4.1 Brazil
- 5.4.4.2 Argentina
- 5.4.4.3 Rest of South America
- 5.4.5 Middle-East and Africa
- 5.4.5.1 Saudi Arabia
- 5.4.5.2 South Africa
- 5.4.5.3 Turkey
- 5.4.5.4 Rest of Middle-East and Africa
- 5.4.1 Asia-Pacific
6 Competitive Landscape
- 6.1 Market Concentration
- 6.2 Strategic Moves
- 6.3 Market Share/Ranking Analysis
- 6.4 Company Profiles (includes Global level Overview, Market level overview, Core Segments, Financials as available, Strategic Information, Market Rank/Share for key companies, Products and Services, and Recent Developments)
- 6.4.1 ArcelorMittal
- 6.4.2 Baosteel Group
- 6.4.3 BMWIL
- 6.4.4 China Ansteel Group Corporation Limited
- 6.4.5 Gerdau S/A
- 6.4.6 HBIS Group
- 6.4.7 Hyundai Steel
- 6.4.8 JFE Steel Corporation
- 6.4.9 Jiangsu Shagang Group
- 6.4.10 JSW Steel Ltd
- 6.4.11 Nippon Steel Corporation
- 6.4.12 Nucor
- 6.4.13 Outokumpu
- 6.4.14 POSCO
- 6.4.15 Shougang Group
- 6.4.16 SSAB AB
- 6.4.17 Steel Authority of India Limited (SAIL)
- 6.4.18 Tata Steel
- 6.4.19 ThyssenKrupp AG
- 6.4.20 United States Steel
- 6.4.21 Voestalpine AG
7 Market Opportunities and Future Outlook
- 7.1 White-space and Unmet-need Assessment

 2026-2030年全球鋼鐵市場
 2026-2030年全球非晶質鋼市場
 壓鑄設備市場規模、佔有率和成長分析:按設備類型、製程、應用、最終用戶和地區分類 - 產業預測,2026-2033年
 粗鋼市場-2026-2032年全球市場預測
 2026年全球高磁感應強度定向矽鋼市場報告
 液壓鋼骨加工機械市場規模、佔有率和成長分析:按噸位、工作站配置、工作站類型、驅動系統、最終用途產業和地區分類-2026-2033年產業預測
 耐磨鋼板:市場佔有率分析、產業趨勢與統計、成長預測(2026-2031年)
 粗鋼市場規模、佔有率和成長分析:按製造流程、產品類型、最終用途產業和地區分類-2026-2033年產業預測
 層壓鋼板市場:依產品、終端用途產業及地區分類耐磨鋼板:市場佔有率分析、產業趨勢與統計、成長預測(2026-2031年)