


 |
市場調查報告書
商品編碼
2122418
託管型 MPLS:市場佔有率分析、產業趨勢與統計資料、成長預測(2026-2031 年)Managed MPLS - Market Share Analysis, Industry Trends & Statistics, Growth Forecasts (2026 - 2031) |
||||||

※ 本網頁內容可能與最新版本有所差異。詳細情況請與我們聯繫。
根據 Mordor Intelligence 預測,託管 MPLS 市場規模將從 2025 年的 185.6 億美元成長到 2026 年的 195.5 億美元,然後在 2031 年達到 253.7 億美元,2026 年至 2031 年的複合年成長率為 5.34%。
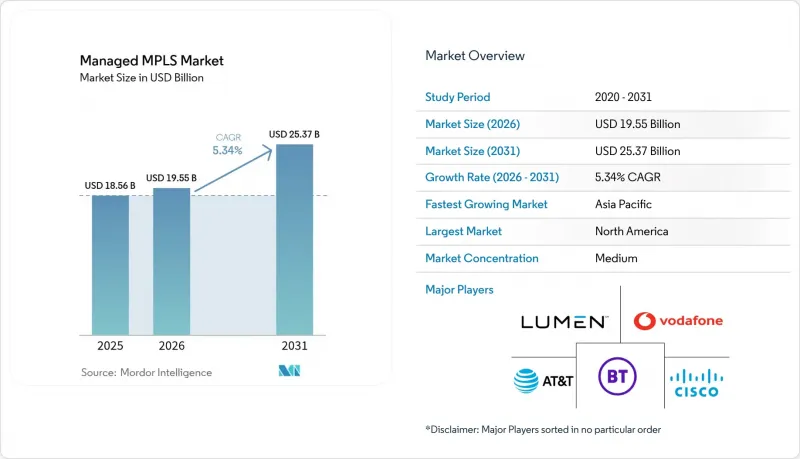
本報告按服務類型(二級 VPN 和三級 VPN)、最終用戶行業(醫療保健、銀行、金融服務和保險 (BFSI)、零售、製造業、政府、IT 和電信等)、組織規模(中小企業 (SME) 和大型企業)、部署類型(本地部署和雲端部署)以及地區(北美、歐洲、亞太地區等)進行細分。市場預測以美元 (USD) 為單位。
全球託管 MPLS 市場趨勢與洞察
行動回程網路擴展
行動電信商正在將光纖延伸至行動通訊基地台,以傳輸中頻寬和毫米波5G流量,企業級MPLS線路也正沿著同一路徑聚合。 AT&T報告稱,到2024年,其光纖網路將覆蓋超過2700萬個地點,這將降低新建託管MPLS端口的額外成本。中國行動和Bharti Airtel也正在效仿,將MPLS整合到其國內基礎設施中,以確保其收入免受SD-WAN替代方案的影響。由此帶來的使用量成長正在推動價格下降,同時又不降低嚴格的服務水平,使得MPLS更容易被以前依賴微波或盡力而為而為型寬頻的分店所接受。
雲端企業應用的廣泛應用
與網際網路 VPN 隧道相比,MPLS 核心網路與超大規模資料中心業者的直接互連可將往返延遲降低 20-40 毫秒。這一差異確保了支付處理和醫療影像領域的交易完整性。 Verizon 的「私有 IP」服務現已相容於 AWS Direct Connect 和 Azure ExpressRoute,使虛擬網路能夠維護端對端的私有位址空間。隨著美國主要都會大都會圈光纖滲透率超過 85%,這些接入點即使對於中型企業也變得切實可行,託管 MPLS 市場的需求也正從簡單的分店和資料中心連接轉向與雲端的鄰近連接。
MPLS服務總擁有成本高
在北美,MPLS的月費仍高達每兆位元300至800美元,是同類寬頻服務價格的四到六倍,給小規模企業的預算帶來了沉重負擔。儘管營運商試圖透過降低服務等級來降低價格,但代價是犧牲了低於10毫秒的延遲,這種做法可能會削弱維持高價位的關鍵差異化因素。雖然亞洲地區的競爭縮小了價格差距,但MPLS價格昂貴的固有印象仍然根深蒂固,阻礙了對成本敏感的行業採用這項服務。
細分市場分析
到2025年,三級VPN將維持57.48%的託管MPLS市場佔有率。這主要得益於銀行和保險業對可擴展的「任意到任意」IP路由的需求。此細分市場支援路由匯總和流量分段,為網路架構師提供了一個熟悉的環境。隨著雲端原生企業無需重新定址或重新路由即可跨區域擴展虛擬區域網,二級VPN正以5.92%的複合年成長率成長。
德國電信的乙太網路 VPN 使客戶能夠在本地叢集和公共雲端區域之間即時遷移虛擬機,實現零停機時間。城域乙太網路論壇 (MEF) CE 3.0 基準測試承諾提供低於 50 毫秒的故障轉移保護,這與基於 IP 的恢復時間相當甚至更優,從而推動了該技術的普及。儘管這些趨勢支援二級託管 MPLS 服務市場相對於成熟的三級線路實現更快成長,但由於 IP VPN 擁有更廣泛的現有部署基礎,其絕對收入仍佔據主導地位。
到2025年,銀行、金融服務和保險業將佔總收入的31.68%,它們將利用MPLS技術來保障支付基礎設施和交易平台的安全。同時,隨著連鎖店即時整合POS終端、路邊取貨系統和倉庫庫存,全通路零售業正以7.29%的複合年成長率成長。沃爾瑪的私有骨幹網路透過營運商級MPLS技術連接了遍布美國各地的4,600多家門市,從而避免了尖峰時段的服務中斷。
醫療服務提供者也傾向於使用 MPLS 來傳輸符合 HIPAA 標準的影像資料和電子健康記錄,而製造商則將 MPLS 與工業乙太網整合,用於機器人控制。這些行業特定的趨勢表明,託管 MPLS 市場仍然多元化,但零售業的快速成長可能會推動增量收入向分店網路轉移,這些網路優先考慮抖動保證而非淨吞吐量。政府機構、資訊科技 (IT) 公司、電信公司和其他終端用戶產業共同構成了剩餘的市場佔有率,它們的採用模式受到資料主權法規和預算週期的影響,而預算週期往往傾向於簽訂多年期採購合約。
區域分析
預計到2025年,北美將佔全球收入的35.22%,這主要得益於其高密度光纖網路和眾多財富500強企業總部的集中分佈。 AT&T和Verizon已將其核心線路升級至Gigabit容量,從而能夠透過專用MPLS線路實現4K協作和即時分析。然而,遍遠地區仍然存在差距,導致“市場兩極化”,郊區分店面臨更長的前置作業時間和更高的線路成本。加拿大批發監管法規的修訂加劇了競爭,可能在中期內削弱託管MPLS市場的定價能力。墨西哥光纖網路的擴張透過為新工廠和美國總部之間提供確定性連接,為近岸外包提供了支援。
亞太地區是成長最快的地區,預計到2031年複合年成長率將達到7.61%。中國電信的CN2網路透過延遲最佳化的MPLS路由連接了200多個國家,為向全球各地出貨的工廠提供支援。印度的「國家寬頻計畫」已將光纖網路覆蓋到25萬個村委會,而Bharti Airtel已成功將MPLS服務擴展到二線城市。日本、韓國和澳洲的電信業者也正在利用國內光纖網路,瞄準製造業中心的工業IoT叢集。基礎設施和產業政策的結合,正推動全部區域託管MPLS市場保持強勁的成長動能。
在歐洲、中東和非洲,有關資料主權和跨國需求的法規錯綜複雜地交織在一起。歐盟的《數位市場法案》呼籲實現互通性,鼓勵英國電信(BT)和Orange等電信業者將MPLS與SD-WAN和雲端互連整合到統一的入口網站下。由中東主權基金資助的海底光纜正在改善非洲礦山和歐洲交易平台之間的延遲,而南非的光纖網路覆蓋了約翰尼斯堡和開普敦70%的企業。儘管在大都會圈以外的地區部署速度緩慢,但監管部門推動的經濟多元化正在支撐海灣地區(石油資源匱乏)和內陸地區(礦產資源豐富)對託管MPLS的需求。
其他好處:
- Excel格式的市場預測(ME)表
- 3個月的分析師支持
目錄
第1章:引言
- 研究假設和市場定義
- 調查範圍
第2章:調查方法
第3章執行摘要
第4章 市場狀況
- 市場概覽
- 市場促進因素
- 行動回程網路擴展
- 擴大基於雲端的企業應用程式的採用
- 針對關鍵業務流量的混合 SD-WAN 和 MPLS 部署
- 物聯網設備的快速普及需要低延遲通訊線路。
- 將工業運作轉移到遠端地點並實現安全的託管 MPLS 連接。
- 私有5G回程傳輸與MPLS核心網路的整合
- 市場限制因素
- MPLS服務總擁有成本高
- 企業向基於網際網路的 VPN 和純 SD-WAN 遷移
- 新興市場缺乏熟練的MPLS工程師
- 長期合約限制了網路柔軟性。
- 產業價值/價值鏈分析
- 宏觀經濟因素對市場的影響
- 監理情勢
- 技術展望
- 波特五力分析
第5章 市場規模與成長預測
- 按服務
- 二級 VPN
- 三級 VPN
- 按最終用戶行業分類
- 衛生保健
- 銀行、金融服務和保險(BFSI)
- 零售
- 製造業
- 政府
- 資訊科技和通訊
- 其他終端用戶產業
- 按組織規模
- 中小企業
- 大公司
- 部署模式
- 現場
- 雲
- 按地區
- 北美洲
- 美國
- 加拿大
- 墨西哥
- 南美洲
- 巴西
- 阿根廷
- 智利
- 其他南美國家
- 歐洲
- 英國
- 德國
- 法國
- 義大利
- 西班牙
- 其他歐洲國家
- 亞太地區
- 中國
- 日本
- 印度
- 韓國
- 澳洲和紐西蘭
- 其他亞太國家
- 中東和非洲
- 中東
- 阿拉伯聯合大公國
- 沙烏地阿拉伯
- 土耳其
- 其他中東國家
- 非洲
- 南非
- 肯亞
- 奈及利亞
- 其他非洲國家
- 中東
- 北美洲
第6章 競爭情勢
- 市場集中度
- 策略趨勢
- 市佔率分析
- 公司簡介
- AT&T Inc.
- BT Group plc
- Cisco Systems Inc.
- Lumen Technologies Inc.
- Vodafone Group plc
- T-Mobile US Inc.
- NTT Ltd.
- Orange SA
- Verizon Communications Inc.
- Tata Communications Ltd.
- China Telecom Corporation Ltd.
- Telstra Corporation Ltd.
- Telefonica SA
- Deutsche Telekom AG
- Comcast Corporation
- Colt Technology Services Group Ltd.
- GTT Communications Inc.
- PCCW Global Ltd.
- Singtel Optus Pty Ltd.
第7章 市場機會與未來展望
According to Mordor Intelligence, the managed MPLS market size is expected to grow from USD 18.56 billion in 2025 to USD 19.55 billion in 2026 and is forecast to reach USD 25.37 billion by 2031 at 5.34% CAGR over 2026-2031.
This report is Segmented by Service (Level 2 VPN, and Level 3 VPN), End-User Vertical (Healthcare, BFSI, Retail, Manufacturing, Government, IT and Telecom, and More), Organization Size (Small and Medium Enterprises (SMEs), and Large Enterprises), Deployment Mode (On-Premises, and Cloud), and Geography (North America, Europe, Asia-Pacific, and More). The Market Forecasts are Provided in Terms of Value (USD).
Global Managed MPLS Market Trends and Insights
Expansion of Mobile Backhaul Networks
Mobile operators are extending fiber to cell sites to carry mid-band and millimeter-wave 5G traffic, and the same routes aggregate enterprise MPLS circuits. AT&T reported fiber reach to more than 27 million premises in 2024, lowering incremental costs to light new managed MPLS ports. China Mobile and Bharti Airtel are following suit, embedding MPLS in national infrastructure so revenue is protected from SD-WAN substitution. The resulting volume stimulates price moderation without diluting service-level rigor, making MPLS more accessible to branch locations that previously relied on microwave or best-effort broadband.
Rising Adoption of Cloud-Based Enterprise Applications
Direct interconnects from MPLS cores into hyperscaler regions shrink round-trip latency by 20-40 milliseconds compared with internet VPN tunnels, a gap that preserves transaction integrity for payment processing and healthcare imaging. Verizon's Private IP service now plugs into AWS Direct Connect and Azure ExpressRoute, enabling virtual networks to remain on private address space end-to-end. Fiber availability above 85% across U.S. metro areas makes these on-ramps practical for the mid-market, turning managed MPLS market demand toward cloud adjacency rather than branch-to-data-center alone.
High Total Cost of Ownership for MPLS Services
Monthly rates still range from USD 300 to USD 800 per megabit in North America, four to six times broadband equivalents, straining budgets for smaller organizations. Carriers are experimenting with relaxed service tiers that trade sub-10 millisecond latency for lower fees, but this move risks eroding the very differentiation that sustains premium pricing. Regional price competition in Asia has eased the gap, yet the perception of MPLS as expensive persists, tempering uptake in cost-sensitive verticals.
Other drivers and restraints analyzed in the detailed report include:
- Hybrid SD-WAN and MPLS Deployments for Mission-Critical Traffic
- Rapid Proliferation of Internet of Things Devices Requiring Low-Latency Links
- Enterprise Migration Toward Internet VPN and Pure SD-WAN
For complete list of drivers and restraints, kindly check the Table Of Contents.
Segment Analysis
Level 3 VPN retained 57.48% of the managed MPLS market share in 2025, anchored in banking and insurance networks that need scalable any-to-any IP routing. The segment supports route summarization and traffic segmentation, providing operational familiarity to network architects. Level 2 VPN is advancing at a 5.92% CAGR as cloud-native firms stretch virtual LANs across regions without re-addressing or re-routing.
Deutsche Telekom's Ethernet VPN lets customers migrate virtual machines live between on-premises clusters and public-cloud zones without downtime. The Metro Ethernet Forum's CE 3.0 benchmarks promise sub-50 millisecond protection switching, matching or surpassing IP-based recovery times and encouraging adoption. These trends confirm that the managed MPLS market size for Level 2 services will expand faster than for entrenched Level 3 circuits, although absolute revenue remains skewed to IP-based VPNs because of their extensive embedded base.
Banking, financial services, and insurance controlled 31.68% of revenue in 2025, leveraging MPLS to secure payment rails and trading platforms. However, omnichannel retail is growing at 7.29% CAGR as chains link point-of-sale devices, curbside pickup systems, and warehouse inventory in real time. Walmart's private backbone connects more than 4,600 U.S. locations through carrier-grade MPLS to prevent outages during seasonal peaks.
Healthcare providers also favor MPLS for HIPAA-compliant transport of imaging and electronic records, and manufacturers tie it to industrial ethernet for robotic control. These vertical dynamics show that the managed MPLS market remains diversified, but retail's surge will tilt incremental revenue toward branch-heavy networks that value jitter guarantees over raw throughput. Government agencies, information technology, and telecommunications firms, along with other end-user verticals, collectively represent the remainder of the market, with adoption patterns shaped by data-sovereignty regulations and budget cycles that favor multi-year procurement contracts.
Complete Report Scope:
- By Service
- Level 2 VPN
- Level 3 VPN
- By End-user Vertical
- Healthcare
- Banking, Financial Services and Insurance (BFSI)
- Retail
- Manufacturing
- Government
- Information Technology and Telecommunication
- Other End-user Verticals
- By Organization Size
- Small and Medium Enterprises (SMEs)
- Large Enterprises
- By Deployment Mode
- On-Premises
- Cloud
- By Geography
- North America
- United States
- Canada
- Mexico
- South America
- Brazil
- Argentina
- Chile
- Rest of South America
- Europe
- United Kingdom
- Germany
- France
- Italy
- Spain
- Rest of Europe
- Asia-Pacific
- China
- Japan
- India
- South Korea
- Australia and New Zealand
- Rest of Asia-Pacific
- Middle East and Africa
- Middle East
- United Arab Emirates
- Saudi Arabia
- Turkey
- Rest of Middle East
- Africa
- South Africa
- Kenya
- Nigeria
- Rest of Africa
- Middle East
- North America
Geography Analysis
North America generated 35.22% of 2025 revenue, driven by dense fiber footprints and a high concentration of Fortune 500 headquarters. AT&T and Verizon upgraded core routes to 400-gigabit capacities, enabling 4K collaboration and real-time analytics over dedicated MPLS paths. Rural gaps persist, however, creating a two-speed market where branch offices in exurban areas face longer lead times and higher circuit costs. Canada's updated wholesale rules are widening competition, which may temper pricing power in the managed MPLS market over the medium term. Mexico's fiber expansion supports nearshoring by furnishing deterministic links between new factories and U.S. headquarters.
Asia-Pacific is the fastest-growing region at 7.61% CAGR through 2031. China Telecom's CN2 connects more than 200 countries with latency-optimized MPLS routes, supporting factories that ship globally. India's National Broadband Mission delivered fiber to 250,000 village councils, letting Bharti Airtel extend MPLS into tier-2 cities. Japanese, South Korean, and Australian carriers similarly capitalize on domestic fiber diets to target industrial IoT clusters in manufacturing corridors. This combination of infrastructure and industrial policy keeps the managed MPLS market momentum high across the region.
Europe, Middle East, and Africa present a mosaic of data-sovereignty mandates and cross-border needs. The EU Digital Markets Act demands interoperability, prompting carriers such as BT and Orange to integrate MPLS with SD-WAN and cloud interconnection under unified portals. Subsea cables financed by Middle East sovereign funds improve latency between African mining sites and European trading desks, while South African fiber reaches 70% of businesses in Johannesburg and Cape Town. Adoption outside metros lags, yet regulatory pushes for diversified economies support managed MPLS market demand in oil-free Gulf states and mineral-rich inland provinces.
- AT&T Inc.
- BT Group plc
- Cisco Systems Inc.
- Lumen Technologies Inc.
- Vodafone Group plc
- T-Mobile US Inc.
- NTT Ltd.
- Orange S.A.
- Verizon Communications Inc.
- Tata Communications Ltd.
- China Telecom Corporation Ltd.
- Telstra Corporation Ltd.
- Telefonica S.A.
- Deutsche Telekom AG
- Comcast Corporation
- Colt Technology Services Group Ltd.
- GTT Communications Inc.
- PCCW Global Ltd.
- Singtel Optus Pty Ltd.
Additional Benefits:
- The market estimate (ME) sheet in Excel format
- 3 months of analyst support
TABLE OF CONTENTS
1 INTRODUCTION
- 1.1 Study Assumptions and Market Definition
- 1.2 Scope of the Study
2 RESEARCH METHODOLOGY
3 EXECUTIVE SUMMARY
4 MARKET LANDSCAPE
- 4.1 Market Overview
- 4.2 Market Drivers
- 4.2.1 Expansion of Mobile Backhaul Networks
- 4.2.2 Rising Adoption of Cloud-Based Enterprise Applications
- 4.2.3 Hybrid SD-WAN and MPLS Deployments for Mission-Critical Traffic
- 4.2.4 Rapid Proliferation of Internet of Things Devices Requiring Low-Latency Links
- 4.2.5 Shift of Remote Industrial Operations to Secure Managed MPLS Connectivity
- 4.2.6 Integration of Private 5G Backhaul with MPLS Core Networks
- 4.3 Market Restraints
- 4.3.1 High Total Cost of Ownership for MPLS Services
- 4.3.2 Enterprise Migration Toward Internet-Based VPN and Pure SD-WAN
- 4.3.3 Limited Availability of Skilled MPLS Engineers in Emerging Markets
- 4.3.4 Long-Term Contract Lock-Ins Restricting Network Flexibility
- 4.4 Industry Value / Supply-Chain Analysis
- 4.5 Impact of Macroeconomic Factors on the Market
- 4.6 Regulatory Landscape
- 4.7 Technological Outlook
- 4.8 Porter's Five Forces Analysis
- 4.8.1 Bargaining Power of Suppliers
- 4.8.2 Bargaining Power of Buyers/Consumers
- 4.8.3 Threat of New Entrants
- 4.8.4 Threat of Substitute Products
- 4.8.5 Intensity of Competitive Rivalry
5 MARKET SIZE AND GROWTH FORECASTS (VALUE)
- 5.1 By Service
- 5.1.1 Level 2 VPN
- 5.1.2 Level 3 VPN
- 5.2 By End-user Vertical
- 5.2.1 Healthcare
- 5.2.2 Banking, Financial Services and Insurance (BFSI)
- 5.2.3 Retail
- 5.2.4 Manufacturing
- 5.2.5 Government
- 5.2.6 Information Technology and Telecommunication
- 5.2.7 Other End-user Verticals
- 5.3 By Organization Size
- 5.3.1 Small and Medium Enterprises (SMEs)
- 5.3.2 Large Enterprises
- 5.4 By Deployment Mode
- 5.4.1 On-Premises
- 5.4.2 Cloud
- 5.5 By Geography
- 5.5.1 North America
- 5.5.1.1 United States
- 5.5.1.2 Canada
- 5.5.1.3 Mexico
- 5.5.2 South America
- 5.5.2.1 Brazil
- 5.5.2.2 Argentina
- 5.5.2.3 Chile
- 5.5.2.4 Rest of South America
- 5.5.3 Europe
- 5.5.3.1 United Kingdom
- 5.5.3.2 Germany
- 5.5.3.3 France
- 5.5.3.4 Italy
- 5.5.3.5 Spain
- 5.5.3.6 Rest of Europe
- 5.5.4 Asia-Pacific
- 5.5.4.1 China
- 5.5.4.2 Japan
- 5.5.4.3 India
- 5.5.4.4 South Korea
- 5.5.4.5 Australia and New Zealand
- 5.5.4.6 Rest of Asia-Pacific
- 5.5.5 Middle East and Africa
- 5.5.5.1 Middle East
- 5.5.5.1.1 United Arab Emirates
- 5.5.5.1.2 Saudi Arabia
- 5.5.5.1.3 Turkey
- 5.5.5.1.4 Rest of Middle East
- 5.5.5.2 Africa
- 5.5.5.2.1 South Africa
- 5.5.5.2.2 Kenya
- 5.5.5.2.3 Nigeria
- 5.5.5.2.4 Rest of Africa
- 5.5.5.1 Middle East
- 5.5.1 North America
6 COMPETITIVE LANDSCAPE
- 6.1 Market Concentration
- 6.2 Strategic Moves
- 6.3 Market Share Analysis
- 6.4 Company Profiles (includes Global-level Overview, Market-level Overview, Core Segments, Financials as available, Strategic Information, Market Rank / Share for key companies, Products and Services, and Recent Developments)
- 6.4.1 AT&T Inc.
- 6.4.2 BT Group plc
- 6.4.3 Cisco Systems Inc.
- 6.4.4 Lumen Technologies Inc.
- 6.4.5 Vodafone Group plc
- 6.4.6 T-Mobile US Inc.
- 6.4.7 NTT Ltd.
- 6.4.8 Orange S.A.
- 6.4.9 Verizon Communications Inc.
- 6.4.10 Tata Communications Ltd.
- 6.4.11 China Telecom Corporation Ltd.
- 6.4.12 Telstra Corporation Ltd.
- 6.4.13 Telefonica S.A.
- 6.4.14 Deutsche Telekom AG
- 6.4.15 Comcast Corporation
- 6.4.16 Colt Technology Services Group Ltd.
- 6.4.17 GTT Communications Inc.
- 6.4.18 PCCW Global Ltd.
- 6.4.19 Singtel Optus Pty Ltd.
7 MARKET OPPORTUNITIES AND FUTURE OUTLOOK
- 7.1 White-space and Unmet-Need Assessment

 高速介面控制器晶片市場:全球市場預測,2026-2032年
 2026-2030年全球高頻寬記憶體IP市場
 介面IP市場:依連接方式、通訊速度、介面類型、應用和地區分類記憶體介面晶片市場:依產品、記憶體技術、應用和地區分類
 類比和混合訊號IP:市場佔有率分析、行業趨勢和統計數據、成長預測(2026-2031年)
 類比和混合訊號IP市場規模、佔有率和成長分析:按IP類型、功能類型、應用、整合類型、最終用戶、技術節點和地區分類-2026-2033年產業預測DRAM IP 控制器:市場佔有率分析、行業趨勢和統計數據、成長預測(2026-2031 年)
 汽車通訊協定市場規模、佔有率和成長分析:按協議技術、功能、車輛驅動系統和地區分類-2026-2033年產業預測DRAM記憶體介面IP:市場佔有率分析、產業趨勢與統計、成長預測(2026-2031年)
 2026年全球託管多重協定標籤交換(MPLS)市場報告