


 |
市場調查報告書
商品編碼
2122274
海底光纜:市場佔有率分析、產業趨勢與統計及成長預測(2026-2031)Submarine Optical Fiber Cable - Market Share Analysis, Industry Trends & Statistics, Growth Forecasts (2026 - 2031) |
||||||

※ 本網頁內容可能與最新版本有所差異。詳細情況請與我們聯繫。
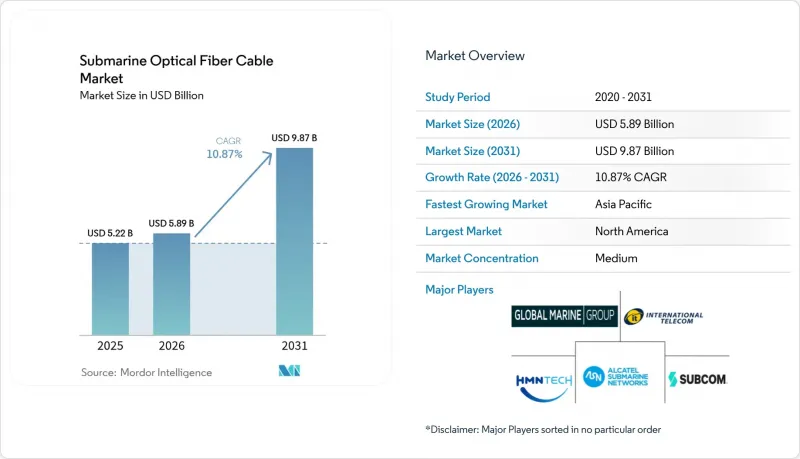
根據 Mordor Intelligence 預測,海底光纜市場規模預計將在 2025 年達到 52.2 億美元,2026 年達到 58.9 億美元,到 2031 年達到 98.7 億美元,2026 年至 2031 年的複合年成長率為 10.87%。
本報告按組件(濕式設備、乾式設備、其他)、光纜類型(單模光纖、多模光纖、其他)、用戶端類型(電信業者、內容/超大規模雲端供應商、其他)、容量設計(16 Tbps 以下的系統、16 至 60 Tbps 之間的系統、其他)和地區進行細分。市場預測以美元 (USD) 為單位。
全球海底光纜市場趨勢及洞察
超大規模雲端和OTT對專用電纜的投資
目前,大多數新建的跨大西洋光纖網路系統都是由內容平台訂購。 Meta公司的「2Africa」和「Waterworth」專案總合長度超過9萬公里,並擁有端到端的所有權,無需進行頻寬租賃談判。谷歌計劃於2025年運作連接新加坡和馬爾地夫的「Dhivaru」鏈路,以確保人工智慧模型訓練的低延遲複製。亞馬遜已獲得愛爾蘭的登陸權,計劃於2027年運作一條100Tbit/s的跨大西洋光纖線路。這些發展促使數十億美元的直接投資流入光纖製造商,並重塑了供應商之間的權力模式。作為回應,電信集團正在將自身定位從端到端所有者轉變為批發供應商。
電信業者快速升級至 400GbE 和 800GbE
連貫插入式光學模組使電信業者能夠在現有光纜上將每個波長的吞吐量提高四倍。阿曼電信 (Omantel) 透過使用 Ciena 的 WaveLogic 6 將每個通道的傳輸速率提升至 800 Gbps,證明了其在 2025 年的經濟可行性,並將一項耗資 2 億美元的佈線項目至少推遲了五年。 Altibox 已檢驗了1.6 Tbit/s 的單波長測試,顯示預計在 2028 年前實現商業部署。隨著 2025 年 60% 的競標採用 ITU-T G.654.E 低衰減光纖,傳輸距離將進一步延長,放大器的數量和運行功率預算也將減少。
船舶維護和修理成本高昂
深海維修成本通常在100萬美元到300萬美元之間。這些成本受船舶租賃費率波動的影響,租金從每天10萬美元到30萬美元不等,而且天氣狀況好轉的持續時間也可能長達數週,難以預測。由於全球僅有60艘專用維修船,該產業面臨嚴重的瓶頸,尤其是在多艘船舶同時發生故障的情況下。 2025年,保險公司針對這些挑戰採取了應對措施,將高風險航線的保費提高了高達30%。鑑於成本不斷上漲和潛在的運作,營運商開始提前預訂備用合約。雖然這種策略會使專案預算增加5%到8%,但它能顯著降低長時間運作的風險。
細分市場分析
預計到2025年,海底光纜市場的濕式設備市場規模將達26.7億美元,佔總營收的51.32%。這是因為中繼器和分支單元仍然是最大的成本因素。然而,隨著易發生糾紛線路的業者購買全天候維修服務和海底線路審計服務,輔助服務和海上服務正以每年11.69%的速度成長。這種向以服務為中心的模式轉變正在增加經常性收入,並保護供應商免受承包硬體合約帶來的收入波動的影響。
陸上基礎設施,特別是光纖終端和監控平台,正面臨商品化壓力,因為超大規模資料中心業者需要採用開放式架構,將傳輸電子設備與濕式設備供應商分開。一些規模較小的細分市場正在湧現,例如分散式聲學感測設備 (DAS),該設備利用光纖本身作為振動感測器。英國國家電網公司 (National Grid) 於 2024 年部署了該設備,結果顯示離岸風力發電專案的渦輪機停機時間減少了小規模%。在整體組件方面,供應商正在向混合電力數據電纜領域多元化發展,以開發預計到 2030 年將達到 5 億美元的相關市場。
儘管單模光纖在2025年的銷售額佔比仍高達66.32%,但多芯和空分複用(SDM)光纖的成長率最高,達11.43%。這主要得益於NEC公司22芯光纖概念驗證實驗的成功,該實驗在單根光纖對上實現了680 Tbit/s的傳輸速率。目前,這些光纖的初始部署仍局限於資料中心,但預計到2027年,每個連接點的連接成本將降至1萬美元以下,這將推動長距離光纖的廣泛部署。 ITU-T G.654.E的低衰減規範是大多數新競標文件的基礎,與傳統的G.652.D相比,該規範可將放大器間距增加到400公里,並將中繼器數量減少40%。
儘管多模光纖仍用於10公里或更短距離的近海平台間連接,但隨著單模光纖價格的下降,其市佔率持續萎縮。供應商正專注於中空芯光纖的研發,這種光纖有望實現低延遲傳輸,如果生產良率穩定,未來十年內有望與空芯光纖形成互補。
區域分析
預計到2025年,亞太地區將引領海底光纜市場,佔33.21%的銷售額。這主要得益於SEA-ME-WE-6海底光纜在孟買的登陸以及日本耗資3億美元的JUNO海底光纜項目,該項目將為東京的企業提供災害復原鏈路。中國製造商依然活躍,但在澳洲和美國面臨政治阻力,為了遵守國家安全審查要求,不得不將業務轉移至新加坡和香港。
預計到2031年,非洲將以11.83%的複合年成長率實現最快成長。 Meta公司的「2Africa」系統目前在33個登陸點擁有180 Tbit/s的容量,覆蓋整個非洲大陸,並在奈及利亞、肯亞和南非實現了兩位數的批發Mbps價格下降。這些價格的降低促進了本地資料中心的建置和雲端存取點的採用,而這些在衛星通訊的Terabit限制下是無法實現的。
在北美,隨著2000年代初鋪設的電纜逐漸達到使用壽命終點併升級至800GbE波長,升級需求持續成長。在歐洲,英國脫歐擾亂了英吉利海峽登陸點的許可製度,延長了授權流程。此外,歐盟嚴格的環境評估要求地中海路線的核准時間額外增加12至18個月。在南美洲,正在建造替代走廊,例如通過巴西-葡萄牙之間的Seabras-2線路,以減少對邁阿密瓶頸線路的依賴,並降低單點故障風險。中東地區的流量仍然高度依賴過境傳輸,電信業者目前正在部署紅海保護迴路作為故障緩衝,保險公司對途經蘇伊士海峽的線路收取更高的保費。預計一旦遠北光纖公司14,000公里的網路在2026年下半年投入運作,新興的跨極地線路將使亞洲和歐洲之間的延遲降低30%。
其他好處
- Excel格式的市場預測(ME)表
- 3個月的分析師支持
目錄
第1章:引言
- 研究假設和市場定義
- 調查範圍
第2章:調查方法
第3章執行摘要
第4章 市場狀況
- 市場概覽
- 市場促進因素
- 智慧型手機普及率提高,頻寬。
- 新興地區光纖連接的擴展
- 電信業者快速升級至 400GbE 和 800GbE
- 超大規模雲端和OTT對專用電纜的投資
- 努力實現低延遲跨極航線
- 採用混合電力資料電纜的離岸風力發電發電廠
- 市場限制因素
- 船舶維護和修理成本高昂
- 擴大低地球衛星星系的投資
- 由於地緣政治因素,海底電纜鋪設許可核准延誤。
- 淺水區光纖電纜被盜和破壞
- 產業價值鏈分析
- 監理情勢
- 技術展望
- 波特五力模型
- 宏觀經濟因素對市場的影響
- 投資分析
- 海底電纜專案資料庫
第5章 市場規模與成長預測
- 按組件
- 濕式設備
- 乾式設備
- 補助和海洋相關服務
- 其他
- 按電纜類型
- 單模光纖
- 多模光纖
- SDM多芯光纖
- 依客戶類型
- 電信營運商
- 內容超大規模雲端供應商
- 政府和研究網路
- 海洋能源企業
- 其他客戶類型
- 按產能設計
- 頻寬為 16 Tbps 或以下的系統
- 16-60 Tbps 系統
- 超過 60 Tbps 的系統
- 按地區
- 北美洲
- 美國
- 加拿大
- 南美洲
- 巴西
- 阿根廷
- 其他南美國家
- 歐洲
- 德國
- 法國
- 英國
- 其他歐洲國家
- 亞太地區
- 中國
- 印度
- 日本
- 澳洲
- 其他亞太國家
- 中東
- 沙烏地阿拉伯
- 阿拉伯聯合大公國
- 土耳其
- 其他中東國家
- 非洲
- 南非
- 埃及
- 奈及利亞
- 其他非洲地區
- 北美洲
第6章 競爭情勢
- 市場集中度
- 策略趨勢
- 市佔率分析
- 公司簡介
- Alcatel Submarine Networks Ltd.
- HMN Technologies Co., Ltd.
- Nexans SA
- SubCom, LLC
- Fujitsu Ltd.
- Global Marine Group Ltd.
- IT International Telecom Inc.
- Orange Marine SAS
- Sumitomo Electric Industries Ltd.
- LS Cable and System Ltd.
- Jiangsu Hengtong Marine Cable Systems Co., Ltd.
- SB Submarine Systems Co., Ltd.
- PT Communication Cable Systems Indonesia Tbk
- NTT Communications Corporation
- Verizon Communications Inc.
- Telstra Group Limited
- China Unicom Global Limited
- Telekom Malaysia Berhad
- Oman Telecommunications Company SAOG(Omantel)
- Meta Platforms, Inc.
- Amazon.com, Inc.
- Google LLC
第7章 市場機會與未來展望
According to Mordor Intelligence, the submarine optical fiber cable market size is projected to be USD 5.22 billion in 2025, USD 5.89 billion in 2026, and reach USD 9.87 billion by 2031, growing at a CAGR of 10.87% from 2026 to 2031.
This report is Segmented by Component (Wet-Plant Equipment, Dry-Plant Equipment, and More), Cable Type (Single-Mode Fiber, Multimode Fiber, and More), Client Type (Telecom Operators, Content and Hyperscale Cloud Providers, and More), Capacity Design (less Than or Equal To 16 Tbps Systems, 16-60 Tbps Systems, and More), and Geography. The Market Forecasts are Provided in Terms of Value (USD).
Global Submarine Optical Fiber Cable Market Trends and Insights
Hyperscale Cloud and OTT Investment in Private Cables
Content platforms now commission the majority of new trans-oceanic systems. Meta's 2Africa and Waterworth programs together exceed 90,000 km of route length and secure end-to-end ownership, eliminating bandwidth-lease negotiations. Google activated the Dhivaru link between Singapore and the Maldives in 2025 to ensure low-latency replication for AI model training. Amazon obtained landing rights in Ireland for a 100 Tbit-s trans-Atlantic route scheduled for 2027. These moves channel multi-billion-dollar capital flows directly to fiber manufacturers, reshaping supplier power dynamics. Telecom groups respond by repositioning as wholesale landlords rather than end-to-end owners.
Rapid 400 GbE and 800 GbE Upgrade Cycle Among Carriers
Coherent pluggable optics let operators quadruple wavelength throughput on legacy cables. Omantel proved the economics in 2025 by lifting each channel to 800 Gbps with Ciena's WaveLogic 6 and deferring a USD 200 million rip-and-replace project by at least five years. Altibox has already validated 1.6 Tbit-s single-wavelength trials, hinting at commercial adoption before 2028. Adoption of ITU-T G.654.E low-attenuation fiber in 60% of 2025 tenders further extends span lengths, lowering amplifier counts and operating power budgets.
High Maintenance and Repair-Ship Costs
Deep-water repairs typically range from USD 1 million to 3 million. This cost is influenced by daily vessel charter rates, which hover between USD 0.1 million and 0.3 million, and the unpredictable nature of multi-week weather windows. With only 60 dedicated repair ships available globally, the industry faces significant bottlenecks, especially when multiple vessels encounter faults simultaneously. In 2025, insurers responded to these challenges by increasing premiums by as much as 30% for corridors deemed high-risk. In light of these rising costs and potential downtimes, operators have begun pre-booking standby contracts. While this strategy adds an extra 5-8% to their project budgets, it significantly mitigates the risk of extended downtimes.
Other drivers and restraints analyzed in the detailed report include:
- Growing Smartphone Penetration and Rising Internet Bandwidth Demand
- Increasing Fiber Connectivity in Emerging Regions
- Growing Investment in LEO Satellite Constellations
For complete list of drivers and restraints, kindly check the Table Of Contents.
Segment Analysis
The submarine optical fiber cable market size for wet-plant equipment stood at USD 2.67 billion in 2025, equal to 51.32% of overall revenue, as repeaters and branching units remain the single largest cost block. Yet auxiliary and marine services are growing at 11.69% annually because operators in conflict-prone corridors purchase round-the-clock repair coverage and seabed route audits. That service-centric shift increases recurring revenue and cushions suppliers against the lumpiness of turnkey hardware contracts.
Dry-plant equipment, namely optical line terminals and monitoring platforms, faces commoditization as hyperscalers demand open architectures that disaggregate transport electronics from wet-plant vendors. Smaller niches, including distributed acoustic sensing units that repurpose the fiber itself as a vibration sensor, have emerged after National Grid's 2024 deployment proved 15% turbine-downtime savings for offshore wind projects. Across components, suppliers diversify into hybrid power-data cables to tap an adjacent USD 500 million addressable pool by 2030.
Single-mode designs held 66.32% of 2025 revenue, but multi-core and SDM fiber posted the highest growth at 11.43% as NEC's 22-core demonstration reached 680 Tbit-s on a single fiber pair. Early deployments remain inside data-center campuses, yet splicing-cost declines to below USD 10,000 per joint, anticipated by 2027, will unlock long-haul adoption. The ITU-T G.654.E low-attenuation specification underpins most new tender documents, enabling amplifier spacing of 400 km and trimming repeater counts by 40% versus legacy G.652.D.
Multimode fiber persists for short offshore-platform hops under 10 km but continues to cede share as single-mode prices fall. Suppliers funnel R&D toward hollow-core variants that promise sub-latency propagation and could complement SDM in the next decade if manufacturing yields stabilize.
Complete Report Scope:
- By Component
- Wet-Plant Equipment
- Dry-Plant Equipment
- Auxiliary and Marine Services
- Other Components
- By Cable Type
- Single-mode Fiber
- Multimode Fiber
- SDM / Multi-core Fiber
- By Client Type
- Telecom Operators
- Content and Hyperscale Cloud Providers
- Government and Research Networks
- Offshore Energy Operators
- Other Clinet Types
- By Capacity Design
- less than or equal to 16 Tbps Systems
- 16 - 60 Tbps Systems
- above 60 Tbps Systems
- By Geography
- North America
- United States
- Canada
- South America
- Brazil
- Argentina
- Rest of South America
- Europe
- Germany
- France
- United Kingdom
- Rest of Europe
- Asia-Pacific
- China
- India
- Japan
- Australia
- Rest of Asia-Pacific
- Middle East
- Saudi Arabia
- United Arab Emirates
- Turkey
- Rest of Middle East
- Africa
- South Africa
- Egypt
- Nigeria
- Rest of Africa
- North America
Geography Analysis
Asia-Pacific led the submarine optical fiber cable market with 33.21% revenue in 2025, driven by the SEA-ME-WE-6's Mumbai landing and Japan's USD 300 million JUNO route, which secures disaster-recovery links for Tokyo enterprises. China's manufacturers remain active but face political headwinds in Australia and the United States, rerouting traffic through Singapore and Hong Kong to comply with national-security screening requirements.
Africa delivers the fastest growth at 11.83% CAGR through 2031. Meta's 2Africa system now spans the continent with 180 Tbit-s of capacity across 33 landings, slashing wholesale Mbps prices by double digits in Nigeria, Kenya, and South Africa. Lower tariffs stimulate local data-center builds and cloud on-ramp deployments that were impossible under satellite-backed terabit ceilings.
North America sees steady replacement demand as early-2000s cables reach end of life and are upgraded to 800 GbE wavelengths. Europe's permitting cycle grew longer after Brexit split licensing regimes for cross-Channel landings, while strict EU environmental reviews add 12-18 months to Mediterranean routes. South America diversifies away from its Miami choke point via Brazil-Portugal links such as Seabras-2, creating alternate corridors that lower single-point-failure risk. Middle Eastern traffic remains transit-heavy; operators now deploy Red Sea protection loops to hedge against disruption, and insurers levy higher premiums on Suez passages. Emerging trans-polar routes promise 30% latency cuts between Asia and Europe once Far North Fiber's 14,000 km link activates in late 2026..
- Alcatel Submarine Networks Ltd.
- HMN Technologies Co., Ltd.
- Nexans S.A.
- SubCom, LLC
- Fujitsu Ltd.
- Global Marine Group Ltd.
- IT International Telecom Inc.
- Orange Marine SAS
- Sumitomo Electric Industries Ltd.
- LS Cable and System Ltd.
- Jiangsu Hengtong Marine Cable Systems Co., Ltd.
- S.B. Submarine Systems Co., Ltd.
- PT Communication Cable Systems Indonesia Tbk
- NTT Communications Corporation
- Verizon Communications Inc.
- Telstra Group Limited
- China Unicom Global Limited
- Telekom Malaysia Berhad
- Oman Telecommunications Company S.A.O.G. (Omantel)
- Meta Platforms, Inc.
- Amazon.com, Inc.
- Google LLC
Additional Benefits:
- The market estimate (ME) sheet in Excel format
- 3 months of analyst support
TABLE OF CONTENTS
1 INTRODUCTION
- 1.1 Study Assumptions and Market Definition
- 1.2 Scope of the Study
2 RESEARCH METHODOLOGY
3 EXECUTIVE SUMMARY
4 MARKET LANDSCAPE
- 4.1 Market Overview
- 4.2 Market Drivers
- 4.2.1 Growing Smartphone Penetration and Rising Internet Bandwidth Demand
- 4.2.2 Increasing Fiber Connectivity in Emerging Regions
- 4.2.3 Rapid 400 GbE and 800 GbE Upgrade Cycle among Carriers
- 4.2.4 Hyperscale Cloud and OTT Investment in Private Cables
- 4.2.5 Push toward Low-Latency Trans-polar Routes
- 4.2.6 Offshore Wind Farms Adopting Hybrid Power-Data Cables
- 4.3 Market Restraints
- 4.3.1 High Maintenance and Repair-Ship Costs
- 4.3.2 Growing Investment in LEO Satellite Constellations
- 4.3.3 Geopolitical Cable-Landing Permit Delays
- 4.3.4 Fiber-Optic Theft and Vandalism in Shallow Waters
- 4.4 Industry Value / Supply-Chain Analysis
- 4.5 Regulatory Landscape
- 4.6 Technological Outlook
- 4.7 Porter's Five Forces
- 4.7.1 Bargaining Power of Suppliers
- 4.7.2 Bargaining Power of Buyers
- 4.7.3 Threat of New Entrants
- 4.7.4 Threat of Substitute Products
- 4.7.5 Degree of Competition
- 4.8 Impact of Macroeconomic Factors on the Market
- 4.9 Investment Analysis
- 4.10 Submarine Cable Projects Database
5 MARKET SIZE AND GROWTH FORECASTS (VALUE)
- 5.1 By Component
- 5.1.1 Wet-Plant Equipment
- 5.1.2 Dry-Plant Equipment
- 5.1.3 Auxiliary and Marine Services
- 5.1.4 Other Components
- 5.2 By Cable Type
- 5.2.1 Single-mode Fiber
- 5.2.2 Multimode Fiber
- 5.2.3 SDM / Multi-core Fiber
- 5.3 By Client Type
- 5.3.1 Telecom Operators
- 5.3.2 Content and Hyperscale Cloud Providers
- 5.3.3 Government and Research Networks
- 5.3.4 Offshore Energy Operators
- 5.3.5 Other Clinet Types
- 5.4 By Capacity Design
- 5.4.1 less than or equal to 16 Tbps Systems
- 5.4.2 16 - 60 Tbps Systems
- 5.4.3 above 60 Tbps Systems
- 5.5 By Geography
- 5.5.1 North America
- 5.5.1.1 United States
- 5.5.1.2 Canada
- 5.5.2 South America
- 5.5.2.1 Brazil
- 5.5.2.2 Argentina
- 5.5.2.3 Rest of South America
- 5.5.3 Europe
- 5.5.3.1 Germany
- 5.5.3.2 France
- 5.5.3.3 United Kingdom
- 5.5.3.4 Rest of Europe
- 5.5.4 Asia-Pacific
- 5.5.4.1 China
- 5.5.4.2 India
- 5.5.4.3 Japan
- 5.5.4.4 Australia
- 5.5.4.5 Rest of Asia-Pacific
- 5.5.5 Middle East
- 5.5.5.1 Saudi Arabia
- 5.5.5.2 United Arab Emirates
- 5.5.5.3 Turkey
- 5.5.5.4 Rest of Middle East
- 5.5.6 Africa
- 5.5.6.1 South Africa
- 5.5.6.2 Egypt
- 5.5.6.3 Nigeria
- 5.5.6.4 Rest of Africa
- 5.5.1 North America
6 COMPETITIVE LANDSCAPE
- 6.1 Market Concentration
- 6.2 Strategic Moves
- 6.3 Market Share Analysis
- 6.4 Company Profiles (includes Global level Overview, Market level overview, Core Segments, Financials as available, Strategic Information, Market Rank/Share for key companies, Products and Services, and Recent Developments)
- 6.4.1 Alcatel Submarine Networks Ltd.
- 6.4.2 HMN Technologies Co., Ltd.
- 6.4.3 Nexans S.A.
- 6.4.4 SubCom, LLC
- 6.4.5 Fujitsu Ltd.
- 6.4.6 Global Marine Group Ltd.
- 6.4.7 IT International Telecom Inc.
- 6.4.8 Orange Marine SAS
- 6.4.9 Sumitomo Electric Industries Ltd.
- 6.4.10 LS Cable and System Ltd.
- 6.4.11 Jiangsu Hengtong Marine Cable Systems Co., Ltd.
- 6.4.12 S.B. Submarine Systems Co., Ltd.
- 6.4.13 PT Communication Cable Systems Indonesia Tbk
- 6.4.14 NTT Communications Corporation
- 6.4.15 Verizon Communications Inc.
- 6.4.16 Telstra Group Limited
- 6.4.17 China Unicom Global Limited
- 6.4.18 Telekom Malaysia Berhad
- 6.4.19 Oman Telecommunications Company S.A.O.G. (Omantel)
- 6.4.20 Meta Platforms, Inc.
- 6.4.21 Amazon.com, Inc.
- 6.4.22 Google LLC
7 MARKET OPPORTUNITIES AND FUTURE OUTLOOK
- 7.1 White-space and Unmet-Need Assessment

 海底光纜市場-2026-2032年全球市場預測
 海底光纖骨幹:市場佔有率分析、產業趨勢與統計、成長預測(2026-2031)
 海底電纜市場規模、佔有率和趨勢分析報告:按應用、電壓、最終用途、組件、交付方式、地區和細分市場預測(2026-2033 年)
 海底電纜市場:按服務、應用和地區分類海底通訊電纜系統市場:2026-2032年全球市場預測(依資料傳輸速率、技術、部署類型、網路所有權類型、光纖對數、電纜長度和應用分類)UBM電鍍服務市場(按電鍍材料、基材、技術、應用和最終用途產業分類),全球預測,2026-2032年
 海底電纜市場規模、佔有率和成長分析(按服務類型、類型、電壓、最終用途、絕緣材料和地區分類)-2026-2033年產業預測
 全球海底電纜檢測設備市場
 海底電纜檢測設備市場-全球產業規模、佔有率、趨勢、機會和預測(按類型、應用、部署模式、地區和競爭細分,2020-2030 年預測)
 2032 年海底電纜市場預測:按組件、電纜類型、電壓、服務、應用、最終用戶和地區進行的全球分析