


 |
市場調查報告書
商品編碼
2122050
離心式壓縮機:市佔率分析、產業趨勢與統計、成長預測(2026-2031)Centrifugal Compressor - Market Share Analysis, Industry Trends & Statistics, Growth Forecasts (2026 - 2031) |
||||||

※ 本網頁內容可能與最新版本有所差異。詳細情況請與我們聯繫。
據 Mordor Intelligence 稱,離心式壓縮機市場預計在 2026 年達到 84.6 億美元,預計在預測期(2026-2031 年)內將以 5.55% 的複合年成長率成長,到 2031 年達到 110.8 億美元。
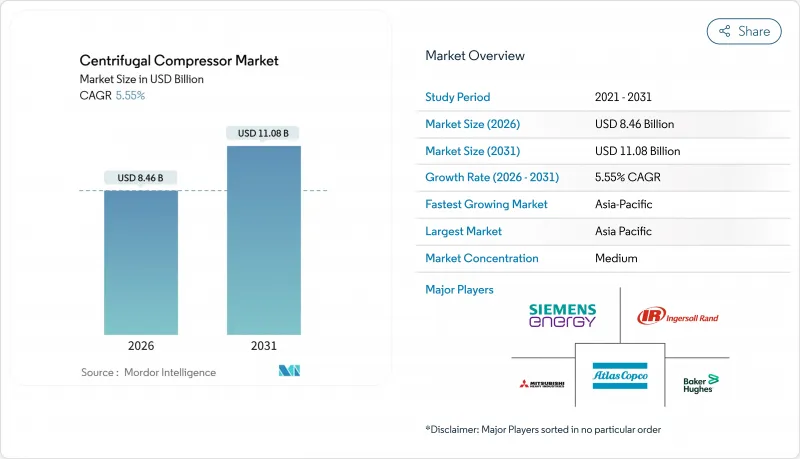
本報告按壓縮機設計(直通式和整合齒輪式)、級數(單級和多級)、冷卻方式(空冷和水冷)、最終用戶行業(石油和天然氣、石化、發電、金屬和採礦、食品和飲料等)以及地區(北美、歐洲、亞太、南美以及中東和非洲)進行分類。
全球離心式壓縮機市場趨勢及洞察
天然氣管道建設激增
北美計畫正從大型幹線管道轉向連接二疊紀盆地和阿巴拉契亞盆地油田與墨西哥灣沿岸LNG接收站的支線管道。光是2024年,美國就批准了七個管道項目,每個項目將新增每日32億立方英尺的輸送能力,每個項目都需要多個離心式壓縮機站。金德摩根公司位於德克薩斯州和路易斯安那州的管道項目已安裝了六台22,500馬力的機組,能夠應對入口壓力波動而不會造成突波損失。在沙烏地阿拉伯,「主天然氣系統」的第四期工程將採用緊湊型整合齒輪傳動機械,以節省安裝空間,預計2027年將使輸送能力增加每日30億立方英尺。中東業者傾向於採用模組化撬裝設備,這種設備可以將現場安裝時間從18個月縮短到12個月,並縮短資金周轉週期。隨著這些管網的延伸,旋轉設備的更換週期將縮短,從而推動離心式壓縮機市場的發展。
加強液化天然氣液化和再氣化能力
預計2024年至2030年間,全球液化產能將以每年3000億立方公尺的速度成長,每套生產線使用4至6台離心式壓縮機將天然氣冷卻至-162 度C Global的Prakmins專案在18套模組化生產線上安裝了72台壓縮機,年出口能力達2,000萬噸。在卡達的北方氣田東部,三菱重工獲得了一份價值18億美元的訂單,將提供96台壓縮機,這些壓縮機在部分負載下可降低8%的電力消耗量。在需求方面,三艘浮式儲存再氣化裝置(FSRU)將於2024年在歐洲投入運作,每艘FSRU使用兩台高壓輸送壓縮機以70巴的壓力注入天然氣。由於液化天然氣(LNG)合約屬於資本密集型項目,合約期限長達20年,這些壓縮機屬於長週期資產,且不易受短期價格波動的影響。
高資本投資成本與往復式替代方案的比較
離心式機械的安裝成本為每馬力 800 至 2,500 美元,而中功率範圍內的往復式機械的安裝成本為每馬力 600 至 900 美元。對於年運作在 4,000 至 6,000 小時的小規模沼氣和掩埋氣項目,活塞式系統是首選,因為間歇性運作並不足以抵消離心式系統較高的成本。此外,變頻驅動器、突波保護控制和振動監測等額外成本還會增加 40 萬至 60 萬美元。在印度和東南亞,由於這些地區的貸款機構認為殘值風險較低,因此租賃協議中更傾向於選擇往復式設備。只有當年運作超過 7,000 小時且人事費用超過每小時 80 美元時,離心式設計才具有經濟優勢,但在許多新興地區,這樣的閾值仍然很少見。
細分市場分析
到2025年,直通式壓縮機將主導離心式壓縮機市場,佔88.4%的市佔率。管道和天然氣收集業者青睞其簡單的軸系和易於維護的軸承。一體式齒輪壓縮機預計將以7.3%的複合年成長率成長。這是因為它們適用於甲板空間極其有限的浮體式液化天然氣(FLNG)平台和海上平台,面積。
離心式壓縮機市場反映了對上世紀90年代生產的設備進行齒輪箱維修的趨勢,因為API 617-2024標準的振動限制鼓勵避免昂貴的軸改造。土地資源有限的歐洲和亞洲買家更傾向於齒輪傳動佈局,這種佈局可降低6分貝的噪音並減少35%的面積。隨著粉末冶金齒輪將大修間隔從4萬小時延長至6萬小時,並將全生命週期成本降低12%,齒輪箱的成本溢價正在下降。
到2025年,多級壓縮機將佔離心式壓縮機市場60.6%的佔有率,這主要得益於長距離輸電線路和氨廠對4:1或更高壓比的需求。然而,單級壓縮機預計到2031年將以6.8%的複合年成長率成長,這主要得益於資料中心和食品加工等產業對低於3:1壓比的冷卻需求。
計算流體力學(CFD) 技術促成了3D曲面葉片的研發,使單級壓縮機能夠實現高達 3.8:1 的壓力比。這省去了中間冷卻器,每套設備可節省 30 萬至 40 萬美元的成本。在採礦領域,巴西一家球團製造廠採用了 12 台單級壓縮機,並表示由於省去了級間密封件,維護成本降低了 20%。隨著食品級氮氣供應和二氧化碳注入應用逐漸擺脫油浸式活塞壓縮機,離心式壓縮機市場也受惠於 ISO 8573-1 零級認證的日益普及。
區域分析
預計到2025年,亞太地區將佔全球銷售額的38.3%,並以6.2%的複合年成長率成長,這主要得益於中國運作的六個石化聯合裝置,每個裝置都包含80多台壓縮機。印度克里希納-戈達瓦里盆地訂單的12台海底壓縮機(每台容量15兆瓦)凸顯了海上油氣產業獲利能力不斷提升的趨勢。在日本和韓國,為了滿足含硫量低於10ppm的船用燃料的監管要求,一些有潤滑油相關風險的裝置正被無油裝置取代。
北美地區在二疊紀盆地管道和墨西哥灣沿岸液化計畫的支撐下,預計2025年將佔全球液化天然氣需求的近30%。普拉克明斯液化天然氣專案和科珀斯克里斯蒂三期專案已聯合訂購48台混合冷媒壓縮機。加拿大液化天然氣公司(LNG Canada)訂購了一套價值15.5億美元的壓縮機-渦輪機組,該機組能夠處理含15%氫氣的混合氣。在墨西哥,瓦哈拉哈拉天然氣管道系統的四個高壓站已投入運作,將天然氣輸送至500公里外的瓜達拉哈拉。
歐洲約佔離心式壓縮機市場的五分之一,德國的三座浮動儲存再氣化裝置(FSRU)目前正以70巴的壓力注入再氣化液化天然氣(LNG)。基於ISO 50001標準的工業設備維修正在取代2010年以前的設備,該計畫利用了歐盟創新基金的津貼。中東和非洲地區預計到2025年將佔全球需求的約13%,其未來取決於卡達北部油田的擴建計畫以及阿布達比國家石油公司(ADNOC)魯瓦伊斯煉油廠的維修,後者將安裝16套氫氣循環裝置。南美洲的市佔率仍然小規模,僅佔4-5%,但值得注意的是,巴西石油公司(Petrobras)訂單了價值3.2億美元的海底壓縮設備,以幫助維持布濟奧斯油田的壓力。
其他好處:
- Excel格式的市場預測(ME)表
- 3個月的分析師支持
目錄
第1章:引言
- 研究假設和市場定義
- 調查範圍
第2章:調查方法
第3章執行摘要
第4章 市場狀況
- 市場概覽
- 市場促進因素
- 天然氣管道建設正在蓬勃發展。
- 加強液化天然氣液化和再氣化能力
- 擴大工業燃氣複合循環發電能力
- 更嚴格的節能維修
- 氫能樞紐對無油壓縮機的需求
- 透過預測性維護縮短更換週期
- 市場限制因素
- 高額資本投資成本與替代往復式系統的比較。
- 上游投資週期受原油價格波動的影響。
- 合金葉輪供應瓶頸
- 模組化螺旋壓縮機組的興起
- 供應鏈分析
- 監理情勢
- 技術展望
- 波特五力模型
第5章 市場規模與成長預測
- 壓縮機設計
- 直通
- 整合齒輪類型
- 逐階段
- 單級
- 多階段
- 透過冷卻法
- 空冷式
- 水冷
- 按最終用戶行業分類
- 石油和天然氣
- 石油化工產品及化學產品
- 發電
- 金屬和採礦
- 食品/飲料
- 其他
- 按地區
- 北美洲
- 美國
- 加拿大
- 墨西哥
- 歐洲
- 德國
- 英國
- 法國
- 西班牙
- 義大利
- 北歐國家
- 俄羅斯
- 其他歐洲國家
- 亞太地區
- 中國
- 印度
- 日本
- 韓國
- 東南亞國協
- 澳洲和紐西蘭
- 其他亞太國家
- 南美洲
- 巴西
- 阿根廷
- 智利
- 其他南美國家
- 中東和非洲
- 沙烏地阿拉伯
- 阿拉伯聯合大公國
- 南非
- 埃及
- 其他中東和非洲國家
- 北美洲
第6章 競爭情勢
- 市場集中度
- 策略趨勢(併購、聯盟、購電協議)
- 市場佔有率分析(主要公司的市場排名和佔有率)
- 公司簡介
- Atlas Copco AB
- Ingersoll Rand Inc.
- Siemens Energy AG
- Baker Hughes Co.
- Mitsubishi Heavy Industries Ltd
- Sundyne LLC
- Elliott Group
- Howden Group
- MAN Energy Solutions
- Kobe Steel Ltd
- HMS Group
- Borsig GmbH
- Hitachi Ltd
- Kirloskar Pneumatic Co.
- FS-Elliott
- Gardner Denver Nash
- Shenyang Blower Works Group
- Boldrocchi
- IHI Rotating Machinery
- Sulzer Ltd
第7章 市場機會與未來展望
According to Mordor Intelligence, the centrifugal compressor market size is estimated at USD 8.46 billion in 2026, and is expected to reach USD 11.08 billion by 2031, at a CAGR of 5.55% during the forecast period (2026-2031).
This report is Segmented by Compressor Design (Straight-Through and Integrally Geared), Stage (Single-Stage and Multi-Stage), Cooling Method (Air-Cooled and Water-Cooled), End-User Industry (Oil and Gas, Petrochemicals and Chemicals, Power Generation, Metals and Mining, Food and Beverage, and Others), and Geography (North America, Europe, Asia-Pacific, South America, and Middle East and Africa).
Global Centrifugal Compressor Market Trends and Insights
Surging Natural-Gas Pipeline Build-Outs
North American projects are moving from mega trunk lines toward laterals that link Permian and Appalachian fields to Gulf Coast LNG terminals. Seven U.S. pipeline approvals in 2024 alone added 3.2 bcf/d of capacity, each requiring multiple centrifugal compressor stations. Kinder Morgan's Texas-Louisiana line deployed six 22,500-horsepower units able to handle fluctuating inlet pressures without surge losses. In Saudi Arabia, Phase IV of the Master Gas System will add 3 bcf/d by 2027 using compact integrally geared machines to save plot space. Middle-Eastern operators favor modular skids that cut field-installation time from 18 months to 12 months, improving tariff recovery timelines. As these networks increase mileage, rotational equipment replacement cycles shorten, feeding the centrifugal compressor market.
LNG Liquefaction & Regas Capacity Additions
Global liquefaction capacity is on pace to grow by 300 bcm per year between 2024 and 2030, with each train relying on 4-6 centrifugal compressors to chill gas to -162 °C. Venture Global's Plaquemines project installed 72 compressors across 18 modular trains, delivering 20 mtpa of export capacity. Qatar's North Field East awarded Mitsubishi Heavy Industries a USD 1.8 billion order for 96 units that offer 8% lower power draw in part-load. On the demand side, Europe brought three FSRUs online in 2024, each using two high-pressure send-out compressors to inject gas at 70 bar. The capital-intensive, 20-year nature of LNG contracts makes these compressors long-cycle assets immune to short-term price swings.
High Capex vs. Reciprocating Alternatives
Installed costs range from USD 800 to USD 2,500 per horsepower for centrifugal machines, versus USD 600-900 for reciprocating units in mid-power ranges. Small-scale biogas and landfill-gas projects with 4,000-6,000 operating-hours per year opt for pistons because their intermittent duty does not justify centrifugal premiums. Add-on expenses such as a variable-frequency drive, anti-surge controls, and vibration monitoring add another USD 400,000-600,000. Leasing options favor reciprocating equipment in India and Southeast Asia, where financiers see lower residual-value risk. Economics swing in favor of centrifugal designs only when annual run-hours exceed 7,000 and labor costs top USD 80 per hour, thresholds still rare in many emerging regions.
Other drivers and restraints analyzed in the detailed report include:
- Industrial CCGT Capacity Expansion
- Hydrogen Hub Demand for Oil-Free Compression
- Alloy-Impeller Supply Bottlenecks
For complete list of drivers and restraints, kindly check the Table Of Contents.
Segment Analysis
Straight-through machines dominated with 88.4% centrifugal compressor market share in 2025; pipeline and gas-gathering operators value their simpler shaft line and easier bearing maintenance. Integrally geared models are forecast to expand at a 7.3% CAGR because a 30%-40% footprint reduction suits floating LNG and offshore platforms where deck space commands premiums.
The centrifugal compressor market reflects that API 617-2024 vibration limits encourage gearbox retrofits of 1990s-vintage units to avoid costly shaft modifications. European and Asian buyers facing land constraints prefer geared layouts that cut noise by 6 dB and plot area by 35%. Gearbox cost premiums are narrowing as powder-metallurgy gears extend overhaul intervals from 40,000 hours to 60,000 hours, reducing lifecycle costs by 12%.
Multi-stage equipment captured 60.6% of the centrifugal compressor market size in 2025 because long-haul pipelines and ammonia plants need 4:1 or higher pressure ratios. Yet single-stage configurations are expected to advance at a 6.8% CAGR through 2031, buoyed by data-center cooling and food processing that demand ratios below 3:1.
Computational fluid dynamics now yields 3D curved blades that push single-stage ratios to 3.8:1, eliminating intercoolers and saving USD 300,000-400,000 per train. In mining, Brazilian pellet plants selected 12 single-stage units for 20% lower maintenance due to no interstage seals. The centrifugal compressor market benefits when ISO 8573-1 Class Zero certification drives food-grade nitrogen and carbonation service away from oil-flooded pistons.
Complete Report Scope:
- By Compressor Design
- Straight-through
- Integrally geared
- By Stage
- Single-stage
- Multi-stage
- By Cooling Method
- Air-cooled
- Water-cooled
- By End-user Industry
- Oil and Gas
- Petrochemicals and Chemicals
- Power Generation
- Metals and Mining
- Food and Beverage
- Others
- By Geography
- North America
- United States
- Canada
- Mexico
- Europe
- Germany
- United Kingdom
- France
- Spain
- Italy
- NORDIC Countries
- Russia
- Rest of Europe
- Asia-Pacific
- China
- India
- Japan
- South Korea
- ASEAN Countries
- Australia and New Zealand
- Rest of Asia-Pacific
- South America
- Brazil
- Argentina
- Chile
- Rest of South America
- Middle East and Africa
- Saudi Arabia
- United Arab Emirates
- South Africa
- Egypt
- Rest of Middle East and Africa
- North America
Geography Analysis
Asia-Pacific retained 38.3% of 2025 revenue and is forecast to advance at a 6.2% CAGR as China commissioned six petrochemical complexes deploying more than 80 compressors. India's KG Basin subsea compression order for 12 units at 15 MW each highlights offshore monetization trends. Japan and South Korea are swapping out lubricant-risk units with oil-free machines to meet 10 ppm sulfur marine fuel mandates.
North America contributed close to 30% of global demand in 2025, supported by Permian pipelines and Gulf Coast liquefaction. Plaquemines LNG and Corpus Christi Stage 3 together placed 48 orders for mixed-refrigerant compressors. Canada's LNG Canada awarded a USD 1.55 billion compressor-turbine package that can handle 15% hydrogen blends. Mexico's Wahalajara system commissioned four high-pressure stations to move gas 500 km to Guadalajara.
Europe held nearly one-fifth of the centrifugal compressor market; three German FSRUs now inject regasified LNG at 70 bar. Industrial retrofits under ISO 50001 are replacing pre-2010 machines and unlocking EU Innovation Fund grants. The Middle East and Africa, roughly 13% of 2025 demand, hinge on Qatar's North Field expansion and ADNOC's Ruwais refinery upgrade, which installed 16 hydrogen recycle units. South America remains small at 4%-5% but notable for Petrobras' USD 320 million subsea compression order supporting Buzios field pressure maintenance.
- Atlas Copco AB
- Ingersoll Rand Inc.
- Siemens Energy AG
- Baker Hughes Co.
- Mitsubishi Heavy Industries Ltd
- Sundyne LLC
- Elliott Group
- Howden Group
- MAN Energy Solutions
- Kobe Steel Ltd
- HMS Group
- Borsig GmbH
- Hitachi Ltd
- Kirloskar Pneumatic Co.
- FS-Elliott
- Gardner Denver Nash
- Shenyang Blower Works Group
- Boldrocchi
- IHI Rotating Machinery
- Sulzer Ltd
Additional Benefits:
- The market estimate (ME) sheet in Excel format
- 3 months of analyst support
TABLE OF CONTENTS
1 Introduction
- 1.1 Study Assumptions & Market Definition
- 1.2 Scope of the Study
2 Research Methodology
3 Executive Summary
4 Market Landscape
- 4.1 Market Overview
- 4.2 Market Drivers
- 4.2.1 Surging natural-gas pipeline build-outs
- 4.2.2 LNG liquefaction & regas capacity additions
- 4.2.3 Industrial CCGT capacity expansion
- 4.2.4 Stricter energy-efficiency retrofits
- 4.2.5 Hydrogen hub demand for oil-free compression
- 4.2.6 Predictive-maintenance led replacement cycles
- 4.3 Market Restraints
- 4.3.1 High capex vs. reciprocating alternatives
- 4.3.2 Upstream spend cycles tied to volatile oil prices
- 4.3.3 Alloy-impeller supply bottlenecks
- 4.3.4 Rise of modular screw-compressor packages
- 4.4 Supply-Chain Analysis
- 4.5 Regulatory Landscape
- 4.6 Technological Outlook
- 4.7 Porter's Five Forces
- 4.7.1 Bargaining Power of Suppliers
- 4.7.2 Bargaining Power of Consumers
- 4.7.3 Threat of New Entrants
- 4.7.4 Threat of Substitutes
- 4.7.5 Intensity of Competitive Rivalry
5 Market Size & Growth Forecasts
- 5.1 By Compressor Design
- 5.1.1 Straight-through
- 5.1.2 Integrally geared
- 5.2 By Stage
- 5.2.1 Single-stage
- 5.2.2 Multi-stage
- 5.3 By Cooling Method
- 5.3.1 Air-cooled
- 5.3.2 Water-cooled
- 5.4 By End-user Industry
- 5.4.1 Oil and Gas
- 5.4.2 Petrochemicals and Chemicals
- 5.4.3 Power Generation
- 5.4.4 Metals and Mining
- 5.4.5 Food and Beverage
- 5.4.6 Others
- 5.5 By Geography
- 5.5.1 North America
- 5.5.1.1 United States
- 5.5.1.2 Canada
- 5.5.1.3 Mexico
- 5.5.2 Europe
- 5.5.2.1 Germany
- 5.5.2.2 United Kingdom
- 5.5.2.3 France
- 5.5.2.4 Spain
- 5.5.2.5 Italy
- 5.5.2.6 NORDIC Countries
- 5.5.2.7 Russia
- 5.5.2.8 Rest of Europe
- 5.5.3 Asia-Pacific
- 5.5.3.1 China
- 5.5.3.2 India
- 5.5.3.3 Japan
- 5.5.3.4 South Korea
- 5.5.3.5 ASEAN Countries
- 5.5.3.6 Australia and New Zealand
- 5.5.3.7 Rest of Asia-Pacific
- 5.5.4 South America
- 5.5.4.1 Brazil
- 5.5.4.2 Argentina
- 5.5.4.3 Chile
- 5.5.4.4 Rest of South America
- 5.5.5 Middle East and Africa
- 5.5.5.1 Saudi Arabia
- 5.5.5.2 United Arab Emirates
- 5.5.5.3 South Africa
- 5.5.5.4 Egypt
- 5.5.5.5 Rest of Middle East and Africa
- 5.5.1 North America
6 Competitive Landscape
- 6.1 Market Concentration
- 6.2 Strategic Moves (M&A, Partnerships, PPAs)
- 6.3 Market Share Analysis (Market Rank/Share for key companies)
- 6.4 Company Profiles (includes Global level Overview, Market level overview, Core Segments, Financials as available, Strategic Information, Products & Services, and Recent Developments)
- 6.4.1 Atlas Copco AB
- 6.4.2 Ingersoll Rand Inc.
- 6.4.3 Siemens Energy AG
- 6.4.4 Baker Hughes Co.
- 6.4.5 Mitsubishi Heavy Industries Ltd
- 6.4.6 Sundyne LLC
- 6.4.7 Elliott Group
- 6.4.8 Howden Group
- 6.4.9 MAN Energy Solutions
- 6.4.10 Kobe Steel Ltd
- 6.4.11 HMS Group
- 6.4.12 Borsig GmbH
- 6.4.13 Hitachi Ltd
- 6.4.14 Kirloskar Pneumatic Co.
- 6.4.15 FS-Elliott
- 6.4.16 Gardner Denver Nash
- 6.4.17 Shenyang Blower Works Group
- 6.4.18 Boldrocchi
- 6.4.19 IHI Rotating Machinery
- 6.4.20 Sulzer Ltd
7 Market Opportunities & Future Outlook
- 7.1 White-space & unmet-need assessment

 2026-2030年全球整體齒輪式離心壓縮機市場
 離心式氫氣壓縮機市場規模、佔有率、成長、全球產業分析、區域趨勢及2026-2034年預測。
 2026-2030年全球離心式壓縮機市場
 離心式壓縮機市場-全球產業規模、佔有率、趨勢、機會、預測:依最終用戶、地區和競爭對手分類,2021-2031年
 無油磁力軸承市場規模、佔有率和趨勢分析報告:按軸承類型、應用、地區和細分市場預測(2026-2033 年)
 2026年全球整體式齒輪離心壓縮機市場報告
 離心式壓縮機市場:依殼體類型、流量類型、級數、潤滑方式、冷卻方式、可壓縮氣體類型、分配通路、應用與最終用戶分類-2026-2032年全球預測無油磁浮離心式壓縮機市場:按類型、排氣量、壓力、安裝方式、轉速、終端用戶產業、應用、全球預測(2026-2032年)全球整體式齒輪離心壓縮機市場規模、佔有率、趨勢和成長分析報告(2026-2034)全球離心式壓縮機市場規模、佔有率、趨勢和成長分析報告(2026-2034年)