


 |
市場調查報告書
商品編碼
2122032
行動回程:市場佔有率分析、產業趨勢與統計、成長預測(2026-2031)Mobile Backhaul - Market Share Analysis, Industry Trends & Statistics, Growth Forecasts (2026 - 2031) |
||||||

※ 本網頁內容可能與最新版本有所差異。詳細情況請與我們聯繫。
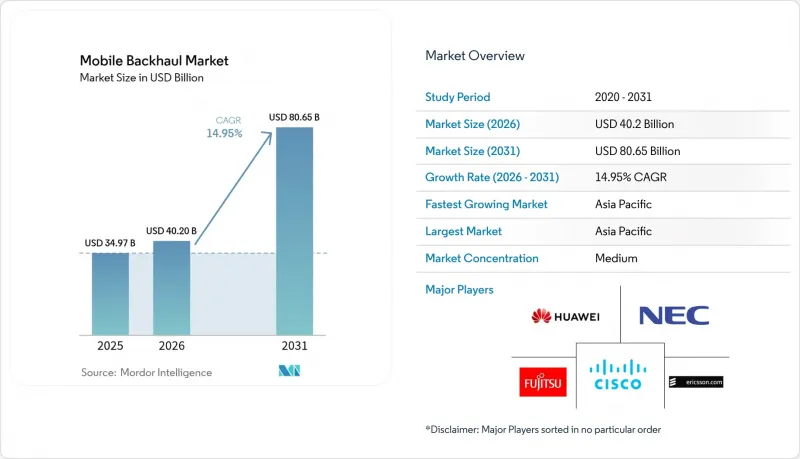
據 Mordor Intelligence 稱,行動回程市場預計到 2026 年價值 402 億美元,高於 2025 年的 349.7 億美元,預計到 2031 年將達到 806.5 億美元。
預計 2026 年至 2031 年的複合年成長率為 14.95%。
本報告依部署方式(有線[光纖和銅纜/DSL]、無線[微波、毫米波等])、設備類型(路由器和交換器、微波無線電等)、服務類型(專業服務、託管服務等)、網路架構(大型基地台回程傳輸等)、最終用戶(行動網路營運商、中立主機和鐵塔公司等)和地區進行分類。
全球行動回程市場趨勢與洞察
行動數據流量不斷成長和智慧型手機普及
預計智慧型手機用戶每月平均資料通訊將從2023年的21GB激增至2029年的56GB,其中影片預計將佔行動流量的75%。地區差異也日益明顯,北美用戶每月數據使用量可能達到66GB,而撒哈拉以南非洲地區的用戶預計仍將保持在23GB左右,這迫使電信業者為每個國家設計最佳的回程傳輸連結配置。由於混合拓撲結構結合了光纖主幹和高頻寬微波鏈路,能夠在無需辦理道路挖掘許可證的情況下滿足容量需求,因此在人口密集的都市區正逐漸成為主流。隨著小型基地台的普及,數千條短程連結被添加到網路中,營運商正在增加對自動化網路管理平台的投資,以即時調整特定站點的容量。
5G的快速部署正在推動網路容量的需求。
5G叢集的基地台密度正從每平方公里4-5個站點增加到40-50個站點,大幅提升了回程傳輸的終端數量。光是在中國,就已建成超過60萬個5G大型基地台和小型基地台,預計這數字將是4G的1.3到1.5倍。目前,每個5G小區都需要具備10Gbps的上行鏈路頻寬和低於5毫秒的嚴格延遲要求,這加速了70/80GHz E頻段無線電設備和基於光纖的時序敏感網路(TSN)的部署。由於資本負擔加重,許多業者正轉向部署共用基地台和租用暗纖,以降低初始成本,同時確保未來升級到100Gbps介面的路徑。
由於光纖和頻段成本高昂,需要大量資金投入。
在人口稠密的都市區,鋪設光纖電纜的成本可能超過每公里10萬美元,在道路挖掘許可難以取得的地區,成本更是飆升。此外,不斷上漲的電費意味著,當4G和5G頻段重疊時,宏基地台的電力消耗量會翻倍,從而增加營運成本。在開發中國家,低利率貸款管道有限,延緩了光纖部署,迫使電信公司依賴微波技術,即使從長遠來看,光纖在經濟上更具優勢。因此,都市區使用者體驗品質的差異阻礙了數位包容目標的實現。
細分市場分析
光纖鏈路憑藉其無與倫比的容量和低延遲,預計到2025年將佔據行動回程市場54.30%的佔有率。這一佔有率在行動回程市場中佔據最大,該市場預計到2025年將達到189.9億美元。然而,隨著都市區密度增加和不可預測事件對快速服務推出的需求,無線替代方案可望縮小差距,到2031年將維持16.18%的複合年成長率。電信業者正在將70/80 GHz E波段無線電與租用的暗纖幹線結合,以實現每跳10 Gbps的速度,同時避免昂貴的土木工程項目。
混合架構如今已成為標準。雖然光纖仍然是核心聚合的首選介質,但微波和毫米波正服務於邊緣小型基地台和企業設施,在這些區域,由於許可和地理限制,開放式光纖鏈路難以部署。新興的W波段和D波段鏈路可在1-2公里的距離內實現多Gigabit的吞吐量,與高密度叢集中的光纖形成互補。在人口稀少的地區,營運商將低地球軌道衛星回程傳輸連接到微波環網,以在不超出預算限制的情況下建造連續覆蓋。這種柔軟性構成了行動回程市場長期競爭力的基礎。
微波無線電設備預計到2025年將佔行動回程市場規模的40.55%,這得益於其數十年來經受現場驗證的可靠性。供應商正在將頻譜效率提升至16 bps/Hz,並採用鏈路聚合技術來聚合不連續通道。雖然小型基地台回程傳輸設備目前僅佔銷售額的一小部分,但隨著體育場館、購物中心和交通樞紐等室內5G部署的增加,預計其年複合成長率將達到17.08%。
行動回程市場正向整合接回程傳輸(IAB) 轉型,其中 28 GHz 無線網路可同時為用戶終端提供服務並向上游轉送流量。這可以減少屋頂擁塞並簡化區域分類。毫米波晶片組的進步將從 2023 年起降低 30% 的功耗,從而實現桿式和窗式節點安裝,最大限度地減少安裝工作量。捆綁自組織網路 (SON) 軟體的供應商在競標中具有競爭優勢,因為它可以減少現場訪問次數並最佳化擁塞環境中的鏈路部署。
區域分析
亞太地區佔據行動回程市場34.60%的佔有率,並以16.92%的複合年成長率快速成長,主要得益於5G領域的巨額投資、政府補貼以及高密度的城市人口。在中國、日本和韓國,主要城市已實現獨立組網(SA)5G覆蓋,對10Gbps微波鏈路的需求激增,以避免鑽井瓶頸。在印度,近期的頻譜競標推動了高速公路和二線城市光纖電纜的鋪設熱潮,電信業者也正在喜馬拉雅地區和島嶼地區進行混合衛星和微波系統的試點測試,以發展網路。政府支持農村地區光纖電纜建設的政策也進一步推動了這項發展動能。
北美雖然規模較小,但在虛擬化無線存取網路 (RAN) 和暗纖聚合方面卻處於創新領先地位。 Verizon 和 T-Mobile 透過收購區域光纖營運商,在 2024 年加強了其光纖網路基礎設施,確保了可擴展的回程傳輸,從而支援固定無線存取的部署。美國聯邦通訊委員會 (FCC) 設立的 90 億美元「5G 基金」正在加速偏遠地區的基地台升級,並推動在地形複雜、難以開挖溝槽的地區投資微波和衛星回程傳輸。透過重複利用光纖進行Gigabit寬頻和基地台上行鏈路通訊,營運商正在加速固移融合,並提高資本回報率 (ROI)。
在成熟的歐洲市場,嚴格的監管審查與歐盟範圍內5G走廊的推廣之間正在尋求平衡。基礎設施共用框架減少了重複的資本投資,而官民合作關係則為跨境光纖線路資金籌措,這對於互聯貨運等低延遲服務至關重要。同時,在中東,依賴高密度小型基地台網路的智慧城市計畫正在快速推進,非洲電信業者正在利用低軌道(LEO)衛星星系來回回程傳輸遠端通訊覆蓋。在拉丁美洲,已有17個國家推出了5G服務,營運商正在透過組建聯盟租賃海底光纜容量並透過微波網路將其分發到內陸,從而增強國內網路的韌性。
其他好處:
- Excel格式的市場預測(ME)表
- 3個月的分析師支持
目錄
第1章:引言
- 研究假設和市場定義
- 調查範圍
第2章:調查方法
第3章執行摘要
第4章 市場狀況
- 市場概覽
- 市場促進因素
- 行動資料通訊增加及智慧型手機普及
- 5G的快速普及正在推動對容量的需求。
- 雲端原生和開放式無線接取網路架構
- 低地球軌道(LEO)衛星回程傳輸,用於向區域提供服務
- 公共產業公司及私人LTE網路租賃光纖
- 市場限制因素
- 由於光纖和頻段成本高昂,需要大量資金投入。
- 微波頻段授權程序的複雜性
- 超低延遲同步面臨的挑戰
- SDN回程傳輸的網路安全風險
- 價值供應鏈分析
- 監理情勢
- 技術展望
- 波特五力分析
- 投資分析
- 新冠疫情對市場的影響
第5章 市場規模與成長預測
- 不同的發展
- 有線
- 光纖/光學
- 銅線/DSL
- 無線的
- 微波
- 毫米波(E波段和V波段)
- 衛星
- 自由空間光學
- 有線
- 依設備類型
- 路由器和交換機
- 微波無線電
- 光纖傳輸設備
- 小型基地台回程傳輸設備
- 其他
- 按服務類型
- 專業服務
- 託管服務
- 安裝與整合
- 維護和支援
- 透過網路架構
- 大型基地台回程傳輸
- 小型基地台回程傳輸
- 雲端無線存取網/去程傳輸
- 最終用戶
- 行動網路營運商
- 中立主機和塔樓企業
- 網際服務供應商
- 私人公司和公共產業
- 按地區
- 北美洲
- 美國
- 加拿大
- 墨西哥
- 南美洲
- 巴西
- 阿根廷
- 其他南美國家
- 歐洲
- 英國
- 德國
- 法國
- 西班牙
- 義大利
- 俄羅斯
- 其他歐洲國家
- 亞太地區
- 中國
- 印度
- 日本
- 韓國
- 澳洲
- 其他亞太國家
- 中東
- GCC
- 土耳其
- 其他中東國家
- 非洲
- 南非
- 奈及利亞
- 埃及
- 其他非洲國家
- 北美洲
第6章 競爭情勢
- 市場集中度
- 策略趨勢
- 市佔率分析
- 公司簡介
- Market level overview
- Huawei Technologies Co.
- Ericsson AB
- Nokia Corporation
- ZTE Corporation
- NEC Corporation
- Cisco Systems
- Fujitsu Limited
- Aviat Networks
- Ceragon Networks Ltd.
- BridgeWave Communications
- ATandT Inc.
- Verizon Communications Inc.
- Ciena Corporation
- Juniper Networks
- Siklu Communication Ltd.
- Infinera Corporation
- CommScope Holding Company
- Telefonica SA
- Intelsat SA
- Parallel Wireless
第7章 市場機會與未來展望
According to Mordor Intelligence, mobile backhaul market size in 2026 is estimated at USD 40.2 billion, growing from 2025 value of USD 34.97 billion with 2031 projections showing USD 80.65 billion, growing at 14.95% CAGR over 2026-2031.
This report is Segmented by Deployment (Wired [Fiber/Optical and Copper/DSL], Wireless [Microwave, Millimetre-Wave, and More]), Equipment Type (Routers and Switches, Microwave Radios, and More), Service Type (Professional Services, Managed Services, and More), Network Architecture (Macro-Cell Backhaul, and More), End-User (Mobile Network Operators, Neutral-Host and Tower Companies, and More), and Geography.
Global Mobile Backhaul Market Trends and Insights
Growing Mobile Data Traffic & Smartphone Adoption
Average monthly data per smartphone is forecast to soar from 21 GB in 2023 to 56 GB by 2029, with video expected to account for 75% of mobile traffic. Regional divergence is emerging: North American users may hit 66 GB per month while Sub-Saharan Africa lingers near 23 GB, forcing operators to engineer country-specific backhaul mixes. Hybrid topologies that splice fiber trunks with high-band microwave hops now dominate urban densification because they meet capacity needs without prolonged street-dig permitting. Small-cell proliferation adds thousands of short-haul links, prompting fresh investment in automated network-management platforms that can tune capacity per site in real time.
Rapid 5G Rollout Driving Capacity Needs
Base-station density is climbing from 4-5 to 40-50 sites per km2 in 5G clusters, multiplying backhaul terminations. China alone is building more than 600,000 5G macro and small cells, a count projected to outstrip 4G by 1.3-1.5 times . Each 5G cell now requires 10 Gbps uplinks and stringent latency of sub-5 ms, accelerating the adoption of 70/80 GHz E-band radios and time-sensitive networking over fiber. Capital stress is nudging many operators toward shared towers and leased dark fiber, lowering up-front costs while ensuring upgrade paths to 100 Gbps interfaces.
High Capex for Fiber & Spectrum Costs
Fiber trenching in dense cities can run beyond USD 100,000 per Kilometer, a figure that climbs sharply where road-opening permits are scarce. Rising electricity prices also double macro-site power draw when 4G and 5G bands overlap, inflating operational overhead. In developing economies, limited access to low-interest financing delays fiber build-outs, forcing carriers to rely on microwave even where long-term economics favor fiber. The result is uneven quality-of-experience across urban and rural divides, hindering digital-inclusion goals.
Other drivers and restraints analyzed in the detailed report include:
- Cloud-Native & Open RAN Architectures
- Satellite LEO Backhaul for Rural Reach
- SDN Backhaul Cybersecurity Risks
For complete list of drivers and restraints, kindly check the Table Of Contents.
Segment Analysis
Fiber-based links constituted 54.30% of the mobile backhaul market in 2025 due to their unrivalled capacity and low latency. This share translates to the largest deployment slice of the mobile backhaul market size at USD 18.99 billion in 2025. Wireless alternatives, however, are set to post a 16.18% CAGR through 2031, narrowing the gap as urban densification and pop-up events demand rapid turn-ups. Operators mesh 70/80 GHz E-band radios with leased dark fiber trunks, delivering 10 Gbps per hop while avoiding costly civil works.
Hybrid architectures are now standard: fiber remains the preferred medium for core aggregation, but microwave and millimeter-wave serve edge small cells and enterprise venues where permits or geography stall trenching. Emergent W-band and D-band links promise multi-gigabit throughput over 1-2 km, complementing fiber for dense clusters. In sparsely populated regions, operators splice LEO satellite backhaul into microwave rings, creating contiguous coverage without exceeding budget ceilings. This flexibility underpins the long-term competitiveness of the mobile backhaul market.
Microwave radios held 40.55% of the mobile backhaul market size in 2025, reflecting decades of field-proven reliability. Vendors have pushed spectral efficiency to 16 bps/Hz while adding link-bonding schemes that aggregate non-contiguous channels. Small cells backhaul gear, though only a fraction of revenue today, is set for a 17.08% CAGR as stadiums, malls, and transport hubs adopt indoor 5G.
The mobile backhaul market is witnessing a pivot toward integrated access and backhaul (IAB), where a 28 GHz radio simultaneously serves user devices and relays traffic upstream. This reduces rooftop congestion and simplifies zoning. Millimeter-wave chipset advances cut power draw by 30% since 2023, enabling pole-mount and window-mount nodes that require minimum site work. Vendors that bundle self-organizing-network software are winning tenders because they lower truck rolls and optimize link alignment in cluttered environments.
Complete Report Scope:
- By Deployment
- Wired
- Fiber/Optical
- Copper/DSL
- Wireless
- Microwave
- Millimetre-Wave (E- and V-band)
- Satellite
- Free-Space Optics
- Wired
- By Equipment Type
- Routers and Switches
- Microwave Radios
- Optical Transport Equipment
- Small-Cell Backhaul Equipment
- Others
- By Service Type
- Professional Services
- Managed Services
- Installation and Integration
- Maintenance and Support
- By Network Architecture
- Macro-Cell Backhaul
- Small-Cell Backhaul
- Cloud RAN/Fronthaul
- By End-user
- Mobile Network Operators
- Neutral-Host and Tower Companies
- Internet Service Providers
- Private Enterprises and Utilities
- By Geography
- North America
- United States
- Canada
- Mexico
- South America
- Brazil
- Argentina
- Rest of South America
- Europe
- United Kingdom
- Germany
- France
- Spain
- Italy
- Russia
- Rest of Europe
- Asia-Pacific
- China
- India
- Japan
- South Korea
- Australia
- Rest of Asia-Pacific
- Middle East
- GCC
- Turkey
- Rest of Middle East
- Africa
- South Africa
- Nigeria
- Egypt
- Rest of Africa
- North America
Geography Analysis
Asia Pacific commands 34.60% of the mobile backhaul market, expanding at 16.92% CAGR thanks to outsized 5G investments, state subsidies, and dense urban populations. China, Japan, and South Korea already blanket major cities with standalone 5G, driving steep demand for 10 Gbps microwave hops that skirt excavation bottlenecks. India's recent spectrum auctions have unleashed a fiber-laying spree along highways and into tier-2 cities, while operators also pilot satellite-plus-microwave hybrids for Himalayan and island coverage. Government schemes that underwrite rural fiber further sustain momentum.
North America, while smaller by volume, leads innovation in virtualized RAN and dark-fiber aggregation. Verizon and T-Mobile bolstered their optical footprints by acquiring regional fiber players in 2024, locking in scalable backhaul to support fixed-wireless access rollouts. The Federal Communications Commission's USD 9 billion 5G Fund incentivizes cell-site upgrades in remote counties, channeling investments toward microwave and satellite backhaul where terrain hampers trenching. Fixed-mobile convergence accelerates as operators reuse fiber for both gigabit broadband and cell-site uplinks, amplifying return on capital.
Europe's mature markets balance stringent regulatory reviews with a push for pan-EU 5G corridors. Infrastructure-sharing frameworks lower duplicate capex, while public-private partnerships finance cross-border fiber routes vital for low-latency services such as connected freight. Meanwhile, the Middle East fast-tracks smart-city visions that rely on dense small-cell grids, and African carriers tap LEO constellations to backhaul remote coverage islands. Latin America sees 5G launches in 17 countries, with carriers forming consortia to lease submarine-cable capacity and distribute it inland via microwave chains, weaving resilience into national networks.
- Market level overview
- Huawei Technologies Co.
- Ericsson AB
- Nokia Corporation
- ZTE Corporation
- NEC Corporation
- Cisco Systems
- Fujitsu Limited
- Aviat Networks
- Ceragon Networks Ltd.
- BridgeWave Communications
- ATandT Inc.
- Verizon Communications Inc.
- Ciena Corporation
- Juniper Networks
- Siklu Communication Ltd.
- Infinera Corporation
- CommScope Holding Company
- Telefonica S.A.
- Intelsat S.A.
- Parallel Wireless
Additional Benefits:
- The market estimate (ME) sheet in Excel format
- 3 months of analyst support
TABLE OF CONTENTS
1 INTRODUCTION
- 1.1 Study Assumptions and Market Definition
- 1.2 Scope of the Study
2 RESEARCH METHODOLOGY
3 EXECUTIVE SUMMARY
4 MARKET LANDSCAPE
- 4.1 Market Overview
- 4.2 Market Drivers
- 4.2.1 Growing mobile data traffic and smartphone adoption
- 4.2.2 Rapid 5G rollout driving capacity needs
- 4.2.3 Cloud-native and Open RAN architectures
- 4.2.4 Satellite LEO backhaul for rural reach
- 4.2.5 Fiber leasing by utilities and private LTE networks
- 4.3 Market Restraints
- 4.3.1 High capex for fiber and spectrum costs
- 4.3.2 Microwave spectrum licensing complexity
- 4.3.3 Ultra-low-latency synchronisation challenges
- 4.3.4 SDN backhaul cybersecurity risks
- 4.4 Value/Supply-Chain Analysis
- 4.5 Regulatory Landscape
- 4.6 Technological Outlook
- 4.7 Porter's Five Forces Analysis
- 4.7.1 Threat of New Entrants
- 4.7.2 Bargaining Power of Buyers
- 4.7.3 Bargaining Power of Suppliers
- 4.7.4 Threat of Substitutes
- 4.7.5 Intensity of Competitive Rivalry
- 4.8 Investment Analysis
- 4.9 Impact of COVID-19 on the Market
5 MARKET SIZE AND GROWTH FORECASTS (VALUE)
- 5.1 By Deployment
- 5.1.1 Wired
- 5.1.1.1 Fiber/Optical
- 5.1.1.2 Copper/DSL
- 5.1.2 Wireless
- 5.1.2.1 Microwave
- 5.1.2.2 Millimetre-Wave (E- and V-band)
- 5.1.2.3 Satellite
- 5.1.2.4 Free-Space Optics
- 5.1.1 Wired
- 5.2 By Equipment Type
- 5.2.1 Routers and Switches
- 5.2.2 Microwave Radios
- 5.2.3 Optical Transport Equipment
- 5.2.4 Small-Cell Backhaul Equipment
- 5.2.5 Others
- 5.3 By Service Type
- 5.3.1 Professional Services
- 5.3.2 Managed Services
- 5.3.3 Installation and Integration
- 5.3.4 Maintenance and Support
- 5.4 By Network Architecture
- 5.4.1 Macro-Cell Backhaul
- 5.4.2 Small-Cell Backhaul
- 5.4.3 Cloud RAN/Fronthaul
- 5.5 By End-user
- 5.5.1 Mobile Network Operators
- 5.5.2 Neutral-Host and Tower Companies
- 5.5.3 Internet Service Providers
- 5.5.4 Private Enterprises and Utilities
- 5.6 By Geography
- 5.6.1 North America
- 5.6.1.1 United States
- 5.6.1.2 Canada
- 5.6.1.3 Mexico
- 5.6.2 South America
- 5.6.2.1 Brazil
- 5.6.2.2 Argentina
- 5.6.2.3 Rest of South America
- 5.6.3 Europe
- 5.6.3.1 United Kingdom
- 5.6.3.2 Germany
- 5.6.3.3 France
- 5.6.3.4 Spain
- 5.6.3.5 Italy
- 5.6.3.6 Russia
- 5.6.3.7 Rest of Europe
- 5.6.4 Asia-Pacific
- 5.6.4.1 China
- 5.6.4.2 India
- 5.6.4.3 Japan
- 5.6.4.4 South Korea
- 5.6.4.5 Australia
- 5.6.4.6 Rest of Asia-Pacific
- 5.6.5 Middle East
- 5.6.5.1 GCC
- 5.6.5.2 Turkey
- 5.6.5.3 Rest of Middle East
- 5.6.6 Africa
- 5.6.6.1 South Africa
- 5.6.6.2 Nigeria
- 5.6.6.3 Egypt
- 5.6.6.4 Rest of Africa
- 5.6.1 North America
6 COMPETITIVE LANDSCAPE
- 6.1 Market Concentration
- 6.2 Strategic Moves
- 6.3 Market Share Analysis
- 6.4 Company Profiles (includes Global level Overview)
- 6.4.1 Market level overview
- 6.4.2 Huawei Technologies Co.
- 6.4.3 Ericsson AB
- 6.4.4 Nokia Corporation
- 6.4.5 ZTE Corporation
- 6.4.6 NEC Corporation
- 6.4.7 Cisco Systems
- 6.4.8 Fujitsu Limited
- 6.4.9 Aviat Networks
- 6.4.10 Ceragon Networks Ltd.
- 6.4.11 BridgeWave Communications
- 6.4.12 ATandT Inc.
- 6.4.13 Verizon Communications Inc.
- 6.4.14 Ciena Corporation
- 6.4.15 Juniper Networks
- 6.4.16 Siklu Communication Ltd.
- 6.4.17 Infinera Corporation
- 6.4.18 CommScope Holding Company
- 6.4.19 Telefonica S.A.
- 6.4.20 Intelsat S.A.
- 6.4.21 Parallel Wireless
7 MARKET OPPORTUNITIES AND FUTURE OUTLOOK
- 7.1 White-space and Unmet-need Assessment

 全球低地球軌道(LEO)衛星回程傳輸市場:按產品、應用、頻段和最終用戶分類-市場規模、產業動態、機會分析和預測(2026-2035 年)衛星回程傳輸和乾線傳輸:2025-2035 年的趨勢和預測
 智慧無線回程傳輸市場預測至2034年-全球分析(按組件、網路類型、頻段、部署模式、技術、應用、最終用戶和地區分類)行動回程市場預測至2034年-全球分析(按組件、網路世代、技術、應用、最終用戶和區域分類)
 2026年全球回程傳輸市場報告2026年全球衛星回程傳輸市場報告
 光纖行動回程系統:市場佔有率分析、產業趨勢與統計、成長預測(2026-2031)2026年5G去程傳輸全球市場報告2026年全球5G去程傳輸與回程傳輸設備市場報告2026年全球無線和行動回程設備市場報告