


 |
市場調查報告書
商品編碼
2122000
活性碳:市場佔有率分析、行業趨勢和統計數據、成長預測(2026-2031)Activated Carbon - Market Share Analysis, Industry Trends & Statistics, Growth Forecasts (2026 - 2031) |
||||||

※ 本網頁內容可能與最新版本有所差異。詳細情況請與我們聯繫。
根據 Mordor Intelligence 估計,活性碳市場在 2026 年的價值為 41.6 億美元,預計到 2031 年將達到 54.7 億美元,在預測期(2026-2031 年)內以 5.62% 的複合年成長率成長。
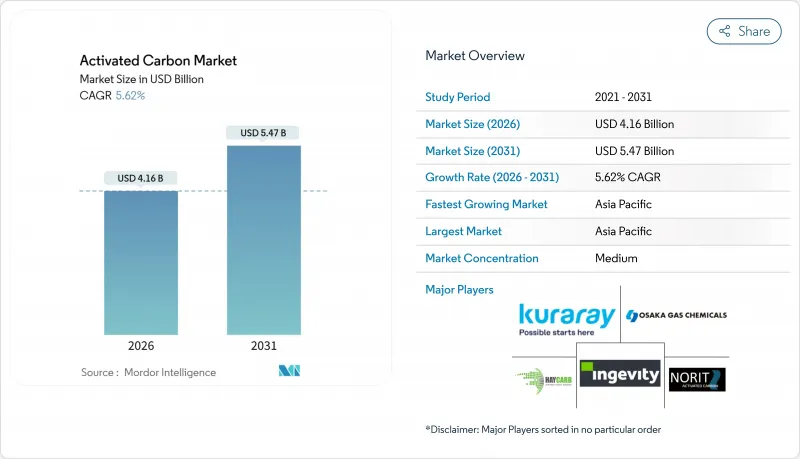
本報告按原料(煤基、椰殼基、木基等)、形態(粉末、顆粒、擠壓/造粒)、應用(脫色、製糖、濃縮、溶劑回收等)、最終用戶(水處理、工業處理等)和地區(亞太地區、北美地區等)進行細分。市場預測以美元計價。
全球活性碳市場趨勢與洞察
對水淨化的需求日益成長
全球監管機構不斷降低可接受污染物的閾值,刺激了對高容量顆粒活性碳(GAC)過濾器前所未有的投資。光是美國環保署(EPA)的PFAS法規就迫使數百家美國公共產業簽訂多年供應契約,例如美國水務公司與卡爾岡炭素公司達成的覆蓋10個州的協議。歐洲公共產業在修訂後的飲用水指令下也面臨類似的壓力,而印度和中國的市政當局正在加速產能擴張,以滿足不斷成長的人口需求。公用事業公司在權衡廢棄物管理的長期責任與高昂的初始投資時,其偏好正從顆粒活性碳(PAC)轉向可再生GAC系統。隨著公共產業優先考慮循環採購框架,能夠確保未使用供應和重新運作服務的供應商正享有競爭優勢。
燃煤發電廠的汞去除義務
修訂後的汞和空氣危害標準,以及中國和印度類似的法規,正在推動對用於煙氣噴吹的粉末狀煤和浸漬煤的需求。雖然一些燃煤發電廠已經退役,但剩餘的電廠被迫升級其捕集系統,從而維持了穩定的訂單量,儘管存在區域差異。在日本,儘管大規模脫碳工作正在推進,但嚴格的排放法規維持了穩定的基準需求。由於汞捕集技術的長期複雜性,專門生產溴化煤和鹵化煤的供應商獲得了高額利潤。
椰殼炭供應鏈中斷
除了天氣原因導致椰殼收成大幅下降外,出口限制和來自煤球等替代品的競爭也使得椰殼炭供應趨緊。 2024年,印尼椰殼炭的出口量和出口額均下降,導致價格飆升。在北美和歐洲,買家面臨更長的前置作業時間時間和更高的成本,尤其因為PFAS去除標準往往優先考慮椰殼炭。生產商正在轉向木材、泥炭和低等級木炭等原料,但這些替代品在微孔分佈方面目前仍不及椰殼炭,而微孔分佈對於有效吸附微量污染物至關重要。因此,在大型、多年期公共產業競標中,原物料風險管理能力已成為關鍵的區分因素。
細分市場分析
截至2025年,煤基活性碳產品在活性碳市場仍佔據43.18%的市場佔有率,這主要得益於其有利的成本結構以及在中國、印度和美國龐大的供應基礎。椰殼活性碳雖然產量較低,但預計仍將以6.78%的複合年成長率成長,因為監管機構和高純度用戶看重其超細孔隙網路,這種網路能有效去除PFAS和藥物殘留。因此,預計到2031年,椰殼活性碳市場的成長速度將超過所有其他原料類別。由於供應商對沖煤炭和椰殼價格波動風險,原料多元化正在加速推進,包括泥炭和褐煤的初步試驗。
在2024年至2025年椰殼供不應求期間,擁有多種原料組合的生產商展現出強大的韌性,透過轉向使用化學活化木材和低品位煤炭的混合物來維持合約數量。一篇發表於2024年的技術論文展示了使用鈦鐵礦和氧化鐵成功活化褐煤,使其碘含量達到與優質椰殼活性碳相當的水平。終端用戶買家越來越重視整個生命週期的溫室氣體排放情況,要求供應商量化原料採購、活化能和重新運作循環的排放強度。雖然煤炭預計仍將在以成本為導向的市政競標中佔據主導地位,但椰殼和木材衍生的活性碳有望佔據一個高價值的細分市場,在該市場中,其吸附性能遠超單位成本。
到2025年,顆粒活性碳(PAC)將佔活性碳市場規模的47.86%。這主要得益於糖業、飲料業和間歇式水處理等大批量應用領域對快速反應速率和便捷計量的要求。同時,隨著公共產業採用現場或本地重新運作製程以降低整體擁有成本,塊狀活性碳(GAC)預計將以6.30%的複合年成長率成長。主要供應商正在瑞典、法國和美國墨西哥灣沿岸地區申請新建燒結爐的許可證,有利於當地循環經濟的發展,從而減少運輸距離和範圍3排放。在活性碳市場,擠壓成型和顆粒成型產品的佔有率正在擴大,尤其是在廢氣處理和汽車蒸發排放控制等領域,這些領域對高機械強度和低壓降的要求很高。
從生命週期經濟學的角度來看,顆粒活性碳(GAC)具有優勢,促使更多市政競標選擇可再生系統。聚合活性碳(PAC)在糖脫色和間歇式批次應用中仍然佔據優勢,因為其廢棄填料的處理方式與現有的污泥管理規範相符。混合策略也正在興起。工廠在基本流量下使用顆粒活性碳層,而在負荷突然增加時則使用聚合活性碳層,確保符合法規要求的柔軟性,同時避免在再生設施方面過度投資。因此,同時提供聚合活性碳和顆粒活性碳產品系列的供應商可以滿足客戶不同的風險接受度和現金流限制。
區域分析
預計到2025年,亞太地區將佔全球銷售額的37.72%,並在2031年之前保持6.44%的複合年成長率,這主要得益於中國煤改碳一體化、印度快速發展的市政基礎設施以及東協國家椰殼炭出口的成長。 2024年,印度出口商增加了椰殼活性碳的出貨量,尤其是對美國、斯里蘭卡和比利時的出口。同時,中國生產商正在利用焦爐廢氣來降低活化能耗成本。在日益成長的脫碳努力下,日本電力公司對汞控制的活性碳的需求仍然強勁。
北美活性碳市場正受到PFAS法規的反應以及向國內顆粒活性碳(GAC)產能的重大轉變的影響。 Arq將於2025年在路易斯安那州運作建立該地區首個垂直整合的原生碳資產。 Calgon Carbon於2024年擴大了在墨西哥灣沿岸地區的重新運作能,並於2025年啟動了「Operation Bedlock」計劃,以確保向主要電力公司長期供應活性碳。由於洲際貿易協定,加拿大和墨西哥的買家受益於更短的交貨時間。
法國、瑞典和英國新建的重新運作中心縮短了廢棄活性碳的運輸距離,凸顯了歐洲對循環經濟的承諾。修訂後的飲用水指令強制規定了全氟烷基和多氟烷基物質(PFAS)的基準值,促使歐洲進行與美國類似的設備升級。在德國、義大利、西班牙和北歐國家,由於沼氣提煉和工業揮發性有機化合物(VOC)的減少,活性碳的需求正在逐漸增加。在南美洲,隨著巴西和阿根廷擴大都市污水處理網路,活性碳的需求在較低基數的基礎上成長。同時,在中東和非洲,與海水淡化和黃金提煉計畫相關的活性碳部署尚處於早期階段,但與其他地區相比規模仍然較小。
其他好處:
- Excel格式的市場預測(ME)表
- 3個月的分析師支持
目錄
第1章:引言
- 研究假設和市場定義
- 調查範圍
第2章:調查方法
第3章執行摘要
第4章 市場狀況
- 市場概覽
- 市場促進因素
- 對水質淨化的需求不斷成長
- 燃煤發電廠的汞去除義務
- 對低硫燃料的限制大幅增加,推高了用於溶劑回收的活性碳的需求。
- 提高小規模廠的沼氣淨化和硫化氫去除率
- 活性碳在空氣淨化上的應用日益廣泛
- 市場限制因素
- 椰殼炭供應鏈中斷
- 煤炭價格波動給利潤率帶來了壓力。
- 對區域振興中心的高資本投資
- 價值鏈分析
- 波特五力模型
第5章 市場規模與成長預測
- 按成分
- 煤基
- 源自椰子殼
- 木質的
- 其他(泥炭、褐煤等)
- 按形狀
- 粉末活性碳(PAC)
- 顆粒活性碳(GAC)
- 擠壓/造粒活性碳(EAC)
- 透過使用
- 漂白處理
- 糖的生產
- 濃縮過程
- 溶劑回收
- PFAS吸附處理
- 飲用水處理
- 其他用途
- 按最終用戶行業分類
- 水處理
- 工業加工
- 衛生保健
- 食品/飲料
- 車
- 其他終端用戶產業
- 按地區
- 亞太地區
- 中國
- 印度
- 日本
- 韓國
- 東南亞國協
- 其他亞太國家
- 北美洲
- 美國
- 加拿大
- 墨西哥
- 歐洲
- 德國
- 英國
- 法國
- 義大利
- 西班牙
- 北歐國家
- 其他歐洲國家
- 南美洲
- 巴西
- 阿根廷
- 其他南美國家
- 中東和非洲
- 沙烏地阿拉伯
- 南非
- 其他中東和非洲國家
- 亞太地區
第6章 競爭情勢
- 市場集中度
- 策略趨勢
- 市佔率和排名分析
- 公司簡介
- Albemarle Corporation
- Arq, Inc.
- Carbon Activated Corporation
- CarboTech
- Donau Carbon GmbH
- Haycarb PLC
- Ingevity
- KALPAKA Chemicals
- KURARAY CO., LTD.
- MICBAC India
- Nanping Yuanli Active Carbon Company
- Norit
- Osaka Gas Chemicals Co., Ltd.
- Puragen
- Rotocarb(PTY)Ltd.
- Shanghai Activated Carbon Co.,Ltd
- Silcarbon Aktivkohle GmbH
- Suneeta Carbons
- Xylem
第7章 市場機會與未來展望
According to Mordor Intelligence, the activated carbon market size is estimated at USD 4.16 billion in 2026, and is expected to reach USD 5.47 billion by 2031, at a CAGR of 5.62% during the forecast period (2026-2031).
This report is Segmented by Raw Material (Coal-Based, Coconut-Shell-Based, Wood-Based, and Other), Form (Powdered, Granular, and Extruded/Pelletised), Application (Decolorisation, Sugar Production, Concentration, Solvent Recovery, and More), End-User (Water Treatment, Industrial Processing, and More), and Geography (Asia-Pacific, North America, and More). Market Forecasts are Provided in Terms of Value (USD).
Global Activated Carbon Market Trends and Insights
Growing Demand for Water Purification
Regulators worldwide continue to ratchet down allowable contaminant thresholds, driving unprecedented investment in high-capacity GAC filters. The EPA's PFAS rule alone is forcing hundreds of U.S. utilities to lock in multi-year supply contracts, such as American Water's ten-state deal with Calgon Carbon. European utilities face similar pressure under the updated Drinking Water Directive, while Indian and Chinese municipalities accelerate capacity to meet population-driven demand. The preference is shifting from PAC toward regenerable GAC systems, as operators weigh long-term disposal liabilities against higher up-front capital outlays. Suppliers able to guarantee both virgin supply and reactivation services enjoy a competitive advantage as utilities prioritize circular procurement frameworks.
Mercury-Removal Mandates for Coal-Fired Plants
Revised Mercury and Air Toxics Standards in the United States, coupled with comparable rules in China and India, are reinforcing demand for powdered and impregnated carbons designed for flue-gas injection. Although portions of the coal fleet are retiring, remaining units must upgrade capture systems, sustaining a durable, if regionally uneven, order pipeline. Japan's strict emission controls add a steady baseline demand despite the country's broader decarbonization push. Suppliers specializing in brominated or halogenated grades secure premium margins thanks to the technical complexity of long-duration mercury capture.
Supply-Chain Disruption for Coconut-Shell Charcoal
Weather-related harvest shocks, coupled with export restrictions and competition from alternatives like briquettes, have led to a tightening of coconut-shell charcoal supplies. In 2024, Indonesia saw its exports drop in volume and value. This decline caused prices to surge. In North America and Europe, buyers contended with longer lead times and heightened costs, especially since PFAS removal standards leaned towards coconut-shell grades. While producers are branching out into wood, peat, and low-rank coal precursors, these substitutes fall short in micropore distribution, which is crucial for effective trace-contaminant adsorption. As a result, adept feedstock risk management has emerged as a key differentiator in extensive, multi-year utility tenders.
Other drivers and restraints analyzed in the detailed report include:
- Surge in Low-Sulphur Fuel Regulations Boosting Solvent Recovery
- Increasing Biogas Upgrading and H2S Scrubbing at Small-Scale Plants
- Coal-Price Volatility Squeezing Margins
For complete list of drivers and restraints, kindly check the Table Of Contents.
Segment Analysis
Coal-derived products retained 43.18% of the activated carbon market share in 2025 because of their favorable cost structure and extensive supply footprints in China, India, and the United States. Coconut-shell-based carbons, while smaller in tonnage, are projected to expand at a 6.78% CAGR as regulators and high-purity users favor their ultrafine micropore network for PFAS and pharmaceutical removal. The activated carbon market size for coconut-shell grades is therefore expected to outpace every other raw-material category through 2031. Feedstock diversification, including pilot work on peat and lignite, is accelerating as suppliers hedge against both coal and coconut price swings.
Producers with multi-feedstock portfolios demonstrated greater resilience during the 2024-2025 coconut-shell shortfall, maintaining contractual volumes by switching to chemically activated wood or low-rank coal blends. Technical papers published in 2024 showed successful ilmenite- and iron-oxide-assisted activation of lignite, yielding iodine numbers comparable to premium coconut carbons. End-use buyers increasingly evaluate lifecycle greenhouse-gas profiles, pushing suppliers to quantify emission intensity across precursor sourcing, activation energy, and reactivation cycles. Coal will remain dominant in cost-sensitive municipal tenders, yet coconut-shell and wood grades are positioned to capture value-added niches where adsorption performance outweighs unit price.
PAC represented 47.86% of the activated carbon market size in 2025, anchored in large-volume sugar, beverage, and batch water-treatment applications that value fast kinetics and straightforward dosing. GAC, however, is forecast to grow at a 6.30% CAGR as utilities embrace on-site or regional reactivation to trim the total cost of ownership. Major suppliers secured permits for new furnaces in Sweden, France, and the U.S. Gulf Coast, underpinning a regional circular economy that reduces haul-back distances and Scope 3 emissions. The activated carbon market sees extruded and pelletized shapes gaining share in flue-gas and automotive evaporative-emission control, where high mechanical strength and low pressure drop are essential.
Lifecycle economics favor GAC, tipping more municipal bidders toward regenerable systems. PAC remains entrenched in sugar decolorization and intermittent batch uses where spent media disposal aligns with existing sludge management practices. Hybrid strategies are emerging: plants dose PAC for shock-load events while maintaining base-flow GAC beds, enabling compliance flexibility without overcapitalizing reactivation assets. Suppliers leveraging both PAC and GAC portfolios can therefore align with diverse customer risk appetites and cash-flow constraints.
Complete Report Scope:
- By Raw Material
- Coal-Based
- Coconut-Shell-Based
- Wood-Based
- Other (Peat, Lignite, etc.)
- By Form
- Powdered Activated Carbon (PAC)
- Granular Activated Carbon (GAC)
- Extruded/Pelletised Activated Carbon (EAC)
- By Application
- Decolorisation Treatment
- Sugar Production
- Concentration Treatment
- Solvent Recovery
- PFAS Adsorption Treatment
- Drinking Water Treatment
- Other Applications
- By End-user Industry
- Water Treatment
- Industrial Processing
- Healthcare
- Food and Beverage
- Automotive
- Other End-user Industries
- By Geography
- Asia-Pacifc
- China
- India
- Japan
- South Korea
- ASEAN Countries
- Rest of Asia-Pacific
- North America
- United States
- Canada
- Mexico
- Europe
- Germany
- United Kingdom
- France
- Italy
- Spain
- NORDIC Countries
- Rest of Europe
- South America
- Brazil
- Argentina
- Rest of South America
- Middle-East and Africa
- Saudi Arabia
- South Africa
- Rest of Middle-East and Africa
- Asia-Pacifc
Geography Analysis
Asia-Pacific retained 37.72% of 2025 revenue and is anticipated to post a 6.44% CAGR through 2031, driven by Chinese coal-to-carbon integration, India's burgeoning municipal buildout, and ASEAN's expanding coconut-shell charcoal exports. In 2024, Indian exporters boosted shipments of coconut-shell carbon, with notable exports flowing to the United States, Sri Lanka, and Belgium. Meanwhile, Chinese producers are harnessing coke-oven off-gases to cut down on activation energy costs. Despite wider decarbonization initiatives, Japanese utilities continue to show a strong demand for mercury-control carbons.
North America's activated carbon market is shaped by PFAS compliance and a decisive pivot toward domestic GAC capacity. Arq commissioned a line in Louisiana during 2025, marking the region's first vertically integrated virgin-carbon asset. Calgon Carbon expanded Gulf Coast reactivation capacity in 2024 and launched "Operation Bedrock" in 2025 to secure long-term supply for major utilities. Canadian and Mexican buyers benefit from shorter delivery lead times under continental trade agreements.
New reactivation hubs in France, Sweden, and the United Kingdom are cutting spent-carbon shipping distances, underscoring Europe's commitment to circularity. The revised Drinking Water Directive enforces PFAS group limits, prompting capital upgrades analogous to U.S. programs. Germany, Italy, Spain, and the Nordics add incremental demand from biogas upgrading and industrial VOC abatement. South America grows from a low base as Brazil and Argentina expand municipal networks, while the Middle East and Africa see early-stage adoption tied to desalination and gold-processing projects, though volumes remain modest relative to other regions.
- Albemarle Corporation
- Arq, Inc.
- Carbon Activated Corporation
- CarboTech
- Donau Carbon GmbH
- Haycarb PLC
- Ingevity
- KALPAKA Chemicals
- KURARAY CO., LTD.
- MICBAC India
- Nanping Yuanli Active Carbon Company
- Norit
- Osaka Gas Chemicals Co., Ltd.
- Puragen
- Rotocarb (PTY) Ltd.
- Shanghai Activated Carbon Co.,Ltd
- Silcarbon Aktivkohle GmbH
- Suneeta Carbons
- Xylem
Additional Benefits:
- The market estimate (ME) sheet in Excel format
- 3 months of analyst support
TABLE OF CONTENTS
1 Introduction
- 1.1 Study Assumptions and Market Definition
- 1.2 Scope of the Study
2 Research Methodology
3 Executive Summary
4 Market Landscape
- 4.1 Market Overview
- 4.2 Market Drivers
- 4.2.1 Growing demand for water purification
- 4.2.2 Mercury-removal mandates for coal-fired plants
- 4.2.3 Surge in low-sulphur fuel regulations boosting solvent-recovery activated carbon
- 4.2.4 Increasing Bio-gas upgrading and H2S scrubbing at small-scale plants
- 4.2.5 Growing usage of activated carbon for air purification
- 4.3 Market Restraints
- 4.3.1 Supply-chain disruption for coconut shell charcoal
- 4.3.2 Coal-price volatility squeezing margins
- 4.3.3 High cap-ex for regional reactivation hubs
- 4.4 Value Chain Analysis
- 4.5 Porter's Five Forces
- 4.5.1 Bargaining Power of Suppliers
- 4.5.2 Bargaining Power of Buyers
- 4.5.3 Threat of New Entrants
- 4.5.4 Threat of Substitutes
- 4.5.5 Degree of Competition
5 Market Size and Growth Forecasts (Value and Volume)
- 5.1 By Raw Material
- 5.1.1 Coal-Based
- 5.1.2 Coconut-Shell-Based
- 5.1.3 Wood-Based
- 5.1.4 Other (Peat, Lignite, etc.)
- 5.2 By Form
- 5.2.1 Powdered Activated Carbon (PAC)
- 5.2.2 Granular Activated Carbon (GAC)
- 5.2.3 Extruded/Pelletised Activated Carbon (EAC)
- 5.3 By Application
- 5.3.1 Decolorisation Treatment
- 5.3.2 Sugar Production
- 5.3.3 Concentration Treatment
- 5.3.4 Solvent Recovery
- 5.3.5 PFAS Adsorption Treatment
- 5.3.6 Drinking Water Treatment
- 5.3.7 Other Applications
- 5.4 By End-user Industry
- 5.4.1 Water Treatment
- 5.4.2 Industrial Processing
- 5.4.3 Healthcare
- 5.4.4 Food and Beverage
- 5.4.5 Automotive
- 5.4.6 Other End-user Industries
- 5.5 By Geography
- 5.5.1 Asia-Pacifc
- 5.5.1.1 China
- 5.5.1.2 India
- 5.5.1.3 Japan
- 5.5.1.4 South Korea
- 5.5.1.5 ASEAN Countries
- 5.5.1.6 Rest of Asia-Pacific
- 5.5.2 North America
- 5.5.2.1 United States
- 5.5.2.2 Canada
- 5.5.2.3 Mexico
- 5.5.3 Europe
- 5.5.3.1 Germany
- 5.5.3.2 United Kingdom
- 5.5.3.3 France
- 5.5.3.4 Italy
- 5.5.3.5 Spain
- 5.5.3.6 NORDIC Countries
- 5.5.3.7 Rest of Europe
- 5.5.4 South America
- 5.5.4.1 Brazil
- 5.5.4.2 Argentina
- 5.5.4.3 Rest of South America
- 5.5.5 Middle-East and Africa
- 5.5.5.1 Saudi Arabia
- 5.5.5.2 South Africa
- 5.5.5.3 Rest of Middle-East and Africa
- 5.5.1 Asia-Pacifc
6 Competitive Landscape
- 6.1 Market Concentration
- 6.2 Strategic Moves
- 6.3 Market Share(%)/Ranking Analysis
- 6.4 Company Profiles
- 6.4.1 Albemarle Corporation
- 6.4.2 Arq, Inc.
- 6.4.3 Carbon Activated Corporation
- 6.4.4 CarboTech
- 6.4.5 Donau Carbon GmbH
- 6.4.6 Haycarb PLC
- 6.4.7 Ingevity
- 6.4.8 KALPAKA Chemicals
- 6.4.9 KURARAY CO., LTD.
- 6.4.10 MICBAC India
- 6.4.11 Nanping Yuanli Active Carbon Company
- 6.4.12 Norit
- 6.4.13 Osaka Gas Chemicals Co., Ltd.
- 6.4.14 Puragen
- 6.4.15 Rotocarb (PTY) Ltd.
- 6.4.16 Shanghai Activated Carbon Co.,Ltd
- 6.4.17 Silcarbon Aktivkohle GmbH
- 6.4.18 Suneeta Carbons
- 6.4.19 Xylem
7 Market Opportunities and Future Outlook
- 7.1 White-space and Unmet-Need Assessment
- 7.2 Rising PFAS-remediation spend by utilities

 2026-2030年全球活性碳市場
 歐洲活性碳:市場佔有率分析、產業趨勢與統計、成長預測(2026-2031)美國活性碳:市場佔有率分析、行業趨勢和統計數據、成長預測(2026-2031)
 活性碳市場:2026-2032年全球市場預測(依產品類型、原料、孔徑分佈、活化製程、終端應用產業及應用領域分類)碳排放預測和情境建模軟體:市場佔有率分析、行業趨勢和統計數據、成長預測(2026-2031 年)
 煤的活性炭市場規模、佔有率和成長分析:按產品類型、活化製程、應用、終端用戶產業和地區分類-2026-2033年產業預測
 活性碳產品市場-全球產業規模、佔有率、趨勢、機會和預測:按原料、應用、分銷通路、地區和競爭格局分類,2021-2031年煤的活性炭:市場佔有率分析、產業趨勢與統計、成長預測(2026-2031)
 活性碳市場:依產品類型、原料類型、最終用戶和地區分類廢氣吸附淨化系統市場:依技術、吸附劑類型、產品類型、運作模式、流量、應用和最終用戶分類-2026-2032年全球預測