


 |
市場調查報告書
商品編碼
2121950
小規模液化天然氣:市場佔有率分析、行業趨勢和統計數據、成長預測(2026-2031 年)Small-scale LNG - Market Share Analysis, Industry Trends & Statistics, Growth Forecasts (2026 - 2031) |
||||||

※ 本網頁內容可能與最新版本有所差異。詳細情況請與我們聯繫。
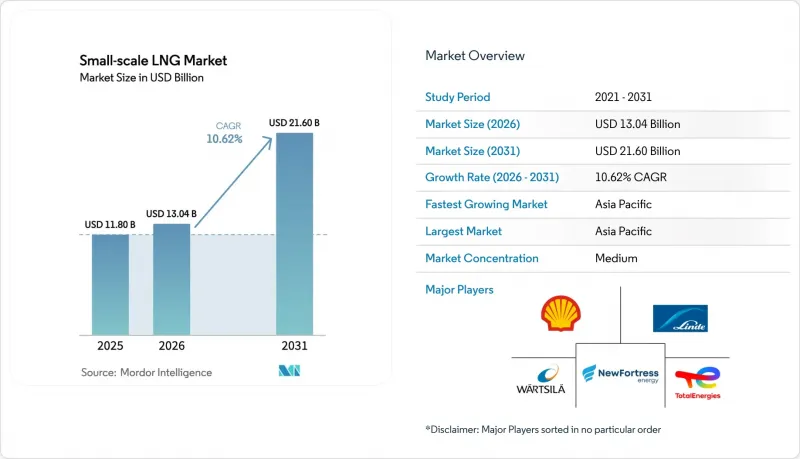
根據 Mordor Intelligence 預測,小規模天然氣市場預計將從 2025 年的 118 億美元成長到 2026 年的 130.4 億美元,到 2031 年達到 216 億美元,2026 年至 2031 年的複合年成長率為 10.62%。
本報告按類型(液化終端、再氣化終端)、供應方式(卡車、管道和鐵路、轉運和燃料庫、ISO集裝箱)、應用(運輸、發電等)、最終用戶(公共產業、獨立發電商 (IPP)、上游油氣公司等)和地區(北美、歐洲、亞太地區、南美、中東和非洲)進行分類。
全球小規模天然氣市場趨勢及洞察
國際海事組織和歐盟海事燃料協會收緊硫含量限制,正在加速船舶採用液化天然氣燃料庫。
國際海事組織(IMO)將全球船舶含硫量上限設定為0.50%,歐盟的FuelEU Maritime溫室氣體排放法規正在推動船用燃料的經濟效益轉移到液化天然氣(LNG)。透過轉向LNG動力,船東可以避免數百萬美元的脫硫裝置改造費用,同時減少二氧化碳、硫氧化物和顆粒物排放。到2024年底,全球LNG加註船隊規模將達到61艘,其中西北歐、地中海和亞洲的船舶最為集中。 2024年,道達爾能源在阿曼杜庫姆港開設了一座專用加註碼頭,為航行於阿拉伯海的船舶提供服務。由於FuelEU Maritime法規要求計算甲烷洩漏量,引擎製造商正在加速採用高壓噴射系統,將未燃燒甲烷的排放量降低到1%以下。這些努力正在促進小規模LNG市場基礎設施的可靠性和監管確定性。
快速開發用於偏遠礦山和離網發電的模組化液化裝置。
標準化的微型和小型液化裝置能夠以每天僅1萬加侖的處理能力,將滯留氣體和小規模聯產氣轉化為經濟效益,即使沒有管道連接也能實現。 Chart Industries公司的IPSMR®製程每生產1公斤液化天然氣耗電量低於0.35千瓦時,即使使用現場可再生能源或發電機供電,也能實現離網運作。在澳洲的礦山,容器化天然氣正被用於取代1000多公里卡車運輸的柴油,從而降低了40%的燃料物流成本。在島國印度尼西亞,虛擬管道正被用於將ISO儲槽從天然氣豐富的島嶼運輸到人口稠密的地區,避免了建造數十億美元的海底管線。對於人均月產量低於0.05噸的工廠來說,蒸發損失仍然是一個挑戰,但透過向現場發電機供應蒸氣的混合解決方案,可以回收高達80%的天然氣價值。由於資本成本降低和離網需求增加,模組化液化技術正在支持小規模液化天然氣市場的長期成長。
俄烏衝突推高了現貨液化天然氣的地緣政治風險溢酬。
2022年衝突升級導致俄羅斯輸往歐洲的管道天然氣供應減少1550億立方米,液化天然氣現貨價格飆升至每百萬英熱單位25美元,預計到2024年底將回落至每百萬英熱單位10-14美元。由於供應商力推與現貨價格掛鉤的合約條款,燃料庫和市政部門的小規模買家難以獲得長期固定價格合約。亞洲進口商與歐洲爭奪貨源,導致東南亞和加勒比海地區的供應轉向其他地區。對北極液化天然氣2號計畫的製裁導致預計年產量減少1,980萬噸,促使其他生產商加強維持價格紀律的承諾。買家正在增加儲存能力以對沖價格波動風險,但引入儲存槽再氣化裝置(FSRU)需要額外5000萬至1億美元的資金,這削弱了液化天然氣相對於柴油的成本優勢。這些不確定性正在減緩小規模液化天然氣市場的短期成長。
細分市場分析
2025年,液化終端將佔小規模液化天然氣市場的62.3%,反映出經濟有效利用先前未充分利用的天然氣資產的必要性。許多微型工廠的年運作低於0.1百萬噸,採用高效率的IPSMR®技術,液化率超過90%。小規模工廠用於沼氣淨化、廢氣回收和偏遠地區供電,而微型和小規模工廠則負責出口和向區域樞紐供貨。符合ISO 14001標準加強了環境監管,同時也促進了綠色金融的應用。資本密集度為每噸年產能400至800美元,即使在新興市場,這一水準現在也能實現。
至2031年,再氣化技術將以14.4%的複合年成長率快速發展。諸如Hoegh Esperanza和Hoegh Gannet等浮式儲存再氣化裝置(FSRU)可在18個月內向德國天然氣管網每年供應100億立方米天然氣,從而將陸上設施的建設週期從五年縮短至一年。位於菲律賓的BW Mindanao FSRU每年向呂宋島供應500萬噸天然氣,使得一座2,400兆瓦的燃煤電廠得以退役。在排放控制區強制安裝的蒸氣回收系統會增加300萬至500萬美元的額外成本,但符合歐盟燃料排放法規(FuelEU)。租賃FSRU的日租金為8萬至15萬美元,為買家提供了固定終端所不具備的柔軟性,從而提升了小規模液化天然氣市場的吸引力。
2025年,主要依靠中國大型液化天然氣運輸車的卡車運輸將佔52.6%的市場。標準拖車的負載容量為20-25噸,足以滿足一台5兆瓦鍋爐兩天的運作,使買家無需支付管道輸送費用。 Hexagon Purus公司於2024年推出的複合材料氣瓶可將拖車重量減輕40%,即使在限重的歐洲路線上也能實現高達28噸的載重。 ISO貨櫃支援多式聯運,可降低高達30%的裝卸成本。
轉運和燃料庫正以14.7%的複合年成長率快速成長,到2027年,全球將新增18艘加油船。新加坡在2024年發放了12家燃料庫業者的許可證,使其處理能力提升至45萬噸。在西北歐,目前有29艘加油船投入運營,預計2024年將完成1200次港口停靠。隨著硫和二氧化碳排放法規的日益嚴格,船對船和岸對船的燃料轉運正成為小規模液化天然氣市場中快速成長的樞紐。
區域分析
到2025年,亞太地區將佔小規模液化天然氣市場47.9%的佔有率,預計到2031年將以15.9%的複合年成長率成長。這項成長主要得益於中國120萬輛液化天然氣運輸車的投入使用、印尼虛擬管道為12個新城市供氣,以及澳洲偏遠礦區的需求。日本袖浦液化天然氣公司於2024年新增了卡車裝載設施,並開始向其千葉工廠供氣。同時,印度透過ISO罐進口了8萬噸液化天然氣,以供應管道網路尚未覆蓋的邦。儘管管道飽和限制了歐洲的液化投資,但該地區在燃料庫和浮式儲存再氣化裝置(FSRU)領域仍處於主導地位。自2025年起生效的《歐盟海事燃料指令》(FuelEU Maritime)的處罰措施,迫使船東轉型使用液化天然氣(LNG)。預計2024年將有29艘液化天然氣加註船完成1,200次港口停靠。德國的四艘浮動儲存再氣化裝置(FSRU)正在補充俄羅斯的天然氣供應,使現貨價格維持在每兆瓦時40歐元以下。北歐國家的目標是到2024年將其生物液化天然氣(bio-LNG)的佔有率提高到22%,從而為碳負排放船用燃料鋪平道路。
北美正充分利用其豐富的頁岩氣資源和《通貨膨脹削減法案》提供的稅額扣抵。 Chart Industries公司安裝在啤酒廠和乙醇廠的微型液化裝置可獲得每加侖1.75美元的獎勵,而加拿大則透過鐵路向偏遠地區運輸液化天然氣。墨西哥在2024年進行的改革向第三方開放了進口碼頭,為未來的成長奠定了基礎。南美洲仍在發展中,但已展現出正面的發展態勢。 New Fortress Energy公司的浮體式液化裝置瞄準了巴西的鹽層下下層天然氣,而阿根廷年產能50萬噸的工廠則供應國內和智利市場。智利向阿塔卡馬礦供應液化天然氣,使智利國家銅業公司每年節省1,800萬美元。哥倫比亞已授予其太平洋沿岸碼頭的營運權,用於向布埃納文圖拉和圖馬科礦場供應液化天然氣。
在中東和非洲,阿拉伯聯合大公國和卡達正在建造國內燃料庫網路,而南非的科加浮式儲存再氣化裝置(FSRU)則為沿海工業提供服務。莫三比克的科拉爾蘇爾公司出口液化天然氣(LNG),並計劃從2026年開始,每年以ISO罐的形式向該地區供應10萬噸LNG。奈及利亞的虛擬管道計畫正等待ISO罐標準化規範的發展。肯亞和坦尚尼亞正在尋求為進口終端資金籌措,但面臨融資難題。
其他好處:
- Excel格式的市場預測(ME)表
- 3個月的分析師支持
目錄
第1章:引言
- 研究假設和市場定義
- 調查範圍
第2章:調查方法
第3章執行摘要
第4章 市場狀況
- 市場概覽
- 市場促進因素
- 國際海事組織 (IMO) 和歐盟海事燃料協會 (FuelEU Maritime) 收緊硫含量限制,加速船舶(歐洲)採用液化燃料庫加註。
- 快速部署模組化液化裝置,用於偏遠地區採礦和離網發電(亞太地區)
- 中國的藍色走廊計畫涉及將重型卡車改裝為液化天然氣動力卡車。
- 加勒比海和中美洲微電網向液化天然氣發電的轉換
- 根據美國《通貨膨脹控制法》 ,小規模天然氣設施可享有稅收優惠。
- 北歐國家對液化天然氣公車和渡輪的補貼計畫正在推動燃料庫需求。
- 市場限制因素
- 撒哈拉以南非洲地區 ISO 儲槽回程傳輸物流的匱乏。
- 年產量低於 0.05 百萬噸的工廠,其蒸發和再液化成本較高。
- 巴西移動式液化裝置許可製度的碎片化
- 俄烏衝突加劇了液化天然氣探勘的地緣政治風險。
- 供應鏈分析
- 監理展望
- 技術展望
- 波特五力模型
第5章 市場規模與成長預測
- 按類型
- 液化終端(微型、迷你型、小型)
- 再氣化終端(陸上和海上浮式儲存再氣化裝置)
- 透過供應表格
- 追蹤
- 管道和鐵路
- 轉運和燃料庫(船對船和陸對船)
- ISO貨櫃
- 透過使用
- 運輸(公路和船舶燃料庫)
- 工業原料
- 發電
- 其他
- 最終用戶
- 公共產業及獨立電力生產商(IPP)
- 上游油氣業務
- 製造業
- 商業/市政
- 按地區
- 北美洲
- 美國
- 加拿大
- 墨西哥
- 歐洲
- 英國
- 德國
- 法國
- 西班牙
- 北歐國家
- 俄羅斯
- 其他歐洲國家
- 亞太地區
- 中國
- 印度
- 日本
- 韓國
- 馬來西亞
- 泰國
- 印尼
- 越南
- 澳洲
- 其他亞太國家
- 南美洲
- 巴西
- 阿根廷
- 哥倫比亞
- 其他南美國家
- 中東和非洲
- 阿拉伯聯合大公國
- 沙烏地阿拉伯
- 卡達
- 埃及
- 南非
- 其他中東和非洲國家
- 北美洲
第6章 競爭情勢
- 市場集中度
- 策略趨勢(併購、聯盟、購電協議)
- 市場佔有率分析(主要公司的市場排名和佔有率)
- 公司簡介
- Linde plc
- Wartsila Oyj Abp
- Baker Hughes Co.
- Honeywell UOP
- Chart Industries Inc.
- Black & Veatch
- New Fortress Energy LLC
- Shell plc
- TotalEnergies SE
- Eni SpA
- PJSC Gazprom
- Novatek PJSC
- Gasum Oy
- Engie SA
- Anthony Veder Group NV
- Stolt-Nielsen Gas Ltd
- Eagle LNG Partners
- Guanghui Energy Co.
- Equinor ASA
- Pavilion Energy Pte Ltd
第7章 市場機會與未來展望
According to Mordor Intelligence, the small-scale LNG market size is expected to increase from USD 11.80 billion in 2025 to USD 13.04 billion in 2026 and reach USD 21.60 billion by 2031, growing at a CAGR of 10.62% over 2026-2031.
This report is Segmented by Type (Liquefaction Terminal and Regasification Terminal), Mode of Supply (Truck, Pipeline and Rail, Transshipment and Bunkering, and ISO Container), Application (Transportation, Power Generation, and More), End-User (Utilities and IPPs, Oil and Gas Upstream Operators, and More), and Geography (North America, Europe, Asia-Pacific, South America, and Middle East and Africa).
Global Small-scale LNG Market Trends and Insights
Tightening IMO And FuelEU Maritime Sulphur Caps Accelerating Marine LNG Bunkering Adoption
The IMO's 0.50% global sulphur limit and the European Union's FuelEU Maritime greenhouse-gas rules are tilting bunker-fuel economics toward LNG. Shipowners can avoid multi-million-dollar scrubber retrofits and simultaneously reduce CO2, SOx, and particulate emissions by shifting to LNG propulsion. The global LNG bunker fleet reached 61 vessels by late 2024, with Northwest Europe, the Mediterranean, and Asia hosting the largest clusters. TotalEnergies opened a dedicated bunkering terminal at Oman's Port of Duqm in 2024 to serve ships transiting the Arabian Sea. FuelEU Maritime's requirement to account for methane slip is spurring engine makers to adopt high-pressure injection systems that cut unburned methane below 1%. These combined measures foster reliable infrastructure and regulatory certainty for the small-scale LNG market.
Rapid Build-out Of Modular Liquefaction Plants For Remote Mining And Off-Grid Power
Standardized micro and mini liquefiers allow stranded or associated gas to be monetized at capacities as low as 10,000 gallons per day without pipeline connections. Chart Industries' IPSMR(R) process consumes under 0.35 kWh per kilogram of LNG, making off-grid sites viable even when power is supplied by on-site renewables or gensets. Australian mines use containerized LNG to displace diesel trucked over 1,000 km, cutting fuel logistics costs by 40%. Indonesia's island geography relies on virtual pipelines that move ISO tanks from gas-rich islands to population centers, sidestepping multi-billion-dollar subsea lines. Boil-off remains a challenge for plants below 0.05 MTPA, but hybrid solutions, venting vapor to on-site generators, recover up to 80% of the gas's value. As capital costs fall and off-grid demand rises, modular liquefaction underpins long-term growth in the small-scale LNG market.
Russia-Ukraine Conflict Raising Geopolitical Risk Premium On Spot LNG
The 2022 escalation cut 155 billion m3 of Russian pipeline gas to Europe, elevating LNG spot prices to USD 25 per MMBtu before moderating to USD 10-14 by late 2024. Small buyers in bunkering and municipal sectors struggle to secure long-term fixed-price contracts as suppliers push for spot-linked terms. Asian importers compete with Europe for cargoes, diverting supply from Southeast Asia and the Caribbean. Sanctions on Arctic LNG 2 removed 19.8 MTPA of expected output, emboldening other producers to maintain pricing discipline. Buyers are adding storage to buffer volatility, but tanks or small FSRUs raise capital needs by USD 50-100 million, eroding LNG's cost edge over diesel. The resulting uncertainty tempers near-term growth in the small-scale LNG market.
Other drivers and restraints analyzed in the detailed report include:
- Heavy-Duty Truck Fleet Shift To LNG In China's "Blue Corridor" Program
- Tax Incentives For Small-Scale LNG Equipment Under The U.S. Inflation Reduction Act
- High Boil-Off And Re-Liquefaction Costs Below 0.05 MTPA Plants
For complete list of drivers and restraints, kindly check the Table Of Contents.
Segment Analysis
Liquefaction terminals captured 62.3% of the small-scale LNG market in 2025, reflecting the need to monetize stranded gas assets economically. Many micro-plants operate below 0.1 MTPA and use high-efficiency IPSMR(R) technology to reach 90-plus% liquefaction yield. Small units serve biogas upgrading, flare-gas capture, and remote power, while mini and small plants feed export or regional hubs. Compliance with ISO 14001 adds environmental oversight but unlocks green financing. Capital intensity ranges between USD 400 and USD 800 per tonne of annual capacity, a threshold now attainable for frontier markets.
Regasification capacity is accelerating at a 14.4% CAGR to 2031. FSRUs like Hoegh Esperanza and Hoegh Gannet added 10 billion m3 per year to Germany's grid within 18 months, bypassing five-year onshore timelines. The Philippines' BW Mindanao FSRU feeds 5 MTPA into Luzon, enabling the retirement of 2,400 MW of coal. Vapor-recovery systems, required in emission-control areas, add USD 3-5 million but align with FuelEU methane rules. With day-rates between USD 80,000 and USD 150,000, leased FSRUs give buyers flexibility unmatched by fixed terminals, broadening the appeal of the small-scale LNG market.
Truck delivery held a 52.6% share in 2025, anchored by China's heavy-duty LNG fleet. A standard trailer hauls 20-25 tonnes, sufficient for a 5 MW boiler for two days, letting buyers dodge pipeline capacity charges. Hexagon Purus's composite cylinders, introduced in 2024, cut trailer weight by 40%, enabling 28-tonne payloads on weight-restricted European routes. ISO containers support intermodal movements and cut handling costs by up to 30%.
Transshipment and bunkering are growing at a 14.7% CAGR as 18 new bunker vessels join the global fleet by 2027. Singapore licensed 12 bunkering operators in 2024, boosting volumes to 450,000 tonnes. Northwest Europe fields 29 bunker vessels that performed 1,200 ship calls in 2024. As sulfur and CO2 limits tighten, ship-to-ship and shore-to-ship fueling solidify as fast-growing nodes in the small-scale LNG market.
Complete Report Scope:
- By Type
- Liquefaction Terminal (Micro, Mini, and Small)
- Regasification Terminal (Onshore and Offshore FSRU)
- By Mode of Supply
- Truck
- Pipeline and Rail
- Transshipment and Bunkering (Ship-to-ship and Shore-to-ship)
- ISO Container
- By Application
- Transportation (Road and Marine Bunkering)
- Industrial Feedstock
- Power Generation
- Other Applications
- By End-User
- Utilities and Independent Power Producers (IPPs)
- Oil nd Gas Upstream Operators
- Manufacturing Industries
- Commercial and Municipal
- By Geography
- North America
- United States
- Canada
- Mexico
- Europe
- United Kingdom
- Germany
- France
- Spain
- Nordic Countries
- Russia
- Rest of Europe
- Asia-Pacific
- China
- India
- Japan
- South Korea
- Malaysia
- Thailand
- Indonesia
- Vietnam
- Australia
- Rest of Asia-Pacific
- South America
- Brazil
- Argentina
- Colombia
- Rest of South America
- Middle East and Africa
- United Arab Emirates
- Saudi Arabia
- Qatar
- Egypt
- South Africa
- Rest of Middle East and Africa
- North America
Geography Analysis
Asia-Pacific owned 47.9% of the small-scale LNG market in 2025 and is growing at a 15.9% CAGR through 2031. China's 1.2 million LNG trucks, Indonesia's virtual pipelines supplying 12 new city-gas municipalities, and Australia's remote mining demand anchor regional growth. Japan's Sodegaura added truck-loading in 2024 to feed factories in Chiba, while India imported 80,000 tonnes via ISO tanks to reach states beyond pipeline corridors. Europe's pipeline saturation curbs liquefaction investment, yet the region leads in bunkering and FSRUs. FuelEU Maritime penalties starting in 2025 push shipowners toward LNG, and 29 bunker vessels handled 1,200 calls in 2024. Germany's four FSRUs replaced Russian gas volumes, keeping spot prices below EUR 40 per MWh. Nordic countries achieved a 22% bioLNG share in 2024, proving the pathway to carbon-negative shipping fuel.
North America leverages shale gas abundance and the Inflation Reduction Act credits. Chart Industries' micro-liquefiers at breweries and ethanol plants qualify for USD 1.75 per gallon-equivalent incentives, while Canadian rail moves LNG to remote communities. Mexico's 2024 reform opened import terminals to third parties, setting the stage for future growth. South America is nascent but active. New Fortress Energy's floating liquefiers target Brazil's pre-salt gas, and Argentina's 0.5 MTPA plant will serve domestic and Chilean markets. Chile dispatches LNG to Atacama mines, saving Codelco USD 18 million annually. Colombia awarded a terminal concession on its Pacific coast to supply Buenaventura and Tumaco.
In the Middle East and Africa, the UAE and Qatar build domestic bunkering networks, while South Africa's Coega FSRU serves the coastal industry. Mozambique's Coral Sul exports LNG but plans 100,000 tonnes per year for regional ISO-tank distribution starting 2026. Nigeria's virtual-pipeline concept awaits standardized ISO-tank rules. Kenya and Tanzania seek financing for import terminals but face credit hurdles.
- Linde plc
- Wartsila Oyj Abp
- Baker Hughes Co.
- Honeywell UOP
- Chart Industries Inc.
- Black & Veatch
- New Fortress Energy LLC
- Shell plc
- TotalEnergies SE
- Eni SpA
- PJSC Gazprom
- Novatek PJSC
- Gasum Oy
- Engie SA
- Anthony Veder Group NV
- Stolt-Nielsen Gas Ltd
- Eagle LNG Partners
- Guanghui Energy Co.
- Equinor ASA
- Pavilion Energy Pte Ltd
Additional Benefits:
- The market estimate (ME) sheet in Excel format
- 3 months of analyst support
TABLE OF CONTENTS
1 Introduction
- 1.1 Study Assumptions & Market Definition
- 1.2 Scope of the Study
2 Research Methodology
3 Executive Summary
4 Market Landscape
- 4.1 Market Overview
- 4.2 Market Drivers
- 4.2.1 Tightening IMO & FuelEU Maritime Sulphur Caps Accelerating Marine LNG Bunkering Adoption (Europe)
- 4.2.2 Rapid Build-out of Modular Liquefaction Plants for Remote Mining & Off-Grid Power (Asia-Pacific)
- 4.2.3 Heavy-Duty Truck Fleet Shift to LNG in China's "Blue Corridor" Program
- 4.2.4 Caribbean & Central-American Micro-grid Conversions to LNG-to-Power
- 4.2.5 Tax Incentives for Small-Scale LNG Equipment under US Inflation Reduction Act
- 4.2.6 Nordic LNG Bus & Ferry Subsidy Schemes Driving Demand for Bunkering
- 4.3 Market Restraints
- 4.3.1 Sparse ISO-Tank Back-haul Logistics in Sub-Saharan Africa
- 4.3.2 High Boil-Off & Re-liquefaction Costs Below 0.05 MTPA Plants
- 4.3.3 Fragmented Permitting Framework for Mobile Liquefiers in Brazil
- 4.3.4 Russia-Ukraine Conflict Raising Geopolitical Risk Premium on Spot LNG
- 4.4 Supply-Chain Analysis
- 4.5 Regulatory Outlook
- 4.6 Technological Outlook
- 4.7 Porter's Five Forces
- 4.7.1 Bargaining Power of Suppliers
- 4.7.2 Bargaining Power of Buyers
- 4.7.3 Threat of New Entrants
- 4.7.4 Threat of Substitutes
- 4.7.5 Intensity of Competitive Rivalry
5 Market Size & Growth Forecasts
- 5.1 By Type
- 5.1.1 Liquefaction Terminal (Micro, Mini, and Small)
- 5.1.2 Regasification Terminal (Onshore and Offshore FSRU)
- 5.2 By Mode of Supply
- 5.2.1 Truck
- 5.2.2 Pipeline and Rail
- 5.2.3 Transshipment and Bunkering (Ship-to-ship and Shore-to-ship)
- 5.2.4 ISO Container
- 5.3 By Application
- 5.3.1 Transportation (Road and Marine Bunkering)
- 5.3.2 Industrial Feedstock
- 5.3.3 Power Generation
- 5.3.4 Other Applications
- 5.4 By End-User
- 5.4.1 Utilities and Independent Power Producers (IPPs)
- 5.4.2 Oil nd Gas Upstream Operators
- 5.4.3 Manufacturing Industries
- 5.4.4 Commercial and Municipal
- 5.5 By Geography
- 5.5.1 North America
- 5.5.1.1 United States
- 5.5.1.2 Canada
- 5.5.1.3 Mexico
- 5.5.2 Europe
- 5.5.2.1 United Kingdom
- 5.5.2.2 Germany
- 5.5.2.3 France
- 5.5.2.4 Spain
- 5.5.2.5 Nordic Countries
- 5.5.2.6 Russia
- 5.5.2.7 Rest of Europe
- 5.5.3 Asia-Pacific
- 5.5.3.1 China
- 5.5.3.2 India
- 5.5.3.3 Japan
- 5.5.3.4 South Korea
- 5.5.3.5 Malaysia
- 5.5.3.6 Thailand
- 5.5.3.7 Indonesia
- 5.5.3.8 Vietnam
- 5.5.3.9 Australia
- 5.5.3.10 Rest of Asia-Pacific
- 5.5.4 South America
- 5.5.4.1 Brazil
- 5.5.4.2 Argentina
- 5.5.4.3 Colombia
- 5.5.4.4 Rest of South America
- 5.5.5 Middle East and Africa
- 5.5.5.1 United Arab Emirates
- 5.5.5.2 Saudi Arabia
- 5.5.5.3 Qatar
- 5.5.5.4 Egypt
- 5.5.5.5 South Africa
- 5.5.5.6 Rest of Middle East and Africa
- 5.5.1 North America
6 Competitive Landscape
- 6.1 Market Concentration
- 6.2 Strategic Moves (M&A, Partnerships, PPAs)
- 6.3 Market Share Analysis (Market Rank/Share for key companies)
- 6.4 Company Profiles (includes Global level Overview, Market level overview, Core Segments, Financials as available, Strategic Information, Products & Services, and Recent Developments)
- 6.4.1 Linde plc
- 6.4.2 Wartsila Oyj Abp
- 6.4.3 Baker Hughes Co.
- 6.4.4 Honeywell UOP
- 6.4.5 Chart Industries Inc.
- 6.4.6 Black & Veatch
- 6.4.7 New Fortress Energy LLC
- 6.4.8 Shell plc
- 6.4.9 TotalEnergies SE
- 6.4.10 Eni SpA
- 6.4.11 PJSC Gazprom
- 6.4.12 Novatek PJSC
- 6.4.13 Gasum Oy
- 6.4.14 Engie SA
- 6.4.15 Anthony Veder Group NV
- 6.4.16 Stolt-Nielsen Gas Ltd
- 6.4.17 Eagle LNG Partners
- 6.4.18 Guanghui Energy Co.
- 6.4.19 Equinor ASA
- 6.4.20 Pavilion Energy Pte Ltd
7 Market Opportunities & Future Outlook
- 7.1 White-Space & Unmet-Need Assessment

 全球小規模天然氣市場規模、佔有率、趨勢和成長分析報告(2026-2034年)小規模液化天然氣市場規模、佔有率、成長率、全球產業分析、區域趨勢以及 2026 年至 2034 年的預測。
 2026 年至 2035 年小規模液化天然氣市場機會、成長要素、產業趨勢分析及預測。
 小規模天然氣市場:按設施類型、設備、終端類型、安裝類型和應用分類-2026-2032年全球市場預測
 小規模天然氣市場規模、佔有率和趨勢分析報告:按供應類型、類別、應用、地區和細分市場預測(2026-2033 年)
 小規模天然氣市場報告:按終端類型、供應形式、儲存槽類型、應用和地區分類(2026-2034 年)
 2026年全球小規模天然氣市場報告
 小規模液化天然氣(SSLNG)液化裝置市場-全球產業規模、佔有率、趨勢、機會及預測(依應用、技術、產能、原料來源、地區及競爭格局分類,2021-2031)
 小型液化天然氣市場規模、佔有率和成長分析(按類型、供應方式、儲存槽容量、應用、最終用途和地區分類)-2026-2033年產業預測
 全球小型液化天然氣市場(按類型、供應模式、應用和地區)-2030 年預測