


 |
市場調查報告書
商品編碼
2109154
2026 年至 2035 年小規模液化天然氣市場機會、成長要素、產業趨勢分析及預測。Small Scale LNG Market Opportunity, Growth Drivers, Industry Trend Analysis, and Forecast 2026 - 2035 |
||||||

全球小規模液化天然氣市場預計到 2025 年將價值 122 億美元,預計到 2035 年將以 7.5% 的複合年成長率成長至 257 億美元。
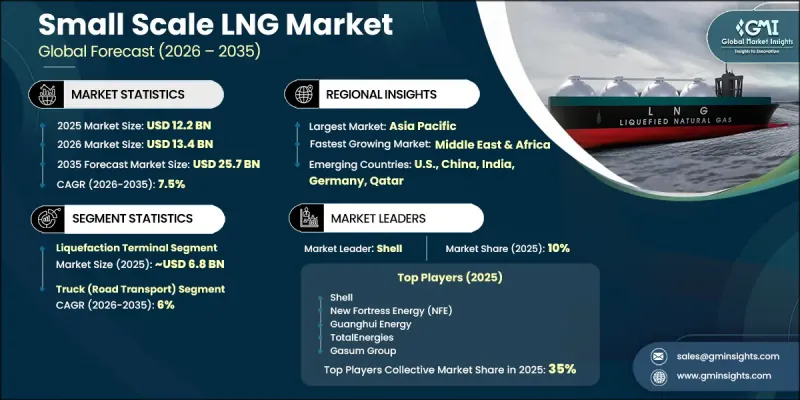
隨著交通運輸、工業和發電等產業對靈活分散式天然氣供應解決方案的需求不斷成長,小規模液化天然氣(LNG)產業正經歷穩定成長。市場擴張的促進因素包括日益嚴格的環境法規、LNG燃料庫基礎設施的持續發展,以及管道網路涵蓋有限地區對可靠能源供應日益成長的需求。小型LNG經濟效益顯著,且各行業對減排的日益重視,推動了從傳統液體燃料向小規模LNG的轉變。在許多開發中國家和偏遠市場,小規模LNG已被證明是向傳統管道基礎設施不完善或經濟上不切實際的地區供應天然氣的有效替代方案。虛擬管道網路、模組化再氣化技術和ISO貨櫃運輸的日益普及,不僅擴大了新終端用戶的天然氣獲取管道,也同時拓寬了全球小規模LNG市場的商業性範圍。這些因素持續創造強勁的長期成長機會,支持小規模LNG解決方案在不同區域市場的廣泛應用。
| 市場範圍 | |
|---|---|
| 開始年份 | 2025 |
| 預測期 | 2026-2035 |
| 上市時的市場規模 | 122億美元 |
| 預測金額 | 257億美元 |
| 複合年成長率 | 7.5% |
預計到2025年,液化終端業務將佔據55.9%的市場佔有率,銷售額達68億美元,並在2035年之前以6.7%的複合年成長率成長。液化設施作為小規模液化天然氣供應鏈的生產基地,發揮至關重要的作用,它們將天然氣轉化為液化形式,用於運輸、分散式發電、工業消費和船舶燃料供應(燃料庫)。模組化和中型液化裝置的持續部署持續增強了供給能力,提高了營運柔軟性,並擴大了液化天然氣在區域市場的供應範圍。
預計到2025年,卡車運輸市佔率將達到40.3%,並在2035年之前以6%的複合年成長率成長。低溫油輪仍是液化天然氣從液化設施和進口終端運輸至工業客戶、衛星配送站和區域天然氣管網的首選方式。陸上液化天然氣物流基礎設施的持續擴張正在提高供應鏈效率,增強交付柔軟性,並推動小規模液化天然氣在運輸、工業和商業領域的更廣泛應用。
預計到2025年,北美小規模液化天然氣(LNG)市佔率將達到22%,並在2035年之前以6.4%的複合年成長率成長。該地區市場成長的驅動力包括豐富的國內天然氣資源、良好的原料供應以及為滿足交通運輸和工業需求而不斷增加的液化基礎設施投資。 LNG分銷網路的持續發展以及LNG作為替代燃料的商業性應用不斷擴大,正在推動該地區市場成長,並提高分散式天然氣供應解決方案在多個終端用戶行業的可用性。
目錄
第1章:調查方法和範圍
第2章執行摘要
第3章 行業洞察
- 產業生態系分析
- 原料採購和天然氣供應合約分析
- 液化/處理層
- 倉儲、物流和配送基礎設施
- 按最終用戶進行整合和客戶分析。
- 監理情勢
- 影響產業的因素
- 促進因素
- 產業潛在風險與挑戰
- 成長潛力分析
- 波特的分析
- PESTLE分析
- 投資與資金籌措分析
- 小規模天然氣基礎設施資本投資趨勢
- 政府津貼和補貼
- 貿易數據分析
- 液化天然氣出口及進口
- 主要貿易路線
- 關稅結構和貿易政策的影響
- 人工智慧和生成式人工智慧對市場的影響
- 利用人工智慧改造現有經營模式
- 生成式人工智慧的應用案例與實施藍圖
- 風險、限制和監管考量
- 將永續發展措施與工業4.0結合
- 未來展望與策略機遇
- 市場演進藍圖
- 新興應用分析
- 科技融合分析
第4章 競爭情勢
- 介紹
- 企業市佔率分析:按地區分類
- 北美洲
- 歐洲
- 亞太地區
- 中東和非洲
- 拉丁美洲
- 主要進展
- 重要合作夥伴關係和合作
- 主要併購活動
- 產品創新和新產品發布
- 市場擴大策略
- 競爭定位矩陣
- 排名分類標準與遴選標準
- 按銷售額、地區和創新能力分類的層級定位矩陣。
第5章 市場規模及預測:依終端分類,2022-2035年
- 液化終端
- 尖峰用電調節廠
- 工業液化廠
- 衛星式和模組化液化站
- 利用液化設施實現孤立天然氣資源的商業化
- 再氣化終端
- 衛星再氣化裝置(SRUS)
- 虛擬管道終端再氣化站
- 海上和港口再氣化設施
第6章 市場規模及預測:依供應類型分類,2022-2035年
- 卡車(道路運輸)
- 船舶轉運和加油
- ISO貨櫃(多模態)
- 虛擬管道
- 鐵路油罐車
第7章 市場規模及預測:依應用領域分類,2022-2035年
- 運輸
- 工業原料
- 發電
- 海上加油
- 其他
第8章 市場規模及預測:依最終用途分類,2022-2035年
- 採礦和重工業
- 石油和天然氣
- 公共產業及獨立電力生產商(IPP)
- 航運和船舶運營商
- 其他
第9章 市場規模及預測:依地區分類,2022-2035年
- 北美洲
- 美國
- 加拿大
- 墨西哥
- 歐洲
- 英國
- 德國
- 法國
- 西班牙
- 挪威
- 義大利
- 亞太地區
- 中國
- 日本
- 韓國
- 印度
- 印尼
- 新加坡
- 泰國
- 中東和非洲
- UAE
- 沙烏地阿拉伯
- 卡達
- 土耳其
- 南非
- 奈及利亞
- 阿爾及利亞
- 拉丁美洲
- 巴西
- 阿根廷
第10章:公司簡介
- Shell plc
- New Fortress Energy(NFE)
- Guanghui Energy
- TotalEnergies
- Gasum Group
- Kunlun Energy(CNOOC)
- Equinor
- Excelerate Energy
- Linde
- Engie
- Hoegh LNG Holdings
- Stabilis Solutions
- Galileo Technologies
- Snam
- GAIL(India)Limited
- Pavilion Energy
- Sempra Infrastructure
- Eagle LNG Partners
- Honeywell International
- Cryostar
- Anthony Veder Group
- Stolt-Nielsen
- Pivotal LNG
- Wartsila
The Global Small Scale LNG Market was valued at USD 12.2 billion in 2025 and is estimated to grow at a CAGR of 7.5% to reach USD 25.7 billion by 2035.
The small scale LNG industry is experiencing steady growth as demand increases for flexible and decentralized natural gas supply solutions across transportation, industrial operations, and power generation applications. Market expansion is supported by stricter environmental regulations, continued development of LNG bunkering infrastructure, and rising demand for reliable energy supplies in regions with limited pipeline connectivity. The transition from conventional liquid fuels to small-scale LNG is being encouraged by its favorable operating economics and the growing emphasis on lowering emissions across multiple industries. In many developing and remote markets, small-scale LNG has become an effective alternative for delivering natural gas where traditional pipeline infrastructure is either unavailable or economically impractical. The increasing adoption of virtual pipeline networks, modular regasification technologies, and ISO container-based transportation is extending natural gas accessibility to new end users while expanding the commercial reach of the global small scale LNG market. These factors continue to create favorable long-term growth opportunities and support wider adoption of small-scale LNG solutions across diverse geographic markets.
| Market Scope | |
|---|---|
| Start Year | 2025 |
| Forecast Year | 2026-2035 |
| Start Value | $12.2 Billion |
| Forecast Value | $25.7 Billion |
| CAGR | 7.5% |
The liquefaction terminals segment accounted for 55.9% share in 2025, generating USD 6.8 billion, and is expected to grow at a CAGR of 6.7% through 2035. Liquefaction facilities serve as the production foundation of small-scale LNG supply chains by converting natural gas into liquefied form for transportation, distributed power generation, industrial consumption, and bunkering applications. The growing deployment of modular and mid-scale liquefaction plants continues to strengthen supply capabilities while improving operational flexibility and expanding LNG availability across regional markets.
The truck delivery segment held 40.3% share in 2025 and is projected to grow at a CAGR of 6% through 2035. Cryogenic tanker trucks remain the preferred method for transporting LNG from liquefaction facilities and import terminals to industrial customers, satellite distribution stations, and local gas networks. The continued expansion of road-based LNG logistics infrastructure is improving supply chain efficiency, increasing delivery flexibility, and supporting broader adoption of small-scale LNG across transportation, industrial, and commercial applications.
North America Small Scale LNG Market held 22% share in 2025 and is forecast to grow at a CAGR of 6.4% through 2035. Regional market growth is supported by abundant domestic natural gas resources, favorable feedstock availability, and increasing investments in liquefaction infrastructure serving transportation and industrial demand. Continued development of LNG distribution networks and expanding commercial adoption of LNG as an alternative fuel are strengthening regional market growth while improving the availability of decentralized natural gas supply solutions across multiple end-use industries.
Major companies operating in the global small scale LNG market include Shell plc, TotalEnergies, Linde, Engie, Honeywell International, Sempra Infrastructure Partners, Gasum, Hoegh LNG Holdings, Excelerate Energy, Pavilion Energy, GAIL (India) Limited, Stabilis Solutions, Galileo Technologies, CryoPur, Cryostar, New Fortress Energy, Eagle LNG Partners, Guanghui Energy, Kunlun Energy, Equinor, Skangas, Snam, ENI, Anthony Veder, Stolt-Nielsen Gas, Pivotal LNG, and Wartsila. Companies operating in the small scale LNG market are strengthening their market position by expanding liquefaction capacity, investing in modular LNG infrastructure, and enhancing distribution networks to improve supply reliability. Manufacturers and service providers are focusing on technological advancements that increase operational efficiency, reduce transportation costs, and support flexible LNG delivery solutions. Strategic partnerships with industrial customers, energy providers, and infrastructure developers are helping companies broaden their market presence and secure long-term supply agreements. Businesses are also investing in virtual pipeline systems, LNG bunkering infrastructure, storage facilities, and regasification technologies to expand geographic coverage and improve customer access.
Table of Contents
Chapter 1 Methodology & Scope
- 1.1 Research approach
- 1.2 Quality commitments
- 1.2.1 GMI AI policy & data integrity commitment
- 1.2.1.1 Source consistency protocol
- 1.2.1 GMI AI policy & data integrity commitment
- 1.3 Research trail & confidence scoring
- 1.3.1 Research trail components
- 1.3.2 Scoring components
- 1.4 Data collection
- 1.4.1 Partial list of primary sources
- 1.5 Data mining sources
- 1.5.1 Paid sources
- 1.5.1.1 Sources, by region
- 1.5.1 Paid sources
- 1.6 Base estimates and calculations
- 1.6.1 Base year calculation for any one approach
- 1.7 Market estimates & forecasts parameters
- 1.8 Forecast model
- 1.8.1 Quantified market impact analysis
- 1.8.1.1 Mathematical impact of growth parameters on forecast
- 1.8.1 Quantified market impact analysis
- 1.9 Research transparency addendum
- 1.9.1 Source attribution framework
- 1.9.2 Quality assurance metrics
- 1.9.3 Our commitment to trust
- 1.10 Market definitions
Chapter 2 Executive Summary
- 2.1 Industry synopsis, 2022 - 2035
- 2.1.1 Business trends
- 2.1.2 Terminal trends
- 2.1.3 Mode of supply trends
- 2.1.4 Application trends
- 2.1.5 End use trends
- 2.1.6 Regional trends
Chapter 3 Industry Insights
- 3.1 Industry ecosystem analysis
- 3.1.1 Feedstock sourcing & gas supply agreements analysis
- 3.1.2 Liquefaction & processing layer
- 3.1.3 Storage, logistics & distribution infrastructure
- 3.1.4 End-use integration & customer analysis
- 3.2 Regulatory landscape
- 3.3 Industry impact forces
- 3.3.1 Growth drivers
- 3.3.2 Industry pitfalls & challenges
- 3.4 Growth potential analysis
- 3.5 Porter's analysis
- 3.5.1 Bargaining power of suppliers
- 3.5.2 Bargaining power of buyers
- 3.5.3 Threat of new entrants
- 3.5.4 Threat of substitutes
- 3.6 PESTEL analysis
- 3.6.1 Political factors
- 3.6.2 Economic factors
- 3.6.3 Social factors
- 3.6.4 Technological factors
- 3.6.5 Legal factors
- 3.6.6 Environmental factors
- 3.7 Investment & funding analysis
- 3.7.1 Capital investment trends in small-scale LNG infrastructure
- 3.7.2 Government grants & subsidies
- 3.8 Trade data analysis (Driven by Primary Research)
- 3.8.1 Lng import & export
- 3.8.2 Key trade corridors
- 3.8.3 Tariff structures & trade policy impact
- 3.9 Impact of AI & Generative AI on the market
- 3.9.1 AI-Driven disruption of existing business models
- 3.9.2 GenAI use cases & adoption roadmap
- 3.9.3 Risks, limitations & regulatory considerations
- 3.10 Sustainability initiatives & industry 4.0 integration
- 3.11 Future outlook & strategic opportunities
- 3.11.1 Market evolution roadmap
- 3.11.2 Emerging applications analysis
- 3.11.3 Technology convergence analysis
Chapter 4 Competitive Landscape, 2026
- 4.1 Introduction
- 4.2 Company market share analysis, by region, 2025
- 4.2.1 North America
- 4.2.2 Europe
- 4.2.3 Asia Pacific
- 4.2.4 Middle East & Africa
- 4.2.5 Latin America
- 4.3 Key developments
- 4.3.1 Key partnerships & collaborations
- 4.3.2 Major M&A activities
- 4.3.3 Product innovations & launches
- 4.3.4 Market expansion strategies
- 4.4 Competitive positioning matrix
- 4.4.1 Tier classification criteria & qualifying thresholds
- 4.4.2 Tier positioning matrix by revenue, geography & innovation
Chapter 5 Market Size and Forecast, By Terminal, 2022 - 2035 (USD Million)
- 5.1 Key trends
- 5.2 Liquefaction terminal
- 5.2.1 Peak-shaving plants
- 5.2.2 Industrial liquefaction units
- 5.2.3 Satellite & modular liquefaction stations
- 5.2.4 Stranded gas monetization liquid facilities
- 5.3 Regasification terminal
- 5.3.1 Satellite Regasification Units (SRUS)
- 5.3.2 Virtual pipeline endpoint regasification station
- 5.3.3 Marine & port regasification facilities
Chapter 6 Market Size and Forecast, By Mode of Supply, 2022 - 2035 (USD Million)
- 6.1 Key trends
- 6.2 Truck (Road Transport)
- 6.3 Trans-shipment & Marine Bunkering
- 6.4 ISO Containers (Multi-Modal)
- 6.5 Virtual Pipeline
- 6.6 Rail Tanks
Chapter 7 Market Size and Forecast, By Application, 2022 - 2035 (USD Million)
- 7.1 Key trends
- 7.2 Transportation
- 7.3 Industrial Feedstock
- 7.4 Power Generation
- 7.5 Marine Bunkering
- 7.6 Others
Chapter 8 Market Size and Forecast, By End Use, 2022 - 2035 (USD Million)
- 8.1 Key trends
- 8.2 Mining & Heavy Industry
- 8.3 Oil & Gas
- 8.4 Utilities & IPPs
- 8.5 Shipping & Marine Operators
- 8.6 Others
Chapter 9 Market Size and Forecast, By Region, 2022 - 2035 (USD Million)
- 9.1 Key trends
- 9.2 North America
- 9.2.1 U.S.
- 9.2.2 Canada
- 9.2.3 Mexico
- 9.3 Europe
- 9.3.1 UK
- 9.3.2 Germany
- 9.3.3 France
- 9.3.4 Spain
- 9.3.5 Norway
- 9.3.6 Italy
- 9.4 Asia Pacific
- 9.4.1 China
- 9.4.2 Japan
- 9.4.3 South Korea
- 9.4.4 India
- 9.4.5 Indonesia
- 9.4.6 Singapore
- 9.4.7 Thailand
- 9.5 Middle East & Africa
- 9.5.1 UAE
- 9.5.2 Saudi Arabia
- 9.5.3 Qatar
- 9.5.4 Turkey
- 9.5.5 South Africa
- 9.5.6 Nigeria
- 9.5.7 Algeria
- 9.6 Latin America
- 9.6.1 Brazil
- 9.6.2 Argentina
Chapter 10 Company Profiles
- 10.1 Shell plc
- 10.2 New Fortress Energy (NFE)
- 10.3 Guanghui Energy
- 10.4 TotalEnergies
- 10.5 Gasum Group
- 10.6 Kunlun Energy (CNOOC)
- 10.7 Equinor
- 10.8 Excelerate Energy
- 10.9 Linde
- 10.10 Engie
- 10.11 Hoegh LNG Holdings
- 10.12 Stabilis Solutions
- 10.13 Galileo Technologies
- 10.14 Snam
- 10.15 GAIL (India) Limited
- 10.16 Pavilion Energy
- 10.17 Sempra Infrastructure
- 10.18 Eagle LNG Partners
- 10.19 Honeywell International
- 10.20 Cryostar
- 10.21 Anthony Veder Group
- 10.22 Stolt-Nielsen
- 10.23 Pivotal LNG
- 10.24 Wartsila

 全球小規模天然氣市場規模、佔有率、趨勢和成長分析報告(2026-2034年)小規模液化天然氣市場規模、佔有率、成長率、全球產業分析、區域趨勢以及 2026 年至 2034 年的預測。
 小規模液化天然氣:市場佔有率分析、行業趨勢和統計數據、成長預測(2026-2031 年)
 小規模天然氣市場:按設施類型、設備、終端類型、安裝類型和應用分類-2026-2032年全球市場預測
 小規模天然氣市場規模、佔有率和趨勢分析報告:按供應類型、類別、應用、地區和細分市場預測(2026-2033 年)
 小規模天然氣市場報告:按終端類型、供應形式、儲存槽類型、應用和地區分類(2026-2034 年)
 2026年全球小規模天然氣市場報告
 小規模液化天然氣(SSLNG)液化裝置市場-全球產業規模、佔有率、趨勢、機會及預測(依應用、技術、產能、原料來源、地區及競爭格局分類,2021-2031)
 小型液化天然氣市場規模、佔有率和成長分析(按類型、供應方式、儲存槽容量、應用、最終用途和地區分類)-2026-2033年產業預測
 全球小型液化天然氣市場(按類型、供應模式、應用和地區)-2030 年預測