


 |
市場調查報告書
商品編碼
2121889
美國飲料包裝:市場佔有率分析、行業趨勢和統計數據、成長預測(2026-2031)US Beverage Packaging - Market Share Analysis, Industry Trends & Statistics, Growth Forecasts (2026 - 2031) |
||||||

※ 本網頁內容可能與最新版本有所差異。詳細情況請與我們聯繫。
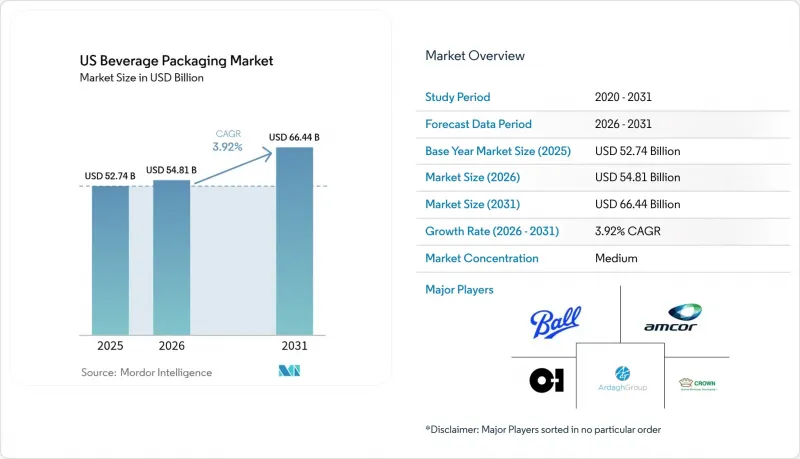
根據 Mordor Intelligence 預測,美國飲料包裝市場規模將從 2025 年的 527.4 億美元成長到 2026 年的 548.1 億美元,然後在 2031 年達到 664.4 億美元,2026 年至 2031 年的複合年成長率為 3.92%。
本報告按材料(塑膠、金屬、玻璃、紙板)、產品類型(瓶裝、罐裝、袋裝、紙盒裝、啤酒桶裝)、應用領域(酒精飲料、牛奶及乳製品替代品、能量飲料和機能飲料、碳酸飲料和水以及其他飲料)和包裝類型(硬包裝、軟包裝)進行細分。市場預測以美元計價。
美國飲料包裝市場的趨勢與洞察
輕量化設計,注重永續性,並強制使用再生聚酯纖維(rPET)。
加州AB 793法案規定,2022年PET飲料容器的最低再生材料含量為15%,併計劃在2030年提高到50%。紐約州、新澤西州和馬薩諸塞州的立法者正在積極考慮類似的方案。由於再生PET的成本比原生樹脂高出15%至25%,品牌商被迫投資減輕容器重量,進而將每個容器的聚合物用量減少8%至12%。百事公司已將部分礦泉水產品線全部替換為100%再生PET,在保證產品供應的同時,二氧化碳排放量減少了31%。儘管為了符合法規要求而進行的生產線維修導致物流和加工成本每單位增加了0.03至0.08美元,但品牌商透過強調低碳包裝,實現了5%至8%的價格上漲。
近期,即飲咖啡和能量飲料新品上市數量激增。
目前,即飲能量飲料在便利商店即飲飲料銷售額中佔比37%,高於2020年的28%。此外,幾乎所有新產品都採用鋁製包裝。 Monster Beverage全球銷售量的97%來自鋁製容器,該公司預計到2025年淨銷售額將達到71億美元,並透過溢價來抵銷不斷上漲的原料成本。鋁的輕盈特性和良好的氧氣阻隔性有助於保持咖啡的香氣,維持功能性成分的穩定性,從而延長保存期限,無需冷藏運輸,並可降低高達30%的冷鏈成本。 2018年至2023年間,新的即飲咖啡庫存單位(SKU)數量增加了73%,其中60%採用罐裝,以更好地保持風味並實現包裝的靈活性。
原生樹脂價格波動劇烈
單體價格(尤其是乙烯和對二甲苯)在墨西哥灣沿岸地區現貨市場經常出現每磅25-30美分的波動,這擾亂了瓶裝水和碳酸飲料(CSD)生產商的PET成本結構。由於期貨避險空間有限,小規模瓶裝商的季度利潤率正面臨壓力。
細分市場分析
預計到2025年,塑膠仍將保持44.85%的最大市場佔有率,而金屬包裝預計將以5.92%的複合年成長率成長,在所有材料中增速最高。到2031年,美國飲料包裝市場中金屬容器的市場規模預計將超過291.5億美元,這反映出消費者對可無限循環利用包裝形式的偏好,以及監管機構對高比例再生材料(PCR)的評估。鋁的阻隔性可防止能量飲料和即飲咖啡的風味劣化,從而支撐其溢價,抵消單位成本的增加。
波爾公司(Ball Corporation)的目標是到2030年實現90%的回收率和85%的再生材料含量,建構一個「閉合迴路」體系,這與尋求減少範圍3排放的零售商的需求不謀而合。儘管玻璃面臨熔爐關閉和高能耗熔煉工藝等諸多挑戰,但紙盒憑藉「Elopak Pure-Pak」結構正蓬勃發展,該結構97%的材料源自可再生資源,在大規模生產中具有與PET相當的成本競爭力。儘管採取了積極的減重措施,將聚合物含量降低了高達15%,但再生PET的供不應求仍阻礙著塑膠市場滲透。
到2025年,瓶裝飲料將佔據美國飲料包裝市場27.25%的佔有率,但罐裝飲料憑藉其便攜性、冷藏效率和可定製印刷等優勢,正以6.78%的複合年成長率成長。與玻璃瓶相比,罐裝飲料可堆疊,從而降低20%至25%的運輸成本,這促使精釀啤酒、風味蘇打水和維生素強化水的生產商紛紛轉向罐裝包裝。
根據日本罐頭食品協會的數據,到2025年,超過70%的飲料將罐裝,高於五年前的45%。數位印刷技術將前置作業時間從數週縮短至數天,加速了產品種類(SKU)的成長。這對於限量版即飲咖啡聯名產品至關重要。瓶裝飲料領域的創新重點在於輕巧可重複使用的PET和玻璃材質,而袋裝和紙盒包裝則在兒童飲料和無菌乳製品替代品等小眾市場中越來越受歡迎。
其他好處:
- Excel格式的市場預測(ME)表
- 3個月的分析師支持
目錄
第1章:引言
- 研究假設和市場定義
- 調查範圍
第2章:調查方法
第3章執行摘要
第4章 市場狀況
- 市場概覽
- 市場促進因素
- 以永續性為驅動力,實現輕量化並強制使用rPET。
- 市面上新推出的即飲咖啡和能量飲料產品數量正在迅速增加。
- 精釀啤酒轉向鋁罐包裝的轉變
- 使用我們自己的貨櫃進行配送,專為電子商務量身定做。
- 「繫繩上限」法規(CFR 第 21 章修正案)正在推動重新設計。
- 利用鋁材可回收性的優勢,打造高階市場定位。
- 市場限制因素
- 原生樹脂價格波動
- 玻璃熔爐生產能力的合理化
- 存款返還政策的擴大推高了合規成本。
- 供不應求
- 供應鏈分析
- 監理情勢
- 技術展望
- 波特五力模型
- 對影響市場的宏觀經濟因素進行評估
第5章 市場規模與成長預測
- 材料
- 塑膠
- 金屬
- 玻璃
- 紙板
- 依產品類型
- 瓶子
- 坎
- 小袋
- 紙盒
- 啤酒桶
- 透過使用
- 酒精飲料
- 牛奶和乳製品替代品
- 能量飲料和功能飲料
- 碳酸軟性飲料和碳酸水
- 其他飲料
- 按包裝類型
- 死板的
- 靈活的
第6章 競爭情勢
- 市場集中度
- 策略趨勢
- 市佔率分析
- 公司簡介
- Ball Corporation
- Crown Holdings Inc.
- Owens-Illinois Inc.
- Ardagh Group
- Amcor plc
- Berry Global Inc.
- Silgan Holdings Inc.
- WestRock Co.
- Berlin Packaging
- Sonoco Products Co.
- CCL Containers Inc.
- Graphic Packaging Holding
- Tetra Pak Inc.
- SIG Combibloc
- Canpack SA
- Plastipak Holdings Inc.
- Novolex
- Printpack Inc.
- ProAmpac LLC
- American Canning
第7章 市場機會與未來展望
According to Mordor Intelligence, the US beverage packaging market size is expected to grow from USD 52.74 billion in 2025 to USD 54.81 billion in 2026 and is forecast to reach USD 66.44 billion by 2031 at 3.92% CAGR over 2026-2031.
This report is Segmented by Material (Plastic, Metal, Glass, Paperboard), Product Type (Bottles, Cans, Pouches, Cartons, Beer Kegs), Application (Alcoholic Beverages, Milk and Dairy Alternatives, Energy and Functional Drinks, Carbonated Soft Drinks and Water, Other Beverages), Packaging Format (Rigid, Flexible). The Market Forecasts are Provided in Terms of Value (USD).
US Beverage Packaging Market Trends and Insights
Sustainability-driven lightweighting and rPET mandates
California's AB 793 set a 15% recycled-content floor for PET beverage containers in 2022 that rises to 50% by 2030, providing a blueprint that New York, New Jersey, and Massachusetts lawmakers are actively considering. Recycled PET carries 15-25% cost premiums over virgin resin, compelling brands to invest in lightweighting that reduces polymer usage by 8-12% per container. PepsiCo's 100% rPET shift on select water lines trimmed carbon emissions by 31% while retaining shelf integrity. Compliance-driven line retrofits add USD 0.03-0.08 per unit in logistics and processing overhead, yet brands are capturing 5-8% price lifts by marketing lower-carbon packaging.
Surge in RTD coffee and energy drink launches
RTD energy beverages now account for 37% of convenience-store RTD sales, up from 28% in 2020, and nearly every major launch uses aluminum formats. Monster Beverage derives 97% of its global volume from aluminum containers, enabling USD 7.1 billion in 2025 net sales while offsetting commodity inflation through premium pricing. Aluminum's light- and oxygen-barrier attributes help maintain coffee aromatics and functional ingredient stability, extending shelf life without chilled distribution and lowering cold-chain costs by up to 30%. New RTD coffee stock-keeping units (SKUs) rose 73% from 2018-2023, and 60% of those used cans because of flavor preservation and decoration versatility.
Volatile virgin resin prices
Monomer price swings-particularly ethylene and paraxylene-regularly reach 25-30 c/lb in Gulf Coast spot markets, destabilizing PET cost structures for bottled water and carbonated soft drink (CSD) producers. Forward hedging is limited, causing quarterly margin compression for small bottlers.
Other drivers and restraints analyzed in the detailed report include:
- Craft beer's switch to aluminum cans
- E-commerce-tailored "ship-in-own-container" formats
- Glass furnace capacity rationalization
For complete list of drivers and restraints, kindly check the Table Of Contents.
Segment Analysis
Plastic kept the largest share at 44.85% in 2025, yet metal packaging is projected to post a 5.92% CAGR, the fastest among all materials. The US beverage packaging market size for metal containers is forecast to exceed USD 29.15 billion by 2031, reflecting consumer preference for infinitely recyclable formats and regulatory credit for higher post-consumer recycled (PCR) content. Aluminum's barrier properties guard flavor volatility in energy drinks and RTD coffee, supporting premium shelf pricing that offsets higher unit costs.
Ball Corporation targets 90% recycling rates and 85% recycled content by 2030, creating a closed-loop narrative that resonates with retailers pursuing Scope 3 emission cuts. Glass faces headwinds from furnace closures and energy-intensive melting, while paperboard cartons gain momentum through 97% renewable Elopak Pure-Pak structures that reach cost parity with PET at high volume. Recycled PET shortages still restrain plastic penetration despite aggressive lightweighting that cuts polymer content by up to 15%.
Bottles commanded 27.25% of the US beverage packaging market in 2025; however, cans are pacing at a 6.78% CAGR, driven by portability, refrigeration efficiency, and customizable printing. Cans' stackable geometry yields 20-25% freight savings over glass bottles, encouraging conversion among craft beer, flavored seltzer, and vitamin-enriched water producers.
Over 70% of 2025 beverage launches are in cans compared with 45% five years earlier, according to Can Manufacturers Institute data. Digital-print technology accelerates SKU proliferation by shrinking lead times from weeks to days, vital for limited edition RTD coffee collaborations. Bottle innovation centers on lightweight refillable PET and glass, while pouches and cartons appeal to niche use cases such as children's beverages or aseptic dairy alternatives.
Complete Report Scope:
- By Material
- Plastic
- Metal
- Glass
- Paperboard
- By Product Type
- Bottles
- Cans
- Pouches
- Cartons
- Beer Kegs
- By Application
- Alcoholic Beverages
- Milk and Dairy Alternatives
- Energy and Functional Drinks
- Carbonated Soft Drinks and Water
- Other Beverages
- By Packaging Format
- Rigid
- Flexible
List of Companies Covered in this Report:
- Ball Corporation
- Crown Holdings Inc.
- Owens-Illinois Inc.
- Ardagh Group
- Amcor plc
- Berry Global Inc.
- Silgan Holdings Inc.
- WestRock Co.
- Berlin Packaging
- Sonoco Products Co.
- CCL Containers Inc.
- Graphic Packaging Holding
- Tetra Pak Inc.
- SIG Combibloc
- Canpack S.A.
- Plastipak Holdings Inc.
- Novolex
- Printpack Inc.
- ProAmpac LLC
- American Canning
Additional Benefits:
- The market estimate (ME) sheet in Excel format
- 3 months of analyst support
TABLE OF CONTENTS
1 INTRODUCTION
- 1.1 Study Assumptions and Market Definition
- 1.2 Scope of the Study
2 RESEARCH METHODOLOGY
3 EXECUTIVE SUMMARY
4 MARKET LANDSCAPE
- 4.1 Market Overview
- 4.2 Market Drivers
- 4.2.1 Sustainability-driven lightweighting and rPET mandates
- 4.2.2 Surge in RTD coffee/energy drink launches
- 4.2.3 Craft beer's switch to aluminum cans
- 4.2.4 E-commerce-tailored "ship-in-own-container" formats
- 4.2.5 Tethered-cap rule (CFR Title 21 update) spurring redesigns
- 4.2.6 Premiumpositioning through aluminum's recyclability credentials
- 4.3 Market Restraints
- 4.3.1 Volatile virgin resin prices
- 4.3.2 Glass furnace capacity rationalization
- 4.3.3 Deposit-return expansions raising compliance costs
- 4.3.4 Recycled PET feedstock shortages
- 4.4 Supply-Chain Analysis
- 4.5 Regulatory Landscape
- 4.6 Technological Outlook
- 4.7 Porter's Five Forces
- 4.7.1 Threat of New Entrants
- 4.7.2 Bargaining Power of Buyers
- 4.7.3 Bargaining Power of Suppliers
- 4.7.4 Threat of Substitute Products
- 4.7.5 Intensity of Competitive Rivalry
- 4.8 Assesment of macroeconomic Factors on the market
5 MARKET SIZE AND GROWTH FORECASTS (VALUE)
- 5.1 By Material
- 5.1.1 Plastic
- 5.1.2 Metal
- 5.1.3 Glass
- 5.1.4 Paperboard
- 5.2 By Product Type
- 5.2.1 Bottles
- 5.2.2 Cans
- 5.2.3 Pouches
- 5.2.4 Cartons
- 5.2.5 Beer Kegs
- 5.3 By Application
- 5.3.1 Alcoholic Beverages
- 5.3.2 Milk and Dairy Alternatives
- 5.3.3 Energy and Functional Drinks
- 5.3.4 Carbonated Soft Drinks and Water
- 5.3.5 Other Beverages
- 5.4 By Packaging Format
- 5.4.1 Rigid
- 5.4.2 Flexible
6 COMPETITIVE LANDSCAPE
- 6.1 Market Concentration
- 6.2 Strategic Moves
- 6.3 Market Share Analysis
- 6.4 Company Profiles (includes Global level Overview, Market level overview, Core Segments, Financials as available, Strategic Information, Market Rank/Share for key companies, Products and Services, and Recent Developments)
- 6.4.1 Ball Corporation
- 6.4.2 Crown Holdings Inc.
- 6.4.3 Owens-Illinois Inc.
- 6.4.4 Ardagh Group
- 6.4.5 Amcor plc
- 6.4.6 Berry Global Inc.
- 6.4.7 Silgan Holdings Inc.
- 6.4.8 WestRock Co.
- 6.4.9 Berlin Packaging
- 6.4.10 Sonoco Products Co.
- 6.4.11 CCL Containers Inc.
- 6.4.12 Graphic Packaging Holding
- 6.4.13 Tetra Pak Inc.
- 6.4.14 SIG Combibloc
- 6.4.15 Canpack S.A.
- 6.4.16 Plastipak Holdings Inc.
- 6.4.17 Novolex
- 6.4.18 Printpack Inc.
- 6.4.19 ProAmpac LLC
- 6.4.20 American Canning
7 MARKET OPPORTUNITIES AND FUTURE OUTLOOK
- 7.1 White-space and Unmet-Need Assessment

 2026-2030年全球飲料包裝市場
 飲料容器:市場佔有率分析、產業趨勢與統計、成長預測(2026-2031)
 包裝飲料市場報告:趨勢、預測與競爭分析(至2035年)飲料包裝:市場佔有率分析、產業趨勢與統計、成長預測(2026-2031)
 全球飲料包裝器材市場規模、佔有率、趨勢和成長分析報告(2026-2034年)
 飲料包裝市場預測至2034年-按材料、包裝類型、飲料類型、技術和地區分類的全球分析
 非酒精飲料包裝市場規模、佔有率和成長分析:按包裝類型、材料類型、飲料類型、應用、最終用戶、分銷管道和地區分類-2026-2033年產業預測
 飲料包裝市場:2026-2032年全球市場預測(依飲料類型、材料類型、包裝形式、營運模式、包裝功能及通路分類)全球飲料容器市場規模、佔有率、趨勢和成長分析報告(2026-2034)2034年環保飲料包裝市場預測-按產品類型、材料類型、包裝形式、飲料類型、最終用戶、通路和地區分類的全球分析