


 |
市場調查報告書
商品編碼
2114448
飲料容器:市場佔有率分析、產業趨勢與統計、成長預測(2026-2031)Beverage Container - Market Share Analysis, Industry Trends & Statistics, Growth Forecasts (2026 - 2031) |
||||||

※ 本網頁內容可能與最新版本有所差異。詳細情況請與我們聯繫。
根據 Mordor Intelligence 預測,飲料容器市場規模預計將在 2026 年達到 2,310.3 億美元,到 2031 年達到 3,055.5 億美元,在此期間的複合年成長率為 5.75%。
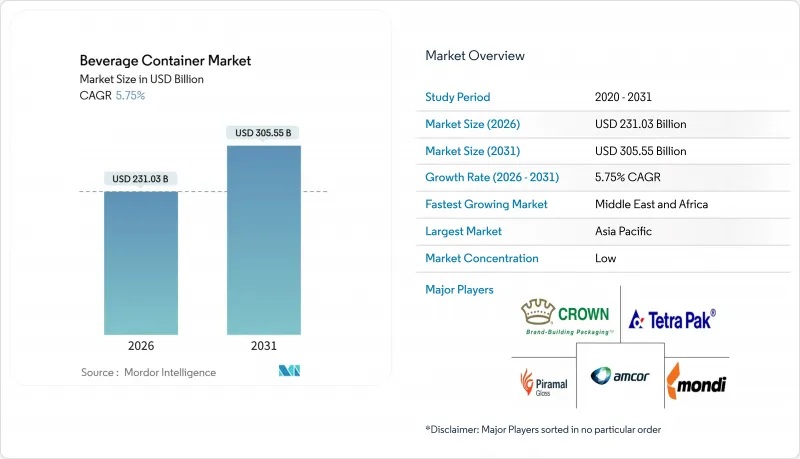
本報告按材料(塑膠、金屬、玻璃、紙張和可堆肥/可生物分解材料)、飲料類型(含酒精飲料和非酒精飲料)、包裝類型(瓶/罐、罐裝、袋裝、盒中袋、紙盒)、分銷管道(直接和間接)以及地區(北美、南美、歐洲等)進行細分。市場預測以美元計價。
全球飲料容器市場趨勢與洞察
即飲型非酒精飲料消費量激增
在消費者日益重視健康和便利性的趨勢推動下,外帶咖啡、茶和機能水的需求不斷成長。品牌商報告稱,其即飲產品線的銷售額實現了兩位數的成長,其中含有電解質和適應原的新產品佔所有新推出的非酒精飲料的五分之一以上。這種轉變對無菌填充、先進的阻隔塗層和氮氣填充技術提出了更高的要求,以便在無需冷藏的情況下保留營養成分。帶有防篡改瓶蓋的薄壁寶特瓶正成為主流的新規格。加工商正在投資伺服驅動的吹塑成型機和線上視覺系統,這些系統能夠檢測小於50微米的壁厚變化,即使在大規模生產中也能確保產品的輕量化和高品質。
寶特瓶的需求日益成長,因為它兼具便利性和輕盈性。
輕量化已從單純的成本削減措施演變為品牌差異化的關鍵因素。可口可樂的13.2克弧形瓶在保持頂部裝載性能的同時,減少了8%的原生樹脂用量,每年可節省6000噸材料。如今,供應商提供的拉伸吹塑成型成型平台能夠生產9克重的0.5升瓶型,並能承受超過12公斤的托盤負荷。監管政策的發展正在加速這一趨勢。歐盟強制要求到2025年,PET(聚對苯二甲酸乙二醇酯)中再生PET的含量達到25%,這將進一步提升輕量化設計帶來的經濟效益,抵消rPET(再生聚對苯二甲酸乙二醇酯)成本的上漲。生命週期評估(LCA)表明,在數十億件產品組合中,每減少1克重量即可減少數千噸二氧化碳當量排放,符合科學碳目標舉措(SBTi)的基準。
全球對一次性塑膠製品製定了嚴格的法規
政策差異迫使跨國公司調整產品系列,以滿足歐洲的繫繩瓶蓋、加拿大不列顛哥倫比亞省的可重複填充容器以及印度30%的rPET含量等要求。這些不一致之處增加了合規成本,加速了鋁製和玻璃容器的普及,並使全球SKU的統一變得更加複雜。低價品牌尤其面臨困境,因為在價格敏感的市場,330毫升鋁罐的價格幾乎是PET罐的兩倍,儘管鋁罐具有更優異的可回收性,但其普及率仍然受到限制。
細分市場分析
2025年,塑膠仍將佔據飲料容器市場48.54%的佔有率。這主要得益於PET的透明性、多功能阻隔性能以及全球完善的回收基礎設施。然而,隨著再生材料含量法規的日益嚴格,塑膠容器市場的成長勢頭將面臨挑戰,這將推高成本,並促使創新預算轉向更輕的材料和化學回收技術。金屬容器約佔28%的市場佔有率,其中鋁罐因其可無限循環利用的特性以及在貨架上的高階形象,在能量飲料和精釀啤酒領域越來越受歡迎。玻璃容器約佔16%的市場佔有率,在葡萄酒、烈酒和高階果汁等細分市場中保持著一定的地位,但其惰性和透明性會增加物流成本。
可堆肥和可生物分解塑膠正從試驗階段走向商業化,預計到2031年將以7.32%的複合年成長率成長。用於運動飲料的海藻膠囊、獲得FDA批准的聚羥基烷酯(PHA)瓶以及用於保存期限長的茶葉的玉米粉薄膜,都體現了品牌在產品使用後尋求差異化發展的趨勢。然而,除西歐和加州以外,工業堆肥基礎設施的匱乏阻礙了這些產品的廣泛應用。紙盒和混合複合材料目前佔據市場主導地位,但多層結構會阻礙閉合迴路回收,因此會受到生產者延伸責任制(EPR)的處罰。
預計到2025年,非酒精飲料將佔據63.32%的市場佔有率,並持續以6.64%的複合年成長率成長至2031年,從而推動飲料容器市場的整體成長。碳酸飲料仍然佔據銷售主導地位,但為了規避新的糖稅,它們現在開始使用不含阿斯巴甜的PET材質來包裝低糖產品。冷壓果汁、植物奶和蛋白奶昔傾向於使用玻璃或不透明的高密度聚乙烯(HDPE)容器,以突顯其新鮮度和營養價值。康普茶和機能水雖然銷量總量小規模,但成長勢頭強勁,達到中等個位數水平,通常採用琥珀色玻璃瓶或纖薄的鋁製容器包裝,以保護益生菌免受紫外線劣化。
酒精飲料佔市佔率的36.68%,其餘則由酒精飲料構成。精釀啤酒和即飲雞尾酒擴大採用鋁罐包裝,因為鋁罐冷卻速度更快、重量更輕,而且可以規避活動場所對玻璃容器的限制。盒裝葡萄酒(BIB)易於控制份量,開封後保存期限更長,目前在斯堪地那維亞和澳洲的銷售量已達兩位數。在烈酒領域,200毫升鋁瓶(適用於音樂節和電商小包裹配送)正在接受測試,但玻璃瓶仍然是主流容器。
區域分析
預計到2025年,亞太地區將佔據40.23%的市場。這主要得益於中國即飲茶市場的蓬勃發展以及印度低溫運輸的加速發展。日本罐頭製造商正在推進可重複密封蓋和熱敏油墨等創新技術,而澳洲的押金返還制度已使PET塑膠的回收率超過85%。東南亞各地的本地瓶裝商正在引進高速生產線,生產小包裝產品,以滿足都市區通勤者不斷變化的生活方式。
預計中東和非洲將經歷最快的成長,到2031年複合年成長率將達到7.84%。沙烏地阿拉伯「2030願景」計畫的資金支持了飲料生產設施的建設,而阿拉伯聯合大公國的高階礦泉水市場正從PET瓶轉向輕質玻璃瓶。埃及和奈及利亞的成長要素,但主要城市以外地區基礎設施的落後限制了出貨量的短期成長。押金返還計畫的試點實施和糖稅的引入也推動了包裝創新,使其朝著更小的寶特瓶和輕量易拉罐的方向發展。
歐洲約佔22%的市場佔有率,其特點是嚴格的生產者延伸責任制(EPR)收費和押金返還機制,這些措施促進了閉合迴路鋁和高濃度rPET的使用。在德國,超過90%的一次性塑膠瓶已被回收,為國內回收商提供了重要的原料來源。法國和英國正在逐步收緊對原生塑膠的處罰,這鼓勵了可重複填充產品和具有可回收認證的單一材料包裝袋的使用。北美約佔18%的市場佔有率,加州的再生材料含量法規正在影響全美的籌資策略。製造商的目標是到2032年達到65%的再生塑膠使用率。南美洲構成了全球市場版圖的最後部分,巴西可回收玻璃容器的高普及率降低了包裝成本,並提高了消費者對可重複填充系統的忠誠度。
其他好處:
- Excel格式的市場預測(ME)表
- 3個月的分析師支持
目錄
第1章:引言
- 研究假設和市場定義
- 調查範圍
第2章:調查方法
第3章執行摘要
第4章 市場狀況
- 市場概覽
- 市場促進因素
- 即飲型非酒精飲料的消費量正在激增。
- 對便利輕便的寶特瓶。
- 新興經濟體中產階級可支配所得的成長
- 擴大對永續和可回收包裝的監管範圍
- 在自動化分類中引入數位浮水印
- 飲料品牌向直接面對消費者的電子商務轉型
- 市場限制因素
- 全球對一次性塑膠製品製定了嚴格的法規
- 鋁和PET樹脂等原料價格的波動
- 食品用rPET原料供應有限。
- 可填充和可重複使用系統的興起正在蠶食一次性產品的銷售量。
- 產業價值鏈分析
- 宏觀經濟因素對市場的影響
- 監理情勢
- 技術展望
- 波特五力分析
第5章 市場規模與成長預測
- 材料
- 塑膠
- 金屬
- 玻璃
- 紙
- 可堆肥和可生物分解的材料(玉米澱粉、甘蔗或藻類)
- 按飲料類型
- 酒精飲料
- 啤酒
- 葡萄酒
- 烈酒
- 其他酒精飲料
- 非酒精性
- 汁
- 碳酸軟性飲料(CSDs)
- 乳製品飲料
- 其他非酒精飲料
- 酒精飲料
- 按包裝類型
- 瓶子和罐子
- 坎
- 小袋
- 盒中袋
- 紙盒
- 透過分銷管道
- 直接的
- 間接
- 按地區
- 北美洲
- 美國
- 加拿大
- 墨西哥
- 南美洲
- 巴西
- 阿根廷
- 其他南美國家
- 歐洲
- 德國
- 英國
- 法國
- 義大利
- 西班牙
- 其他歐洲國家
- 亞太地區
- 中國
- 印度
- 日本
- 韓國
- 澳洲
- 其他亞太國家
- 中東和非洲
- 中東
- 沙烏地阿拉伯
- 阿拉伯聯合大公國
- 土耳其
- 其他中東國家
- 非洲
- 南非
- 埃及
- 奈及利亞
- 其他非洲國家
- 中東
- 北美洲
第6章 競爭情勢
- 市場集中度
- 策略趨勢
- 市佔率分析
- 公司簡介
- Amcor plc
- Ball Corporation
- Crown Holdings Incorporated
- Ardagh Group SA
- Owens-Illinois Inc.
- Tetra Pak International SA
- Mondi Group
- Smurfit WestRock
- Vetropack Holding AG
- Gerresheimer AG
- Piramal Glass Private Limited
- Alpha Packaging Inc.
- Consolidated Container Company LLC
- Silgan Holdings Inc.
- Can-Pack SA
- Graphic Packaging International
- Tetra Pak International SA
- SIG Group International AG
第7章 市場機會與未來展望
According to Mordor Intelligence, the beverage container market size is USD 231.03 billion in 2026 and is projected to reach USD 305.55 billion by 2031, registering a 5.75% CAGR over the period.
This report is Segmented by Material (Plastic, Metal, Glass, Paper, and Compostable and Biodegradable Materials), Beverages Type (Alcoholic, and Non-Alcoholic), Packaging Type (Bottles and Jars, Cans, Pouches, Bag-In-Box, and Cartons), Distribution Channel (Direct, and Indirect), and Geography (North America, South America, Europe, and More). The Market Forecasts are Provided in Terms of Value (USD).
Global Beverage Container Market Trends and Insights
Surging Consumption of Ready-to-Drink Non-Alcoholic Beverages
Health and convenience motives are steering consumers toward grab-and-go coffees, teas, and functional waters. Brand owners report double-digit volume gains in ready-to-drink lines, and launches featuring electrolytes or adaptogens now exceed one-fifth of all non-alcoholic introductions. This shift demands aseptic filling, advanced barrier coatings, and nitrogen-flush capabilities that safeguard nutrients without refrigeration. Thin-wall PET coupled with tamper-evident closures dominates new specifications. Converter investment is flowing into servo-driven blow-molding and inline vision systems that detect sub-50-micron wall variations, ensuring lightweight integrity at scale.
Rising Demand for Convenient and Lightweight PET Bottles
Lightweighting has moved from a cost tactic to a brand differentiator. Coca-Cola's 13.2-gram contour bottle reduced virgin resin use by 8% while maintaining top-load performance, preventing 6,000 metric tons of material consumption annually. Equipment vendors now offer stretch-blow platforms capable of 9-gram half-liter designs that withstand pallet loads exceeding 12 kilogram-force. Regulatory triggers accelerate the trend; the European Union mandates 25% recycled content in PET by 2025, amplifying the economic case for lighter walls that offset higher rPET costs. Life-cycle assessments confirm that shaving a single gram across a multi-billion-unit fleet trims thousands of metric tons of CO2 equivalents, aligning with Science Based Targets initiative benchmarks.
Stringent Global Regulations Against Single-Use Plastics
Policy divergence forces multinational portfolios to juggle tethered closures in Europe, refillables in British Columbia, and 30% rPET content in India. Non-alignment inflates compliance overheads, accelerates format substitution toward aluminum and glass, and complicates global SKU harmonization. Value brands struggle most, since a 330-milliliter aluminum can can cost nearly double its PET counterpart in price-sensitive markets, limiting adoption despite better recyclability.
Other drivers and restraints analyzed in the detailed report include:
- Expansion of Middle-Class Disposable Income in Emerging Economies
- Growth in Sustainable and Recyclable Packaging Mandates
- Volatility in Raw Material Prices for Aluminum and PET Resins
For complete list of drivers and restraints, kindly check the Table Of Contents.
Segment Analysis
Plastic retained 48.54% of the beverage container market share in 2025, powered mainly by PET's clarity, barrier versatility, and global recycling infrastructure. The segment's momentum, however, confronts stricter recycled-content rules that lift costs and shift innovation budgets toward weight reduction and chemical recycling. Metal holds roughly 28% share as aluminum cans gain favor in energy drinks and craft beer owing to infinite recyclability and premium shelf appeal. Glass sits near 16%, defending wine, spirits, and premium juice niches where inertness and transparency warrant higher logistics costs.
Compostable and biodegradable resins are moving from pilot scale to commercialization, expanding at a 7.32% CAGR to 2031. Seaweed-based capsules for sports drinks, FDA-approved polyhydroxyalkanoate bottles, and corn-starch films for ambient tea all speak to brands seeking end-of-life differentiation. Yet industrial composting gaps outside Western Europe and California temper broad uptake. Paper cartons and hybrid laminates round out the remainder, but face Extended Producer Responsibility penalties when multi-layer formats impede closed-loop recovery.
Non-alcoholic lines composed 63.32% of market share in 2025 and are on track for 6.64% CAGR through 2031, underpinning overall beverage container market growth. Carbonated soft drinks still lead units but now rely on aspartame-resistant PET to support diet variants that skirt new sugar taxes. Cold-pressed juices, plant-based milks, and protein shakes favor glass or opaque HDPE to signal freshness and nutritional integrity. Kombucha and functional waters, although smaller in absolute liters, post high-single-digit gains and typically choose amber glass or slim aluminum to shield probiotics from UV degradation.
Alcoholic beverages make up the balance with 36.68% share. Aluminum can adoption is rising in craft beer and ready-to-drink cocktails because cans chill faster, weigh less, and avoid event-venue glass bans. Bag-in-box wine now captures double-digit volume in Scandinavia and Australia by offering portion control and longer post-opening freshness. Spirits experiment with 200-milliliter aluminum bottles that suit festivals and e-commerce parcel shipping, though glass continues to dominate mainstream formats.
Complete Report Scope:
- By Material
- Plastic
- Metal
- Glass
- Paper
- Compostable and Biodegradable Materials (cornstarch, sugarcane, or algae)
- By Beverages Type
- Alcoholic
- Beer
- Wine
- Spirits
- Other Alcoholic Beverages
- Non-Alcoholic
- Juices
- Carbonated Soft Drinks (CSDs)
- Dairy-based Drinks
- Other Non-Alcoholic Beverages
- Alcoholic
- By Packaging Type
- Bottles and Jars
- Cans
- Pouches
- Bag-in-Box
- Cartons
- By Distribution Channel
- Direct
- Indirect
- By Geography
- North America
- United States
- Canada
- Mexico
- South America
- Brazil
- Argentina
- Rest of South America
- Europe
- Germany
- United Kingdom
- France
- Italy
- Spain
- Rest of Europe
- Asia-Pacific
- China
- India
- Japan
- South Korea
- Australia
- Rest of Asia-Pacific
- Middle East and Africa
- Middle East
- Saudi Arabia
- United Arab Emirates
- Turkey
- Rest of Middle East
- Africa
- South Africa
- Egypt
- Nigeria
- Rest of Africa
- Middle East
- North America
Geography Analysis
Asia-Pacific generated 40.23% of market share in 2025, anchored by China's ready-to-drink tea boom and India's accelerating cold-chain build-out. Japanese can makers innovate with resealable tops and thermochromic inks, while Australia's deposit-return scheme has pushed PET recovery above 85%. Local bottlers across Southeast Asia are installing high-speed lines for smaller pack sizes that mesh with rising urban commuter lifestyles.
The Middle East and Africa offer the fastest expansion path, with a 7.84% CAGR through 2031. Vision 2030 funding in Saudi Arabia underwrites beverage production hubs, and the United Arab Emirates' premium water market is shifting from PET to lightweight glass. Egypt and Nigeria see dual drivers of population growth and import substitution, although infrastructure gaps outside tier-one cities temper immediate volume upside. Deposit-return pilots and sugar taxes are also nudging format innovation toward downsized PET and lightweight cans.
Europe holds about a 22% share, distinguished by stringent Extended Producer Responsibility fees and deposit-return mandates that drive closed-loop aluminum and high-rPET usage. Germany now recovers more than 9 out of 10 single-use plastic bottles, forming a critical feedstock pool for domestic recyclers. France and the United Kingdom impose escalating penalties for virgin plastics, catalyzing refills and mono-material pouches with certified recyclability. North America contributes close to 18% share, with California's recycled-content law shaping nationwide sourcing strategies as producers aim for 65% recycled plastic by 2032. South America rounds out the global map, where high returnable glass penetration in Brazil keeps packaging costs low and lifts consumer loyalty to refill systems.
- Amcor plc
- Ball Corporation
- Crown Holdings Incorporated
- Ardagh Group S.A.
- Owens-Illinois Inc.
- Tetra Pak International S.A.
- Mondi Group
- Smurfit WestRock
- Vetropack Holding AG
- Gerresheimer AG
- Piramal Glass Private Limited
- Alpha Packaging Inc.
- Consolidated Container Company LLC
- Silgan Holdings Inc.
- Can-Pack S.A.
- Graphic Packaging International
- Tetra Pak International S.A.
- SIG Group International AG
Additional Benefits:
- The market estimate (ME) sheet in Excel format
- 3 months of analyst support
TABLE OF CONTENTS
1 INTRODUCTION
- 1.1 Study Assumptions and Market Definition
- 1.2 Scope of the Study
2 RESEARCH METHODOLOGY
3 EXECUTIVE SUMMARY
4 MARKET LANDSCAPE
- 4.1 Market Overview
- 4.2 Market Drivers
- 4.2.1 Surging Consumption of Ready-to-Drink Non-Alcoholic Beverages
- 4.2.2 Rising Demand for Convenient and Lightweight PET Bottles
- 4.2.3 Expansion of Middle-Class Disposable Income in Emerging Economies
- 4.2.4 Growth in Sustainable and Recyclable Packaging Mandates
- 4.2.5 Adoption of Digital Watermarking for Automated Sorting
- 4.2.6 Beverage Brands' Shift Toward Direct-to-Consumer E-Commerce Formats
- 4.3 Market Restraints
- 4.3.1 Stringent Global Regulations Against Single-Use Plastics
- 4.3.2 Volatility in Raw Material Prices for Aluminum and PET Resins
- 4.3.3 Limited Food-Grade rPET Feedstock Availability
- 4.3.4 Emerging Refillable and Reuse Systems Cannibalizing Single-Use Volumes
- 4.4 Industry Value Chain Analysis
- 4.5 Impact of Macroeconomic Factors on the Market
- 4.6 Regulatory Landscape
- 4.7 Technological Outlook
- 4.8 Porter's Five Forces Analysis
- 4.8.1 Bargaining Power of Suppliers
- 4.8.2 Bargaining Power of Buyers/Consumers
- 4.8.3 Threat of New Entrants
- 4.8.4 Threat of Substitute Products
- 4.8.5 Intensity of Competitive Rivalry
5 MARKET SIZE AND GROWTH FORECASTS (VALUE)
- 5.1 By Material
- 5.1.1 Plastic
- 5.1.2 Metal
- 5.1.3 Glass
- 5.1.4 Paper
- 5.1.5 Compostable and Biodegradable Materials (cornstarch, sugarcane, or algae)
- 5.2 By Beverages Type
- 5.2.1 Alcoholic
- 5.2.1.1 Beer
- 5.2.1.2 Wine
- 5.2.1.3 Spirits
- 5.2.1.4 Other Alcoholic Beverages
- 5.2.2 Non-Alcoholic
- 5.2.2.1 Juices
- 5.2.2.2 Carbonated Soft Drinks (CSDs)
- 5.2.2.3 Dairy-based Drinks
- 5.2.2.4 Other Non-Alcoholic Beverages
- 5.2.1 Alcoholic
- 5.3 By Packaging Type
- 5.3.1 Bottles and Jars
- 5.3.2 Cans
- 5.3.3 Pouches
- 5.3.4 Bag-in-Box
- 5.3.5 Cartons
- 5.4 By Distribution Channel
- 5.4.1 Direct
- 5.4.2 Indirect
- 5.5 By Geography
- 5.5.1 North America
- 5.5.1.1 United States
- 5.5.1.2 Canada
- 5.5.1.3 Mexico
- 5.5.2 South America
- 5.5.2.1 Brazil
- 5.5.2.2 Argentina
- 5.5.2.3 Rest of South America
- 5.5.3 Europe
- 5.5.3.1 Germany
- 5.5.3.2 United Kingdom
- 5.5.3.3 France
- 5.5.3.4 Italy
- 5.5.3.5 Spain
- 5.5.3.6 Rest of Europe
- 5.5.4 Asia-Pacific
- 5.5.4.1 China
- 5.5.4.2 India
- 5.5.4.3 Japan
- 5.5.4.4 South Korea
- 5.5.4.5 Australia
- 5.5.4.6 Rest of Asia-Pacific
- 5.5.5 Middle East and Africa
- 5.5.5.1 Middle East
- 5.5.5.1.1 Saudi Arabia
- 5.5.5.1.2 United Arab Emirates
- 5.5.5.1.3 Turkey
- 5.5.5.1.4 Rest of Middle East
- 5.5.5.2 Africa
- 5.5.5.2.1 South Africa
- 5.5.5.2.2 Egypt
- 5.5.5.2.3 Nigeria
- 5.5.5.2.4 Rest of Africa
- 5.5.5.1 Middle East
- 5.5.1 North America
6 COMPETITIVE LANDSCAPE
- 6.1 Market Concentration
- 6.2 Strategic Moves
- 6.3 Market Share Analysis
- 6.4 Company Profiles (includes Global Level Overview, Market Level Overview, Core Segments, Financials as available, Strategic Information, Market Rank/Share, Products and Services, and Recent Developments)
- 6.4.1 Amcor plc
- 6.4.2 Ball Corporation
- 6.4.3 Crown Holdings Incorporated
- 6.4.4 Ardagh Group S.A.
- 6.4.5 Owens-Illinois Inc.
- 6.4.6 Tetra Pak International S.A.
- 6.4.7 Mondi Group
- 6.4.8 Smurfit WestRock
- 6.4.9 Vetropack Holding AG
- 6.4.10 Gerresheimer AG
- 6.4.11 Piramal Glass Private Limited
- 6.4.12 Alpha Packaging Inc.
- 6.4.13 Consolidated Container Company LLC
- 6.4.14 Silgan Holdings Inc.
- 6.4.15 Can-Pack S.A.
- 6.4.16 Graphic Packaging International
- 6.4.17 Tetra Pak International S.A.
- 6.4.18 SIG Group International AG
7 MARKET OPPORTUNITIES AND FUTURE OUTLOOK
- 7.1 White-Space and Unmet-Need Assessment

 2026-2030年全球飲料包裝市場
 包裝飲料市場報告:趨勢、預測與競爭分析(至2035年)
 美國飲料包裝:市場佔有率分析、行業趨勢和統計數據、成長預測(2026-2031)飲料包裝:市場佔有率分析、產業趨勢與統計、成長預測(2026-2031)
 全球飲料包裝器材市場規模、佔有率、趨勢和成長分析報告(2026-2034年)
 飲料包裝市場預測至2034年-按材料、包裝類型、飲料類型、技術和地區分類的全球分析
 非酒精飲料包裝市場規模、佔有率和成長分析:按包裝類型、材料類型、飲料類型、應用、最終用戶、分銷管道和地區分類-2026-2033年產業預測
 飲料包裝市場:2026-2032年全球市場預測(依飲料類型、材料類型、包裝形式、營運模式、包裝功能及通路分類)全球飲料容器市場規模、佔有率、趨勢和成長分析報告(2026-2034)2034年環保飲料包裝市場預測-按產品類型、材料類型、包裝形式、飲料類型、最終用戶、通路和地區分類的全球分析