


 |
市場調查報告書
商品編碼
2121746
軟性飲料包裝:市場佔有率分析、產業趨勢與統計、成長預測(2026-2031)Soft Drinks Packaging - Market Share Analysis, Industry Trends & Statistics, Growth Forecasts (2026 - 2031) |
||||||

※ 本網頁內容可能與最新版本有所差異。詳細情況請與我們聯繫。
據 Mordor Intelligence 稱,軟性飲料包裝市場預計到 2026 年價值 1,733.9 億美元,高於 2025 年的 1,651 億美元,預計到 2031 年將達到 2,215.6 億美元。
預計從 2026 年到 2031 年,其複合年成長率將達到 5.02%。
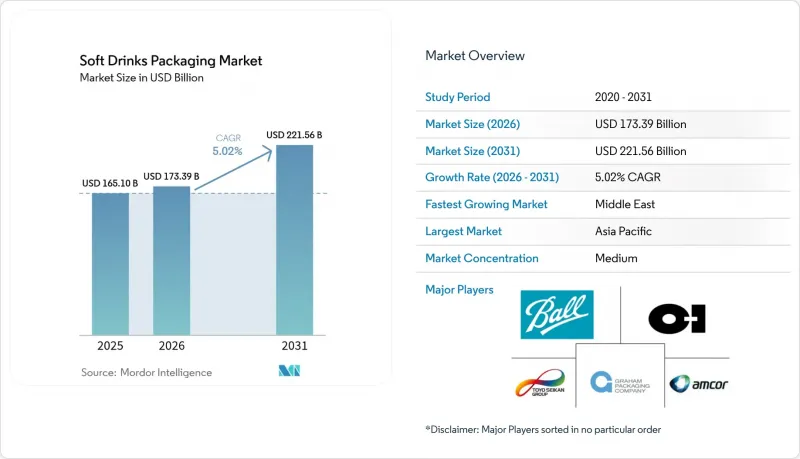
本報告按材質(塑膠、金屬、玻璃及其他)、產品類型(瓶裝、罐裝、紙盒/無菌包裝及其他)、容量(250毫升以下、251-600毫升及其他)、瓶蓋類型(螺旋蓋/運動蓋、皇冠蓋/拉環及其他)、軟性飲料類別(碳酸飲料、分類/果漿及其他)和地區果汁對行業進行分類。市場預測以美元計價。
全球軟性飲料包裝市場趨勢及洞察
輕質寶特瓶和rPET的快速普及
監管目標和成本壓力迫使加工商減少樹脂用量,一些日本寶特瓶的重量現在不到20克,僅為傳統瓶子重量的一半。高回收率(日本90%,歐洲75%)支持閉合迴路經濟,印度的Ganesha EcoPET公司正在擴大rPET產量至4.2萬噸,目標是2026年回收國內25%的瓶子廢棄物。較輕的瓶子可降低15-20%的材料成本,並減少運輸過程中的排放,但要保持儲存期間的風味,必須具備優異的氧氣和二氧化碳阻隔性。
功能性汽水產品線的成長對高階包裝提出了更高的要求。
預計到2026年,全球功能飲料銷售額將達到1,981億美元,這要求包裝能吸引注重健康的消費者,並講述成分背後的故事。 Z世代已貢獻了該品類38%的成長,並且他們非常重視透明度,因此百事公司正在將產品故事融入包裝設計,以證明包裝成本增加20-30%是合理的。金屬罐因其遮光性和優異的氣體阻隔性能而越來越受歡迎,這些性能無需防腐劑即可保護活性成分,延長保存期限,並傳遞出高階品質感。
生產者延伸責任制(EPR)費用正在擠壓利潤空間。
美國已有五個州頒布了生產者責任延伸制度(EPR),到2031年,這些制度將把90%的家庭垃圾回收成本轉嫁給生產者。與可回收性設計掛鉤的環境調整費用可能會使包裝成本上漲2-3%,隨著企業轉向更輕、單一材料的包裝,這可能會擠壓飲料行業的利潤空間。同時,滿足多個州的生產者責任延伸制度(PRO)要求會增加行政負擔,並提高違規處罰的風險。
細分市場分析
到2025年,PET和rPET瓶將主導市場,佔70.80%的銷售量。這反映了它們數十年來在成本、透明度和與生產線的兼容性方面始終保持的優勢。預計到2025年,PET軟性飲料包裝市場規模將達到1,169億美元,隨著食品級rPET供應的改善,預計將保持穩定的中位數個位數成長。 Avantium的PEF和Danimar的PHA開發平臺將推動生質塑膠達到16.8%的複合年成長率。雖然生質塑膠目前仍處於小眾市場,但其卓越的阻隔性能和在整個生命週期內降低的環境影響有望開闢一個高階市場。
品牌轉型、對淨零排放的承諾以及強制性再生材料含量要求,正在加速rPET(再生聚對苯二甲酸乙二醇酯)的普及,即使在價格敏感的市場也是如此。例如,印度已強制規定到2025年,消費後再生材料(PCR)含量必須達到30%。鋁罐的優勢在於其無限循環利用的特性,在歐洲的回收率高達76.1%,但其價格波動較大,對加工商的利潤率帶來了壓力。玻璃在工藝品領域仍保持著高階形象,但同時也帶來了物流的負擔。同時,紙板創新者們正爭分奪秒地尋找PFAS塗層的替代材料,以防即將生效的禁令。
預計到2025年,瓶裝飲料將佔總銷售額的58.45%,這得益於成熟的吹塑成型設備、豐富的SKU尺寸以及環繞式標籤的展示面積。到2031年,瓶裝軟性飲料包裝市場預計將超過1,246億美元,主要得益於阻隔技術的創新,使得輕量化瓶坯成為可能。同時,纖細的鋁罐正以8.42%的複合年成長率快速成長,因為Z世代更注重便攜性和適合拍照的外形,而非容量。
零售商欣賞這種包裝形式的貨架陳列效率,品牌可以在相同填充量的情況下將價格提高高達 20%。隨著利樂公司轉向植物來源聚乙烯(HDPE)瓶蓋,紙盒包裝在冷藏果汁區的市佔率不斷擴大。小包裝袋在新興市場仍然至關重要,即使面臨環境稅的威脅,它們仍然是一個成本極低的入門選擇。
區域分析
亞太地區42.60%的銷售佔有率主要歸功於中產階級購買力的提升、零售網路在都市區的集中分佈,以及完善的舊PET回收體系,這些都促進了低成本的rPET回收利用。日本90%的PET回收率為國內加工商提供了充足的原料,而中國則透過津貼化學回收中心來實現雄心勃勃的再生材料含量目標。印度的生產者責任延伸(EPR)藍圖正在推動對瓶級rPET的需求成長,該地區正逐步成為循環經濟發展的領導者。
預計到2031年,中東地區的複合年成長率將達到6.74%,位居全球之首。這主要歸功於沙烏地阿拉伯和阿拉伯聯合大公國為應對食品安全挑戰而迅速建造本地罐體軋延線和飲料廠。年輕一代更青睞採用精美罐裝的能量飲料,儘管全球鋁價波動,但仍推動了金屬需求的成長。波灣合作理事會(GCC)成員國政府為發展永續產業叢集獎勵,進一步加速了灌裝生產線中再生聚對甲苯(rPET)瓶坯的應用。
在北美,儘管面臨生產者延伸責任制 (EPR) 帶來的成本壓力和鋁板供應緊張,但該公司正受益於人工智慧驅動設計軟體的開創性現場測試,該軟體縮短了新產品上市時間。歐洲在監管方面繼續保持主導。 《塑膠包裝回收條例》(PPWR) 的強制性可回收性要求正在推動對單一材料軟性薄膜和先進解聚技術的投資。在南美,由於 ALPLA 在巴西新建的高密度聚乙烯 (HDPE) 回收工廠以及都市區千禧世代對功能性飲料消費的成長,預計將實現穩步成長。非洲仍然是一個發展中國家,但在城市擴張和冷鏈物流改善的推動下,其銷售量實現了兩位數的成長。然而,回收基礎設施不足限制了再生聚對苯二甲酸乙二醇酯 (rPET) 的應用。
其他好處
- Excel格式的市場預測(ME)表
- 3個月的分析師支持
目錄
第1章:引言
- 研究假設和市場定義
- 調查範圍
第2章:調查方法
第3章執行摘要
第4章 市場狀況
- 市場概覽
- 市場促進因素
- 輕質寶特瓶和rPET的快速普及
- 功能性汽水產品線的成長對高階包裝提出了更高的要求。
- Z世代消費者對便於攜帶飲用的細罐裝飲料的需求
- 擴大瓶到瓶化學品回收能力
- 利用人工智慧驅動的設計平台縮短包裝開發前置作業時間。
- 碳負排放PEF和PHA試驗計畫的商業化。
- 市場限制因素
- 生產者延伸責任制(EPR)費用正在擠壓利潤空間。
- 鋁溢價波動和供應瓶頸
- 由於逐步淘汰 PFAS,阻隔塗層紙板市場受到衝擊。
- 零售商禁止販售一次性可重複使用塑膠製品
- 監理情勢
- 技術展望
- 波特五力分析
- 投資分析(資本投資和併購趨勢)
第5章 市場規模與成長預測
- 材料
- 塑膠(PET、rPET、HDPE、生質塑膠)
- 金屬(鋁、鋼)
- 玻璃
- 紙張和紙板
- 軟性薄膜/可堆肥薄膜
- 依產品類型
- 瓶子
- 能
- 紙盒和無菌包裝
- 小袋/小包
- 襯袋紙盒分裝包裝
- 按產能
- 250毫升或以下
- 251~600mL
- 601mL~1L
- 家庭裝(1公升以上)
- 閉合型
- 螺旋蓋運動帽
- 皇冠拉環
- 卡扣式壓入型
- 智慧互聯門鎖
- 軟性飲料類別
- 碳酸飲料
- 果汁花蜜
- 能量飲料和功能飲料
- 即飲茶和咖啡
- 風味水/氣泡水
- 按地區
- 北美洲
- 美國
- 加拿大
- 墨西哥
- 南美洲
- 巴西
- 阿根廷
- 其他南美國家
- 歐洲
- 德國
- 英國
- 法國
- 義大利
- 西班牙
- 其他歐洲國家
- 亞太地區
- 中國
- 日本
- 印度
- 韓國
- 澳洲
- 其他亞太國家
- 中東
- 以色列
- 沙烏地阿拉伯
- 阿拉伯聯合大公國
- 土耳其
- 其他中東國家
- 非洲
- 南非
- 埃及
- 其他非洲地區
- 北美洲
第6章 競爭情勢
- 市場集中度
- 策略趨勢
- 市佔率分析
- 公司簡介
- Amcor PLC
- Ball Corporation
- Tetra Pak International SA
- Crown Holdings Inc.
- Toyo Seikan Group Holdings Ltd
- Owens-Illinois Inc.
- Graham Packaging Company
- Ardagh Group SA
- CAN-PACK SA
- Refresco Group NV
- CKS Packaging Inc.
- Pacific Can China Holdings
- Berry Global Group Inc.
- Silgan Holdings Inc.
- Huhtamaki Oyj
- Mondi plc
- WestRock Company
- Plastipak Holdings Inc.
- UFlex Ltd.
- Nihon Yamamura Glass Co. Ltd
- Vetropack Holding AG
- Visy Industries
第7章 市場機會與未來展望
According to Mordor Intelligence, soft drink packaging market size in 2026 is estimated at USD 173.39 billion, growing from 2025 value of USD 165.1 billion with 2031 projections showing USD 221.56 billion, growing at 5.02% CAGR over 2026-2031.
This report Segments the Industry Into by Material (Plastic, Metal, Glass and More), Product Type (Bottle, Can, Cartons and Boxes), Capacity (Less Than 250 Ml, 251-600 Ml and More), Closure Type (Screw and Sports Caps, Crown and Pull-Tab and More), Soft-Drink Category (Carbonated Soft Drinks, Juices and Nectars and More) and Geography. The Market Forecasts are Provided in Terms of Value (USD).
Global Soft Drinks Packaging Market Trends and Insights
Surge in PET bottle lightweighting and rPET integration
Regulatory targets and cost pressure are pushing converters to cut resin use, with some Japanese PET bottles now below 20 g-half the traditional weight. High collection rates-90% in Japan versus 75% in Europe-underpin closed-loop economics, while India's Ganesha Ecopet is scaling to 42,000 t rPET to capture 25% of local bottle waste by 2026. Lightweighting trims material cost 15-20% and lowers freight emissions, but demands superior oxygen and CO2 barriers to safeguard taste over shelf life.
Growth of "functional soda" SKUs demanding premium packs
Global functional beverage sales headed toward USD 198.1 billion by 2026 are forcing packs that signal health credentials and enable ingredient storytelling. Gen-Z already drives 38% of category expansion and values transparency, prompting PepsiCo to embed on-pack narratives that justify 20-30% higher packaging spend. Metal cans win favor for their light-blocking and superior gas barriers that protect active compounds without preservatives, sustaining shelf stability and delivering premium cues.
Extended Producer-Responsibility (EPR) fees squeezing margins
Five U.S. states have enacted EPR laws that shift 90% of curbside recycling costs to producers by 2031. Eco-modulated charges tied to design recyclability can push packaging spend up 2-3%, compressing beverage margins while firms retool to lighter, mono-material formats. Navigating multiple state PROs adds administrative load and penalty risk for non-compliance.
Other drivers and restraints analyzed in the detailed report include:
- On-the-go slim-can demand from Gen-Z consumers
- Bottle-to-bottle chemical recycling capacity build-out
- Volatile aluminium premiums and supply bottlenecks
For complete list of drivers and restraints, kindly check the Table Of Contents.
Segment Analysis
PET and rPET bottles dominated with 70.80% revenue in 2025, reflecting a decades-long alignment of cost, clarity, and line compatibility. The soft drink packaging market size for PET equated to USD 116.9 billion in 2025 and is set for stable mid-single-digit expansion as the supply of food-grade rPET improves. Avantium's PEF and Danimer's PHA pipelines underpin a 16.8% CAGR for bioplastics, a niche today but one poised to carve premium categories with superior barrier metrics and lower cradle-to-grave footprints.
Shifting brand targets, net-zero pledges, and recycled-content quotas are hastening rPET uptake even in price-sensitive markets, with India mandating 30% PCR by 2025. Aluminium cans benefit from infinite recyclability and a 76.1% European recycling rate, yet volatile premiums dent converter margins. Glass retains cachet in craft lines but carries logistics penalties, while paperboard innovators scramble to replace PFAS coatings before looming bans take hold.
Bottles commanded 58.45% of 2025 sales thanks to entrenched blow-molding fleets, broad SKU sizes, and wrap-label real estate. The soft drink packaging market size for bottles is forecast to cross USD 124.6 billion by 2031, aided by barrier innovations allowing lower-weight preforms. Slim aluminum cans, however, are surging at 8.42% CAGR as Gen-Z ranks portability and Instagram-ready silhouettes above volume.
Retailers embrace the format's shelf efficiencies, and brands glean up to 20% price uplifts on identical fill volumes. Cartons gain share in chilled juice aisles as Tetra Pak shifts to plant-derived HDPE caps. Sachets remain vital in emerging markets, delivering ultra-low-cost entry points even as eco-taxes loom.
Complete Report Scope:
- By Material
- Plastic (PET, rPET, HDPE, Bioplastics)
- Metal (Aluminium, Steel)
- Glass
- Paper and Paperboard
- Flexible and Compostable Films
- By Product Type
- Bottles
- Cans
- Cartons and Aseptic Bricks
- Pouches and Sachets
- Bag-in-Box / Dispense Packs
- By Capacity
- Less Than 250 ml
- 251-600 ml
- 601-1 L
- More Than 1 L Family Packs
- By Closure Type
- Screw and Sports Caps
- Crown and Pull-tab
- Snap-on / Press-fit
- Smart / Connected Closures
- By Soft-Drink Category
- Carbonated Soft Drinks
- Juices and Nectars
- Energy and Functional Drinks
- RTD Tea and Coffee
- Flavoured and Sparkling Water
- By Geography
- North America
- United States
- Canada
- Mexico
- South America
- Brazil
- Argentina
- Rest of South America
- Europe
- Germany
- United Kingdom
- France
- Italy
- Spain
- Rest of Europe
- Asia-Pacific
- China
- Japan
- India
- South Korea
- Australia
- Rest of Asia-Pacific
- Middle East
- Israel
- Saudi Arabia
- United Arab Emirates
- Turkey
- Rest of Middle East
- Africa
- South Africa
- Egypt
- Rest of Africa
- North America
Geography Analysis
Asia-Pacific's 42.60% revenue share stems from surging middle-class purchasing power, dense urban retail, and robust post-consumer PET recovery systems that fuel low-cost rPET loops. Japan's 90% PET collection rate supplies domestic converters, while China subsidizes chemical recycling hubs to beat ambitious recycled-content goals. India's EPR roadmap intensifies demand for bottle-grade rPET, positioning the region as a bellwether for circular-economy scale-up.
The Middle East posts the highest 6.74% CAGR to 2031 as Saudi Arabia and the UAE fast-track local can-sheet rolling lines and beverage plants in pursuit of food-security agendas. Youthful demographics gravitate to energy drinks packaged in sleek cans, reinforcing metal demand despite global aluminium price swings. Government incentives for sustainable industry clusters further spur adoption of rPET preforms in Gulf Cooperation Council filling lines.
North America wrestles with EPR-induced cost headwinds and aluminium sheet tightness, yet benefits from first-mover commercial trials of AI-driven design software that cuts new-SKU timelines. Europe continues to set the regulatory pace: the PPWR's recyclability mandates catalyze investment in mono-material flexible films and advanced depolymerization. South America secures steady gains through Brazil's new ALPLA HDPE recycling plant and rising consumption of functional drinks among urban millennials. Africa, still nascent, observes double-digit volume growth on the back of urban sprawl and expanding cold-chain logistics, though inadequate collection infrastructure tempers rPET uptake.
- Amcor PLC
- Ball Corporation
- Tetra Pak International SA
- Crown Holdings Inc.
- Toyo Seikan Group Holdings Ltd
- Owens-Illinois Inc.
- Graham Packaging Company
- Ardagh Group SA
- CAN-PACK SA
- Refresco Group NV
- CKS Packaging Inc.
- Pacific Can China Holdings
- Berry Global Group Inc.
- Silgan Holdings Inc.
- Huhtamaki Oyj
- Mondi plc
- WestRock Company
- Plastipak Holdings Inc.
- UFlex Ltd.
- Nihon Yamamura Glass Co. Ltd
- Vetropack Holding AG
- Visy Industries
Additional Benefits:
- The market estimate (ME) sheet in Excel format
- 3 months of analyst support
TABLE OF CONTENTS
1 INTRODUCTION
- 1.1 Study Assumptions and Market Definition
- 1.2 Scope of the Study
2 RESEARCH METHODOLOGY
3 EXECUTIVE SUMMARY
4 MARKET LANDSCAPE
- 4.1 Market Overview
- 4.2 Market Drivers
- 4.2.1 Surge in PET bottle lightweighting and rPET integration
- 4.2.2 Growth of "functional soda" SKUs demanding premium packs
- 4.2.3 On-the-go slim-can demand from Gen-Z consumers
- 4.2.4 Bottle-to-bottle chemical recycling capacity build-out
- 4.2.5 AI-enabled design platforms cutting packaging development lead-times
- 4.2.6 Carbon-negative PEF and PHA pilots reaching commercial scale
- 4.3 Market Restraints
- 4.3.1 Extended Producer-Responsibility (EPR) fees squeezing margins
- 4.3.2 Volatile aluminium premiums and supply bottlenecks
- 4.3.3 PFAS phase-outs disrupting barrier-coated paperboard
- 4.3.4 Retailer bans on single-use secondary plastics
- 4.4 Regulatory Landscape
- 4.5 Technological Outlook
- 4.6 Porter's Five Forces Analysis
- 4.6.1 Threat of New Entrants
- 4.6.2 Bargaining Power of Suppliers
- 4.6.3 Bargaining Power of Buyers
- 4.6.4 Threat of Substitutes
- 4.6.5 Competitive Rivalry
- 4.7 Investment Analysis (CapEx and MandA Trends)
5 MARKET SIZE AND GROWTH FORECASTS (VALUES)
- 5.1 By Material
- 5.1.1 Plastic (PET, rPET, HDPE, Bioplastics)
- 5.1.2 Metal (Aluminium, Steel)
- 5.1.3 Glass
- 5.1.4 Paper and Paperboard
- 5.1.5 Flexible and Compostable Films
- 5.2 By Product Type
- 5.2.1 Bottles
- 5.2.2 Cans
- 5.2.3 Cartons and Aseptic Bricks
- 5.2.4 Pouches and Sachets
- 5.2.5 Bag-in-Box / Dispense Packs
- 5.3 By Capacity
- 5.3.1 Less Than 250 ml
- 5.3.2 251-600 ml
- 5.3.3 601-1 L
- 5.3.4 More Than 1 L Family Packs
- 5.4 By Closure Type
- 5.4.1 Screw and Sports Caps
- 5.4.2 Crown and Pull-tab
- 5.4.3 Snap-on / Press-fit
- 5.4.4 Smart / Connected Closures
- 5.5 By Soft-Drink Category
- 5.5.1 Carbonated Soft Drinks
- 5.5.2 Juices and Nectars
- 5.5.3 Energy and Functional Drinks
- 5.5.4 RTD Tea and Coffee
- 5.5.5 Flavoured and Sparkling Water
- 5.6 By Geography
- 5.6.1 North America
- 5.6.1.1 United States
- 5.6.1.2 Canada
- 5.6.1.3 Mexico
- 5.6.2 South America
- 5.6.2.1 Brazil
- 5.6.2.2 Argentina
- 5.6.2.3 Rest of South America
- 5.6.3 Europe
- 5.6.3.1 Germany
- 5.6.3.2 United Kingdom
- 5.6.3.3 France
- 5.6.3.4 Italy
- 5.6.3.5 Spain
- 5.6.3.6 Rest of Europe
- 5.6.4 Asia-Pacific
- 5.6.4.1 China
- 5.6.4.2 Japan
- 5.6.4.3 India
- 5.6.4.4 South Korea
- 5.6.4.5 Australia
- 5.6.4.6 Rest of Asia-Pacific
- 5.6.5 Middle East
- 5.6.5.1 Israel
- 5.6.5.2 Saudi Arabia
- 5.6.5.3 United Arab Emirates
- 5.6.5.4 Turkey
- 5.6.5.5 Rest of Middle East
- 5.6.6 Africa
- 5.6.6.1 South Africa
- 5.6.6.2 Egypt
- 5.6.6.3 Rest of Africa
- 5.6.1 North America
6 COMPETITIVE LANDSCAPE
- 6.1 Market Concentration
- 6.2 Strategic Moves
- 6.3 Market Share Analysis
- 6.4 Company Profiles (includes Global level Overview, Market level Overview, Core Segments, Financials as available, Strategic Information, Market Rank/Share, Products and Services, Recent Developments)
- 6.4.1 Amcor PLC
- 6.4.2 Ball Corporation
- 6.4.3 Tetra Pak International SA
- 6.4.4 Crown Holdings Inc.
- 6.4.5 Toyo Seikan Group Holdings Ltd
- 6.4.6 Owens-Illinois Inc.
- 6.4.7 Graham Packaging Company
- 6.4.8 Ardagh Group SA
- 6.4.9 CAN-PACK SA
- 6.4.10 Refresco Group NV
- 6.4.11 CKS Packaging Inc.
- 6.4.12 Pacific Can China Holdings
- 6.4.13 Berry Global Group Inc.
- 6.4.14 Silgan Holdings Inc.
- 6.4.15 Huhtamaki Oyj
- 6.4.16 Mondi plc
- 6.4.17 WestRock Company
- 6.4.18 Plastipak Holdings Inc.
- 6.4.19 UFlex Ltd.
- 6.4.20 Nihon Yamamura Glass Co. Ltd
- 6.4.21 Vetropack Holding AG
- 6.4.22 Visy Industries
7 MARKET OPPORTUNITIES AND FUTURE OUTLOOK
- 7.1 White-space and Unmet-Need Assessment

 中東和非洲軟性飲料包裝:市場佔有率分析、行業趨勢和統計數據以及成長預測(2026-2031 年)
 軟性飲料包裝市場:2026-2032年全球市場預測(依包裝材料、包裝形式、產品類型、包裝規格及最終用途產業分類)
 軟性飲料包裝市場機會、成長促進因素、產業趨勢分析及預測(2026-2035年)南美軟性飲料包裝:市場佔有率分析、產業趨勢與統計、成長預測(2026-2031)
 軟性飲料包裝市場-2026-2031年預測北美軟性飲料包裝:市場佔有率分析、行業趨勢和成長預測(2025-2030 年)拉丁美洲軟性飲料包裝:市場佔有率分析、行業趨勢和成長預測(2025-2030 年)歐洲軟性飲料包裝:市場佔有率分析、產業趨勢、成長預測(2025-2030)美國軟性飲料包裝:市場佔有率分析、行業趨勢和統計、成長預測(2025-2030 年)