


 |
市場調查報告書
商品編碼
2121744
資料中心電力:市場佔有率分析、產業趨勢與統計、成長預測(2026-2031 年)Data Center Power - Market Share Analysis, Industry Trends & Statistics, Growth Forecasts (2026 - 2031) |
||||||

※ 本網頁內容可能與最新版本有所差異。詳細情況請與我們聯繫。
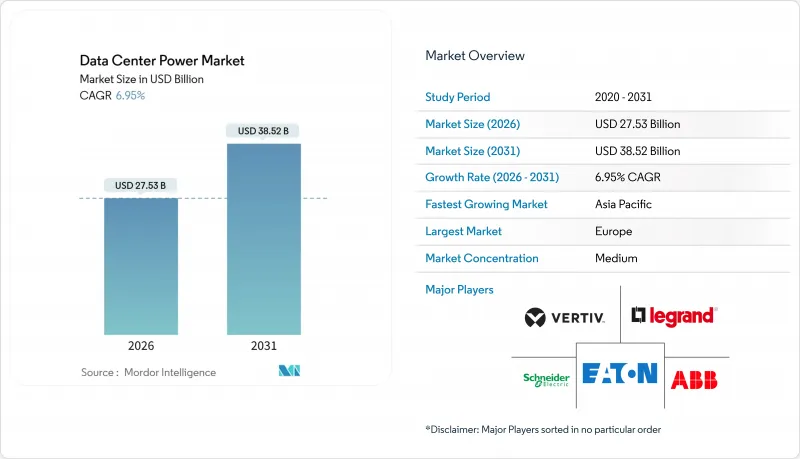
根據 Mordor Intelligence 預測,資料中心電力市場規模預計將在 2026 年達到 275.3 億美元,到 2031 年達到 385.2 億美元,在此期間的複合年成長率為 6.95%。
本報告按組件(電氣解決方案和服務)、等級(一級和二級、三級、四級)、資料中心規模(小規模、中型、大型、超大規模)、資料中心類型(託管、超大規模資料中心業者/雲端服務供應商、企業級和邊緣運算)以及地區(北美、南美、歐洲、亞太、中東和非洲)進行細分。市場預測以美元計價。
全球資料中心電力市場趨勢及洞察
超大規模和雲端運算的擴展
校園專案的IT負載現已超過100兆瓦,因此每個站點都需要配備專用的230千伏變電站和N+1配置的發電機組。微軟計劃在2025年運作15吉瓦的容量,並已採用標準化的模組化開關設備,可在不關閉運作中機架的情況下進行擴充。亞馬遜網路服務(AWS)正在試行使用功耗為200千瓦的液冷機櫃,在減少占地面積的同時,將機架密度提高了一倍。谷歌已在其人工智慧叢集中採用480伏特直流配電,將交流-直流損耗降低了8%。這些設計正在加速對母線槽、大容量配電單元(PDU)和能夠處理超過1000安培連續電流的固態斷路器的需求。
人工智慧主導的高密度工作負載
生成式人工智慧的訓練已將GPU叢集的功耗推高至每機房40-50兆瓦,比虛擬化企業工作負載高出十倍。業者正在放棄架空佈局,轉而採用架空母線槽和位於熱源3公尺範圍內的龍頭式冷卻系統。隨著超大規模資料中心業者對其現有機房維修, Vertiv的Liebert EXL S1系列UPS(每個模組額定功率為1.5兆瓦)在2025年的訂單成長了140%。鋰離子電池櫃的面積僅為閥控式鉛酸電池組的三分之一,但即使在滿載運轉時也能提供15分鐘的持續供電。Schneider Electric的「Galaxy VXL」整合了一塊3兆瓦時的電池,效率高達97.5%,可將每兆瓦受保護功率的熱負荷降低30千瓦。
電力基礎設施的高額資本支出
一座10兆瓦的Tier 3級電站需要1500萬至2000萬美元的電氣設備投資,而超過100兆瓦的超大規模電站,包括變電站和氣體絕緣開關設備在內,總成本可能超過2億美元。新興市場的資金籌措機會仍然有限,新建輸電線路的核准可能需要18至24個月,這增加了擁有成本。 Vertiv的模組化智慧配電櫃可將安裝時間縮短40%,並將獲利時間縮短8週,但初始投資負擔阻礙了中型企業的進入。融資壓力正在推動「訂閱服務」模式的發展,在這種模式下,供應商擁有開關設備並收取月費,但這種模式的普及仍處於早期階段。
細分市場分析
服務業在資料中心電力市場中的佔有率正在不斷擴大。這主要歸功於營運商將混合(柴油、天然氣和氫能)發電設施的整合以及預測性維護合約外包。以鋰離子UPS系統、固態斷路器和機架級PDU為代表的電氣解決方案,預計2025年將繼續佔63.54%的收入佔有率。隨著供應商將安裝、韌體和遠端監控服務捆綁銷售,業務收益正以7.43%的複合年成長率成長。Schneider Electric表示,到2025年,其資料中心收入的38%將來自多年期服務契約,這反映出採購模式正向基於結果的模式轉變。
UPS產品線現已支援500千瓦的擴充模組,可部署在IT負載附近,並配備符合都市區排放法規的天然氣和氫氣發電機。開關設備採用碳化矽固態元件,面板厚度減少40%,故障隔離時間少於2毫秒。儲能機架正從單純的備用功能發展成為電網支援資產,在有組織的市場中,每兆瓦時每年可產生5萬至10萬美元的收入。日益複雜的現場作業進一步提升了服務的價值提案,尤其是在技術純熟勞工稀缺且對正常運轉率要求嚴格的市場中。
三級資料中心(Tier 3)預計在2025年將佔資料中心部署總量的64.42%,憑藉99.982%的可用性和適中的資本密集度,在資料中心電力市場佔據重要佔有率。四級資料中心(Tier 4)的成本比三級資料中心高出25-30%,但由於受監管產業對容錯能力的需求不斷成長,其年複合成長率(CAGR)高達7.65%。三級資料中心的保險費可能高出40%,而且一次斷電造成的損失可能超過節省的資本,因此,對於關鍵任務型工作負載而言,四級認證至關重要。
供應商正透過模組化架構來應對這項挑戰,從而實現分階段過渡。伊頓的 Power Xpert 9395P 允許並聯連接額外的 UPS 組,而無需移除現有設備。 ISO/IEC 22237 和 ANSI/TIA-942 標準現已納入公共採購條款,實際上強制要求政府工作負載達到 Tier 4 等級。人工智慧密度的不斷提高進一步推動了 Tier 4 標準的採用,因為意外的 GPU 叢集停機會延長重新訓練週期。
區域分析
預計到2025年,歐洲將引領全球資料中心電力市場,佔38.54%的收入佔有率,主要得益於德國、英國和法國嚴格的能源效率法規以及邊緣節點的成長。光是在法蘭克福,由於銀行對其支付系統提出了低延遲連線的需求,託管容量就增加了45兆瓦。在倫敦碼頭區,營運商對38兆瓦的容量進行了運作,這得益於倫敦環網主幹線132千伏的升級改造。在巴黎,為了符合限制冷卻器輸出的熱島效應法規,採用了液冷技術,這反映了市政法規對電氣設計的影響。
亞太地區是成長最快的地區,預計到2031年複合年成長率將達到7.91%。中國在2025年批准了北京、上海和深圳共85兆瓦的新增資料中心裝置容量,許可證要求包括電源使用效率(PUE)低於1.25以及可再生能源佔比達到50%或以上。印度2025年國家資料中心政策規定,對於裝置容量20兆瓦及以上的三級資料中心,如果使用國產UPS和開關設備,則可享有五年稅收優惠。日本新增了18兆瓦的資料中心,並強制要求使用能夠承受7級地震的抗震開關設備。在韓國,由三星和SK Telecom投資興建的12兆瓦人工智慧推理中心投入運作。澳洲率先引進了併網資料中心,每兆瓦時可產生8萬美元的輔助服務收入。
北美仍然是最大的單一區域叢集,其中維吉尼亞、德克薩斯州和加利福尼亞州占美國2025年新增容量的60%。在加拿大,多倫多和蒙特婁共新增15兆瓦容量,充分利用了寒冷氣候特有的自然冷卻和低成本水力發電。在墨西哥,克雷塔羅走廊新增8兆瓦容量,用於滿足近岸外包製造商對與美國地區低延遲連線的需求。在中東和非洲,投資集中在杜拜和利雅得,智慧城市計畫正在推動對三級資料中心的需求。巴西在南美洲領先,在聖保羅新增10兆瓦容量,主要受電子商務和金融科技需求的驅動。
其他好處:
- Excel格式的市場預測(ME)表
- 3個月的分析師支持
目錄
第1章:引言
- 研究假設和市場定義
- 調查範圍
第2章:調查方法
第3章執行摘要
第4章 市場狀況
- 市場概覽
- 市場促進因素
- 超大規模和雲端運算的擴展
- AI驅動的高密度工作負載
- 更嚴格的運作和冗餘標準
- 有關永續性和能源效率的法規
- 併網收入來源(計量後)
- 將原燃煤發電廠改建為校園
- 市場限制因素
- 對電力基礎設施的高額資本投資
- 碳強度法規和報告
- 變壓器和開關設備供應瓶頸
- 當地居民反對擴建變電站
- 產業供應鏈分析
- 監理情勢
- 技術展望
- 波特五力分析
- 宏觀經濟因素對市場的影響
第5章 市場規模與成長預測
- 按組件
- 電氣解決方案
- UPS系統
- 發電機
- 柴油發電機
- 瓦斯發電機
- 氫燃料電池發電機
- 配電單元
- 切換裝置
- 傳輸開關
- 遠端電源面板
- 能源儲存系統
- 服務
- 安裝和試運行
- 維護和支援
- 培訓和諮詢
- 電氣解決方案
- 層級特定
- 一級和二級
- 三級
- 第四級
- 按資料中心規模
- 小規模資料中心
- 中型資料中心
- 大型資料中心
- 超大規模資料中心
- 依資料中心類型
- 託管資料中心
- 超大規模資料中心業者資料中心/雲端服務供應商
- 企業和邊緣資料中心
- 按地區
- 北美洲
- 美國
- 加拿大
- 墨西哥
- 南美洲
- 巴西
- 阿根廷
- 其他南美國家
- 歐洲
- 德國
- 英國
- 法國
- 義大利
- 西班牙
- 其他歐洲國家
- 亞太地區
- 中國
- 日本
- 印度
- 韓國
- 澳洲
- 其他亞太國家
- 中東和非洲
- 中東
- 阿拉伯聯合大公國
- 沙烏地阿拉伯
- 土耳其
- 其他中東國家
- 非洲
- 南非
- 奈及利亞
- 其他非洲國家
- 中東
- 北美洲
第6章 競爭情勢
- 市場集中度
- 策略趨勢
- 市佔率分析
- 公司簡介
- Schneider Electric SE
- Vertiv Holdings Co.
- ABB Ltd
- Eaton Corporation plc
- Legrand SA
- Huawei Technologies Co. Ltd
- Fujitsu Ltd
- Cisco Systems Inc.
- Rittal GmbH and Co. KG
- Mitsubishi Electric Corp.
- Cummins Inc.
- Kohler Power Systems
- PDU Experts UK Ltd
- Bloom Energy
- Delta Electronics Inc.
- Caterpillar Inc.
- Socomec Group
- Tripp Lite(by Eaton)
- Riello UPS SpA
- KEHUA Tech
- Fluence Energy
第7章 市場機會與未來展望
According to Mordor Intelligence, the data center power market size reached USD 27.53 billion in 2026 and is forecast to advance to USD 38.52 billion by 2031, reflecting a 6.95% CAGR over the period.
This report is Segmented by Component (Electrical Solution, and Service), Tier Type (Tier 1 and 2, Tier 3, and Tier 4), Data Center Size (Small, Medium, Large, and Hyperscale), Data Center Type (Colocation, Hyperscalers/CSPs, and Enterprise and Edge), and Geography (North America, South America, Europe, Asia-Pacific, and Middle East and Africa). The Market Forecasts are Provided in Terms of Value (USD).
Global Data Center Power Market Trends and Insights
Hyperscale and Cloud-Computing Expansion
Campus projects now exceed 100 megawatts of IT load, and each site requires dedicated 230-kilovolt substations plus N+1 generator farms. Microsoft commissioned 15 gigawatts of capacity in 2025, standardizing on modular switchgear that can be added without interrupting live racks. Amazon Web Services piloted liquid-cooled cabinets that draw 200 kilowatts, doubling rack density while shrinking floor plate. Google adopted 480-volt direct-current distribution for AI clusters, cutting AC-DC losses by 8%. These designs accelerate demand for busway, high-capacity PDUs, and solid-state breakers that tolerate continuous currents above 1,000 amperes.
AI-Driven High-Density Workloads
Generative AI training pushes GPU clusters to 40-50 megawatts per hall, a tenfold rise over virtualized enterprise workloads. Operators are abandoning raised-floor layouts in favor of overhead busways and in-row cooling placed within three meters of heat sources. Vertiv's Liebert EXL S1 UPS line, rated at 1.5 megawatts per module, saw 140% order growth in 2025 as hyperscalers retrofit existing halls. Lithium-ion cabinets now occupy one-third the footprint of valve-regulated lead-acid strings yet provide 15-minute ride-through at full load. Schneider Electric's Galaxy VXL integrates a three-megawatt-hour battery and delivers 97.5% efficiency, lowering thermal load by 30 kilowatts per megawatt protected.
High CAPEX of Electrical Infrastructure
A 10-megawatt Tier 3 facility needs USD 15-20 million in electrical gear, and hyperscale sites above 100 megawatts can exceed USD 200 million, including substations and gas-insulated switchgear. Access to finance remains limited in emerging economies, and new utility feeders can take 18-24 months to approve, adding holding costs. Vertiv's modular Smart Cabinet trims installation labor by 40% and accelerates revenue by eight weeks, yet the upfront outlay still deters mid-tier firms. Capital pressure is prompting growth of service-as-a-subscription models where vendors own switchgear and charge monthly fees, but adoption is still nascent.
Other drivers and restraints analyzed in the detailed report include:
- Stricter Uptime and Redundancy Standards
- Sustainability and Energy-Efficiency Mandates
- Transformer and Switchgear Supply Bottlenecks
For complete list of drivers and restraints, kindly check the Table Of Contents.
Segment Analysis
Services captured a rising slice of the data center power market size as operators outsourced integration of hybrid diesel-gas-hydrogen fleets and predictive maintenance contracts. Electrical solutions still held 63.54% of 2025 revenue, led by lithium-ion UPS systems, solid-state breakers, and rack-level PDUs. Service revenue is advancing at a 7.43% CAGR as suppliers bundle installation, firmware, and remote monitoring. Schneider Electric disclosed that 38% of data-center turnover in 2025 stemmed from multi-year service agreements, reflecting a shift toward outcome-based procurement.
UPS lines now scale in 500-kilowatt blocks positioned near the IT load, while natural-gas and hydrogen generators address urban emission limits. Switchgear adopts solid-state silicon carbide devices that cut panel depth by 40% and isolate faults in under two milliseconds. Energy-storage racks transition from standby roles to grid-support assets that earn USD 50,000-100,000 per megawatt-hour annually in organized markets. Field complexity strengthens the services value proposition, particularly in markets that lack skilled labor and enforce strict uptime clauses.
Tier 3 installations represented 64.42% of 2025 deployments, anchoring the data center power market share due to their balance of 99.982% availability and moderate capital intensity. Tier 4 sites, though costlier by 25-30%, are expanding at a 7.65% CAGR as regulated industries demand fault tolerance. Insurance premiums on Tier 3 halls can run 40% higher, and a single outage may exceed the saved capital, making Tier 4 certification compelling for mission-critical workloads.
Suppliers respond with modular architectures that allow stepwise migration. Eaton's Power Xpert 9395P lets operators parallel an additional UPS string without displacing existing gear. ISO/IEC 22237 and ANSI/TIA-942 standards now appear in public procurement clauses, effectively mandating Tier 4 for government workloads. Rising AI density further drives Tier 4 adoption, because any unexpected shutdown of GPU clusters triggers prolonged retraining cycles.
Complete Report Scope:
- By Component
- Electrical Solution
- UPS Systems
- Generators
- Diesel Generators
- Gas Generators
- Hydrogen Fuel-cell Generators
- Power Distribution Units
- Switchgear
- Transfer Switches
- Remote Power Panels
- Energy-storage Systems
- Service
- Installation and Commissioning
- Maintenance and Support
- Training and Consulting
- Electrical Solution
- By Tier Type
- Tier 1 and 2
- Tier 3
- Tier 4
- By Data Center Size
- Small Data Center
- Medium Data Center
- Large Data Center
- Hyperscale Data Center
- By Data Center Type
- Colocation Data Center
- Hyperscalers Data Center/CSPs
- Enterprise and Edge Data Center
- By Geography
- North America
- United States
- Canada
- Mexico
- South America
- Brazil
- Argentina
- Rest of South America
- Europe
- Germany
- United Kingdom
- France
- Italy
- Spain
- Rest of Europe
- Asia-Pacific
- China
- Japan
- India
- South Korea
- Australia
- Rest of Asia-Pacific
- Middle East and Africa
- Middle East
- United Arab Emirates
- Saudi Arabia
- Turkey
- Rest of Middle East
- Africa
- South Africa
- Nigeria
- Rest of Africa
- Middle East
- North America
Geography Analysis
Europe led with 38.54% of global data center power market revenue in 2025, driven by stringent energy-efficiency statutes and edge-node growth in Germany, the United Kingdom, and France. Frankfurt alone added 45 megawatts of colocation capacity as banks demanded low-latency links to clearing systems. Operators in London's Docklands brought 38 megawatts online, helped by upgrades to the 132-kilovolt London Ring Main. Paris facilities adopted liquid-cooling to comply with heat-island restrictions that cap chiller output, illustrating how municipal rules shape electrical design.
Asia-Pacific is the fastest region, with a 7.91% CAGR projected through 2031. China approved 85 megawatts of new capacity in Beijing, Shanghai, and Shenzhen in 2025, conditioning permits on power-usage effectiveness below 1.25 and 50% renewable energy. India's 2025 National Data Center Policy grants five-year tax holidays for Tier 3 sites above 20 megawatts that source indigenous UPS and switchgear. Japan added 18 megawatts and mandated seismic-rated switchgear that tolerates magnitude 7 seismic events. South Korea saw 12 megawatts of AI inference halls funded by Samsung and SK Telecom. Australia pioneered grid-interactive data centers that earn USD 80,000 per megawatt-hour in ancillary-service revenue.
North America remains the single largest country cluster, with Virginia, Texas, and California accounting for 60% of new U.S. capacity in 2025. Canada added 15 megawatts across Toronto and Montreal, leveraging cold-climate free cooling and low-cost hydropower. Mexico's Queretaro corridor delivered eight megawatts for near-shoring manufacturers needing low-latency links to U.S. regions. The Middle East and Africa drew investment in Dubai and Riyadh where smart-city programs require Tier 3 halls. Brazil led South America with 10 megawatts in Sao Paulo, supported by e-commerce and fintech demand.
- Schneider Electric SE
- Vertiv Holdings Co.
- ABB Ltd
- Eaton Corporation plc
- Legrand SA
- Huawei Technologies Co. Ltd
- Fujitsu Ltd
- Cisco Systems Inc.
- Rittal GmbH and Co. KG
- Mitsubishi Electric Corp.
- Cummins Inc.
- Kohler Power Systems
- PDU Experts UK Ltd
- Bloom Energy
- Delta Electronics Inc.
- Caterpillar Inc.
- Socomec Group
- Tripp Lite (by Eaton)
- Riello UPS S.p.A.
- KEHUA Tech
- Fluence Energy
Additional Benefits:
- The market estimate (ME) sheet in Excel format
- 3 months of analyst support
TABLE OF CONTENTS
1 INTRODUCTION
- 1.1 Study Assumptions and Market Definition
- 1.2 Scope of the Study
2 RESEARCH METHODOLOGY
3 EXECUTIVE SUMMARY
4 MARKET LANDSCAPE
- 4.1 Market Overview
- 4.2 Market Drivers
- 4.2.1 Hyperscale and Cloud-Computing Expansion
- 4.2.2 AI-Driven High-Density Workloads
- 4.2.3 Stricter Uptime and Redundancy Standards
- 4.2.4 Sustainability and Energy-Efficiency Mandates
- 4.2.5 Grid-Interactive Revenue Streams (Behind-the-Meter)
- 4.2.6 Coal-Plant Site Repurposing for Campuses
- 4.3 Market Restraints
- 4.3.1 High CAPEX of Electrical Infrastructure
- 4.3.2 Carbon-Intensity Regulations and Reporting
- 4.3.3 Transformer and Switchgear Supply Bottlenecks
- 4.3.4 Local Opposition to Sub-Station Expansion
- 4.4 Industry Supply-Chain Analysis
- 4.5 Regulatory Landscape
- 4.6 Technological Outlook
- 4.7 Porter's Five Forces Analysis
- 4.7.1 Threat of New Entrants
- 4.7.2 Bargaining Power of Buyers
- 4.7.3 Bargaining Power of Suppliers
- 4.7.4 Threat of Substitute Products
- 4.7.5 Intensity of Competitive Rivalry
- 4.8 Impact of Macroeconomic Factors on the Market
5 MARKET SIZE AND GROWTH FORECASTS (VALUE)
- 5.1 By Component
- 5.1.1 Electrical Solution
- 5.1.1.1 UPS Systems
- 5.1.1.2 Generators
- 5.1.1.2.1 Diesel Generators
- 5.1.1.2.2 Gas Generators
- 5.1.1.2.3 Hydrogen Fuel-cell Generators
- 5.1.1.3 Power Distribution Units
- 5.1.1.4 Switchgear
- 5.1.1.5 Transfer Switches
- 5.1.1.6 Remote Power Panels
- 5.1.1.7 Energy-storage Systems
- 5.1.2 Service
- 5.1.2.1 Installation and Commissioning
- 5.1.2.2 Maintenance and Support
- 5.1.2.3 Training and Consulting
- 5.1.1 Electrical Solution
- 5.2 By Tier Type
- 5.2.1 Tier 1 and 2
- 5.2.2 Tier 3
- 5.2.3 Tier 4
- 5.3 By Data Center Size
- 5.3.1 Small Data Center
- 5.3.2 Medium Data Center
- 5.3.3 Large Data Center
- 5.3.4 Hyperscale Data Center
- 5.4 By Data Center Type
- 5.4.1 Colocation Data Center
- 5.4.2 Hyperscalers Data Center/CSPs
- 5.4.3 Enterprise and Edge Data Center
- 5.5 By Geography
- 5.5.1 North America
- 5.5.1.1 United States
- 5.5.1.2 Canada
- 5.5.1.3 Mexico
- 5.5.2 South America
- 5.5.2.1 Brazil
- 5.5.2.2 Argentina
- 5.5.2.3 Rest of South America
- 5.5.3 Europe
- 5.5.3.1 Germany
- 5.5.3.2 United Kingdom
- 5.5.3.3 France
- 5.5.3.4 Italy
- 5.5.3.5 Spain
- 5.5.3.6 Rest of Europe
- 5.5.4 Asia-Pacific
- 5.5.4.1 China
- 5.5.4.2 Japan
- 5.5.4.3 India
- 5.5.4.4 South Korea
- 5.5.4.5 Australia
- 5.5.4.6 Rest of Asia-Pacific
- 5.5.5 Middle East and Africa
- 5.5.5.1 Middle East
- 5.5.5.1.1 United Arab Emirates
- 5.5.5.1.2 Saudi Arabia
- 5.5.5.1.3 Turkey
- 5.5.5.1.4 Rest of Middle East
- 5.5.5.2 Africa
- 5.5.5.2.1 South Africa
- 5.5.5.2.2 Nigeria
- 5.5.5.2.3 Rest of Africa
- 5.5.5.1 Middle East
- 5.5.1 North America
6 COMPETITIVE LANDSCAPE
- 6.1 Market Concentration
- 6.2 Strategic Moves
- 6.3 Market Share Analysis
- 6.4 Company Profiles (includes Global Level Overview, Market Level Overview, Core Segments, Financials as available, Strategic Information, Market Rank/Share, Products and Services, Recent Developments)
- 6.4.1 Schneider Electric SE
- 6.4.2 Vertiv Holdings Co.
- 6.4.3 ABB Ltd
- 6.4.4 Eaton Corporation plc
- 6.4.5 Legrand SA
- 6.4.6 Huawei Technologies Co. Ltd
- 6.4.7 Fujitsu Ltd
- 6.4.8 Cisco Systems Inc.
- 6.4.9 Rittal GmbH and Co. KG
- 6.4.10 Mitsubishi Electric Corp.
- 6.4.11 Cummins Inc.
- 6.4.12 Kohler Power Systems
- 6.4.13 PDU Experts UK Ltd
- 6.4.14 Bloom Energy
- 6.4.15 Delta Electronics Inc.
- 6.4.16 Caterpillar Inc.
- 6.4.17 Socomec Group
- 6.4.18 Tripp Lite (by Eaton)
- 6.4.19 Riello UPS S.p.A.
- 6.4.20 KEHUA Tech
- 6.4.21 Fluence Energy
7 MARKET OPPORTUNITIES AND FUTURE OUTLOOK
- 7.1 White-Space and Unmet-Need Assessment

 面向人工智慧資料中心的電力柔軟性解決方案的全球市場規模、佔有率和成長預測(2026-2031 年)人工智慧資料中心電力柔軟性系統的市場規模、市場佔有率和成長預測(2026-2032 年)
 資料中心電力、位置和管道智慧—亞太版
 資料中心電力市場成長機會、成長要素、產業趨勢分析及2026-2035年預測
 資料中心電力基礎設施市場預測至 2034 年—按基礎設施組件、資料中心層級、額定功率、電力架構、最終用戶和地區分類的全球分析
 全球資料中心電力市場:機會與策略展望(至2035年)
 歐洲資料中心電力:市場佔有率分析、產業趨勢與統計及成長預測(2026-2032 年)全球資料中心電力基礎設施市場規模、佔有率、趨勢和成長分析報告(2026-2034年)
 資料中心電源市場:按組件類型、層級類型、資料中心類型和產業分類-2026-2032年全球市場預測亞太地區資料中心電力市場:市場佔有率分析、產業趨勢與統計及成長預測(2026-2031年)