


 |
市場調查報告書
商品編碼
2120293
歐洲資料中心電力:市場佔有率分析、產業趨勢與統計及成長預測(2026-2032 年)Europe Data Center Power - Market Share Analysis, Industry Trends & Statistics, Growth Forecasts (2026 - 2032) |
||||||

※ 本網頁內容可能與最新版本有所差異。詳細情況請與我們聯繫。
根據 Mordor Intelligence 預測,歐洲資料中心電力市場規模將從 2025 年的 155.8 億美元成長到 2026 年的 170.1 億美元,到 2032 年將達到 287.6 億美元,2026 年至 2032 年的複合年成長率為 9.14%。
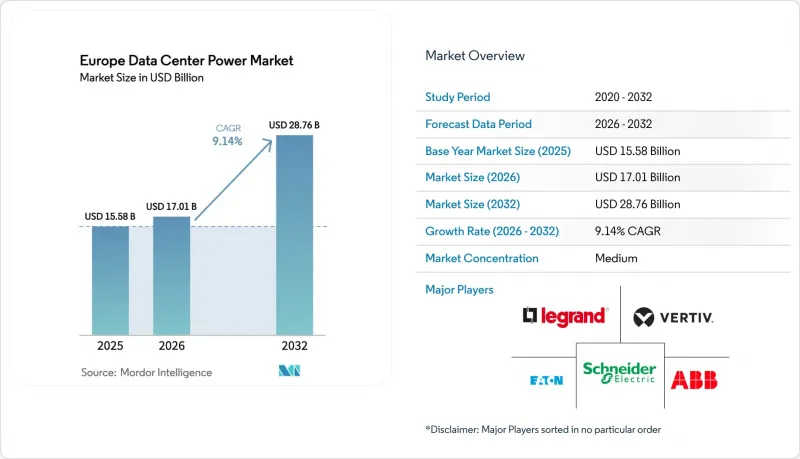
本報告按解決方案類型(配電、備用電源)、服務(設計、諮詢等)、資料中心類型(託管、超大規模等)、最終用戶行業(銀行、金融服務和保險、IT和電信等)、電力容量(3兆瓦以上、其他)、等級標準(Tier I和Tier II等)以及地區(德國、英國等)進行細分。市場預測以美元計價。
歐洲資料中心電力市場的趨勢與洞察
擴大超大規模和超級資料中心的部署
超大規模營運商正在建造類似小規模供電區的園區,他們通常簽署300-500兆瓦的電力連接契約,在某些情況下,還會在園區內建設聯合循環發電廠以確保供電的連續性。微軟在義大利投資43億歐元擴張,以及亞馬遜在歐洲各地部署數吉瓦級的電力設施,都顯示與電力公司直接簽訂合約的模式正在取代傳統的託管租賃模式。預計到2027年,人工智慧訓練叢集的平均機架功率密度將達到500-1000千瓦,而液冷迴路泵負荷的增加將使總電力消耗量增加20-30%。西門子能源的一份報告顯示,2024年14吉瓦燃氣渦輪機訂單積壓中,60%用於資料中心,凸顯了基礎設施擴張前所未有的規模。電力公司正在加緊加強輸電線路,但區域電網仍超負荷運轉。德國監管機構正在加快關鍵基礎設施的核准程序,而在荷蘭,一些面臨電力短缺的市政當局已暫時停止建設。
雲端運算和OTT流量激增
2022年,歐洲資料中心的耗電量為45-65太瓦時(TWh),預計到2035年,隨著4K/8K串流媒體、生成式人工智慧(AI)和擴增實境(AR)服務的普及,這一數字將成長三倍。在大型運動賽事期間,OTT流量激增,業者被迫安裝能夠瞬間應對滿載且無閃爍(電壓波動)的UPS線路。為了降低延遲,超大規模資料中心業者正在西班牙、義大利和東歐部署邊緣節點。每個微型資料中心都需要功率從500千瓦到3兆瓦不等的模組化電源模組,並具備精確的電壓調節功能。歐盟通訊指令要求網路媒體平台的運轉率達到99.9%,這加速了傳統旋轉式UPS被支援快速放電循環的鋰離子或鈉離子UPS所取代的進程。
電力和冷凍設施維修需要較高的初始資本支出(CAPEX)。
將傳統資料中心遷移到 100 kW 機架需要更換所有配電盤、母線槽和配電電纜,通常每千瓦的成本高達 1000 美元。由於通貨膨脹,2023 年至 2024 年間歐洲建築材料價格上漲了 23%,僅電氣設備就佔建築預算的 25%。變壓器和快速斷路器的前置作業時間可能長達 12 至 18 個月,這會延遲收入累計,並給中型服務提供者的現金流帶來壓力。
細分市場分析
到2025年,隨著營運商加快升級開關設備和母線槽以適應日益成長的人工智慧系統密度,配電系統將佔歐洲資料中心電力市場的73.35%。在該領域,可在5毫秒內切換商用電源、電池和燃料電池電源的智慧配電盤已成為標準配備。在備用電源領域(佔市場佔有率的26.65%),UPS的普及率仍然強勁,但柴油發電機的市場佔有率正被氫燃料電池堆和符合新零排放法規的大型電池組蠶食。Schneider Electric的鋰離子「Galaxy VL」和Vertiv的Trinium燃料電池UPS正是朝向更清潔、更高密度備用電源轉型的標誌性產品。
設計和諮詢服務是成長最快的細分市場,年複合成長率高達 9.97%,這主要得益於客戶對混合 CPU/GPU 負載量身定做的整合電氣和機械設計的需求。據整合承包商稱,專案訂單已持續到 2027 年,並且正在向以模組化 2-4 MW 模組為中心的標準化轉型,這些模組可在出貨前在工廠進行測試。這項轉型將減少現場勞動力,同時提高品管,鑑於歐洲工程師短缺,這一點至關重要。
到2025年,託管服務在歐洲資料中心電力市場仍將佔47.40%的收入佔有率。這是因為企業更傾向於租賃具備人工智慧功能的空間,而不是投資複雜的電氣設備維修。多租戶設施具有成本效益優勢,因為它可以將合規成本(例如德國PUE低於1.2的規定)分攤到更廣泛的基本客群。邊緣和微型設施雖然成本績效較小,但成長速度最快,複合年成長率達到9.74%,這主要得益於5G、自動駕駛和智慧製造等技術的應用,在這些領域,超過20毫秒的延遲是不可接受的。
超大規模現場建設仍然至關重要。微軟愛爾蘭園區和NTT法蘭克福擴建計畫是與電力公司直接合作的典範,均採用400千伏雙饋送電纜和現場渦輪機。此類投資使營運商能夠避免公共電網擁塞的影響,同時也能試驗結合氫能、電池和飛輪的混合動力系統。隨著託管專家和現場超大規模資料中心業者都採用預製電力核心和先進的監控系統,兩者之間的競爭差距正在縮小。
其他好處:
- Excel格式的市場預測(ME)表
- 三個月的分析師支持
目錄
第1章:引言
- 研究假設和市場定義
- 調查範圍
第2章:調查方法
第3章執行摘要
第4章 市場狀況
- 市場概覽
- 市場促進因素
- 擴大超大規模和超級資料中心的部署
- 雲端運算和OTT流量激增
- 嚴格的PUE標準/能源效率法規
- 大規模可再生能源購電協議(PPA)正在穩定電力成本。
- 在農村地區和區域城市部署邊緣人工智慧微型資料中心
- 適用於受電網限制的配送中心的現場綠色氫燃料電池。
- 市場限制因素
- 電力和冷凍系統維修需要大量的初始資本投資。
- 主要城市電網容量瓶頸
- 持證高壓技術人員短缺
- 檢驗水冷系統中隱性電力消耗的情況
- 價值供應鏈分析
- 監理情勢
- 技術展望
- 波特五力分析
- 地緣政治對華盛頓特區基礎設施的影響
第5章 市場規模與成長預測
- 按類型
- 透過解決方案
- 配電解決方案
- 備用電源解決方案
- 按服務
- 設計與諮詢
- 系統整合
- 支援與維護
- 透過解決方案
- 依資料中心類型
- 託管設施
- 企業/邊緣/微型資料中心
- 超大規模/公司自建設施
- 按最終用戶行業分類
- BFSI
- 資訊科技/通訊
- 政府/國防
- 製造業和工業
- 媒體與娛樂
- 醫療保健和生命科學
- 零售與電子商務
- 按功率容量
- 500千瓦或以下
- 501 kW~1 MW
- 1.1-3 MW
- 超過3兆瓦
- 基於層級的標準
- 一級和二級
- Tier III
- Tier IV
- 按地區
- 德國
- 英國
- 法國
- 荷蘭
- 愛爾蘭
- 西班牙
- 義大利
- 北歐國家(丹麥、瑞典、挪威、芬蘭)
- 波蘭
第6章 競爭情勢
- 市佔率分析
- 公司簡介
- ABB Ltd
- Schneider Electric
- Vertiv Group
- Eaton Corp.(incl. Tripp Lite)
- Legrand SA(Raritan, Starline)
- nVent Electric(Enlogic)
- Siemens AG
- Cummins Inc.
- Caterpillar Inc.
- Generac Power Systems
- Mitsubishi Electric
- Delta Electronics
- Huawei Technologies
- Piller Power Systems
- Kohler Co.
- LayerZero Power Systems
- Socomec Group
- Panduit Corp.
- Riello UPS
- Power Innovations International
- Powin Energy
- Bloom Energy
- AEG Power Solutions
- Rolls-Royce(MTU Onsite Energy)
- APC by Schneider
第7章 市場機會與未來展望
According to Mordor Intelligence, the Europe data center power market size is expected to grow from USD 15.58 billion in 2025 to USD 17.01 billion in 2026 and is forecast to reach USD 28.76 billion by 2032 at 9.14% CAGR over 2026-2032.
This report is Segmented by Solution Type (Power Distribution, Power Backup), Service (Design and Consulting, and More), Data Center Type (Colocation, Hyperscale, and More), End-User Industry (BFSI, IT and Telecom, and More), Power Capacity (greater Than 3 MW and More), Tier Standard (Tier I and II, and More), and Geography (Germany, UK, and More). The Market Forecasts are Provided in Terms of Value (USD).
Europe Data Center Power Market Trends and Insights
Rising adoption of hyperscale and mega data centers
Hyperscale operators are building campuses that resemble small utility districts, routinely contracting for 300-500 MW utility connections and, in some cases, developing on-site combined-cycle plants to assure supply continuity. Microsoft's EUR 4.3 billion Italian expansion and Amazon's multi-gigawatt footprint across Europe demonstrate how direct-to-utility models are displacing traditional colocation leasing. Average rack power density is poised to reach 500-1,000 kW for AI training clusters by 2027, driving a 20-30% uptick in facility-wide power draw because liquid cooling loops add pumping penalties. Siemens Energy reported that 60% of its 14 GW gas turbine backlog in 2024 was earmarked for data centers, underscoring the unprecedented infrastructure scale. Utilities are racing to reinforce transmission corridors, yet localized grid stress persists, prompting regulators in Germany to fast-track critical infrastructure permits while the Netherlands enforces moratoriums in power-scarce municipalities.
Surge in cloud computing and OTT traffic
European data centers drew 45-65 TWh in 2022 and are on track to triple consumption by 2035 as 4K/8K streaming, generative AI, and augmented-reality services proliferate. OTT spikes during marquee sporting events oblige operators to install UPS lines that can instantaneously assume full load without flicker. To curtail latency, hyperscalers are standing up edge nodes across Spain, Italy, and Eastern Europe; each micro facility requires 500 kW-3 MW modular power blocks with precise voltage regulation. EU telecom directives enforce 99.9% uptime for networked media platforms, accelerating the refresh of legacy rotary UPS units with lithium-ion or sodium-ion designs that support rapid discharge cycles.
High upfront CAPEX for power and cooling retrofits
Transitioning legacy halls to 100 kW racks often costs USD 1,000 per kW, as switchboards, busways, and distribution cabling must all be replaced. Inflation lifted European construction inputs by 23% between 2023-2024, and electrical gear alone now represents 25% of build budgets. Transformers and high-speed breakers carry 12-18-month lead times, delaying revenue recognition and straining cash flow for mid-tier providers.
Other drivers and restraints analyzed in the detailed report include:
- Stringent PUE / energy-efficiency mandates
- Utility-scale renewable PPAs stabilizing power costs
- Grid-capacity bottlenecks in Tier-1 metros
For complete list of drivers and restraints, kindly check the Table Of Contents.
Segment Analysis
Power distribution systems generated 73.35% of the Europe data center power market size in 2025 as operators accelerated switchgear and busway upgrades to accommodate AI-class densities. Within this segment, intelligent switchboards that toggle between utility, battery, and fuel-cell sources in <5 milliseconds are now standard. UPS adoption remains strong within the 26.65% backup category, but diesel gensets are losing share to hydrogen stacks and large-format battery banks that fulfill emerging zero-emission mandates. Schneider Electric's lithium-ion Galaxy VL and Vertiv's trinium fuel-cell UPS are emblematic of the pivot toward cleaner, denser backup.
Design and consulting services are the fastest-growing sub-segment, rising at a 9.97% CAGR as clients demand holistic electrical-plus-mechanical designs tuned for mixed CPU/GPU loads. Integration contractors report project backlogs stretching to 2027, encouraging standardization around modular 2-4 MW blocks that can be factory-tested before shipment. This shift reduces on-site labor while enabling better quality control, a vital consideration given Europe's technician shortfall.
Colocation retained 47.40% revenue share of the Europe data center power market in 2025 because enterprises prefer renting AI-ready space versus funding complex electrical overhauls. Multi-tenant facilities amortize compliance costs-such as Germany's PUE <1.2 rule-across broader customer bases, creating a price-performance edge. Edge and micro facilities, although smaller, are scaling fastest at 9.74% CAGR thanks to 5G, autonomous mobility, and smart-manufacturing deployments that cannot tolerate >20-millisecond latency.
Hyperscale self-builds remain pivotal; Microsoft's Irish campus and NTT's Frankfurt expansion exemplify direct utility partnership models that attach dual 400 kV feeds and on-site turbines. These investments insulate operators from congested public grids while enabling experimentation with hydrogen, battery, and flywheel hybrids. The competitive gap between colocation specialists and do-it-yourself hyperscalers is narrowing as both adopt prefabricated power cores and advanced monitoring suites.
Complete Report Scope:
- By Type
- By Solution
- Power Distribution Solutions
- Power Backup Solutions
- By Service
- Design and Consulting
- System Integration
- Support and Maintenance
- By Solution
- By Data Center Type
- Colocation Facilities
- Enterprise / Edge / Micro DC
- Hyperscale / Self-built Facilities
- By End-User Industry
- BFSI
- IT and Telecom
- Government and Defense
- Manufacturing and Industrial
- Media and Entertainment
- Healthcare and Life Sciences
- Retail and E-commerce
- By Power Capacity
- less than equal to 500 kW
- 501 kW - 1 MW
- 1.1 - 3 MW
- greater than 3 MW
- By Tier Standard
- Tier I and II
- Tier III
- Tier IV
- By Geography
- Germany
- United Kingdom
- France
- Netherlands
- Ireland
- Spain
- Italy
- Nordic (Denmark, Sweden, Norway, Finland)
- Poland
List of Companies Covered in this Report:
- ABB Ltd
- Schneider Electric
- Vertiv Group
- Eaton Corp. (incl. Tripp Lite)
- Legrand SA (Raritan, Starline)
- nVent Electric (Enlogic)
- Siemens AG
- Cummins Inc.
- Caterpillar Inc.
- Generac Power Systems
- Mitsubishi Electric
- Delta Electronics
- Huawei Technologies
- Piller Power Systems
- Kohler Co.
- LayerZero Power Systems
- Socomec Group
- Panduit Corp.
- Riello UPS
- Power Innovations International
- Powin Energy
- Bloom Energy
- AEG Power Solutions
- Rolls-Royce (MTU Onsite Energy)
- APC by Schneider
Additional Benefits:
- The market estimate (ME) sheet in Excel format
- 3 months of analyst support
TABLE OF CONTENTS
1 INTRODUCTION
- 1.1 Study Assumptions and Market Definition
- 1.2 Scope of the Study
2 RESEARCH METHODOLOGY
3 EXECUTIVE SUMMARY
4 MARKET LANDSCAPE
- 4.1 Market Overview
- 4.2 Market Drivers
- 4.2.1 Rising adoption of hyperscale and mega data centers
- 4.2.2 Surge in cloud computing and OTT traffic
- 4.2.3 Stringent PUE / energy-efficiency mandates
- 4.2.4 Utility-scale renewable PPAs stabilising power costs
- 4.2.5 Edge-AI micro DC rollout in rural and secondary cities
- 4.2.6 On-prem green-hydrogen fuel cells for grid-constrained DCs
- 4.3 Market Restraints
- 4.3.1 High upfront CAPEX for power and cooling retrofits
- 4.3.2 Grid-capacity bottlenecks in Tier-1 metros
- 4.3.3 Shortage of certified high-voltage technicians
- 4.3.4 Water-based cooling's hidden power-penalty scrutiny
- 4.4 Value / Supply-Chain Analysis
- 4.5 Regulatory Landscape
- 4.6 Technological Outlook
- 4.7 Porter's Five Forces Analysis
- 4.7.1 Bargaining Power of Suppliers
- 4.7.2 Bargaining Power of Buyers
- 4.7.3 Threat of New Entrants
- 4.7.4 Threat of Substitutes
- 4.7.5 Intensity of Competitive Rivalry
- 4.8 Geopolitical Impact on DC Infrastructure
5 MARKET SIZE AND GROWTH FORECASTS (VALUE, USD)
- 5.1 By Type
- 5.1.1 By Solution
- 5.1.1.1 Power Distribution Solutions
- 5.1.1.2 Power Backup Solutions
- 5.1.2 By Service
- 5.1.2.1 Design and Consulting
- 5.1.2.2 System Integration
- 5.1.2.3 Support and Maintenance
- 5.1.1 By Solution
- 5.2 By Data Center Type
- 5.2.1 Colocation Facilities
- 5.2.2 Enterprise / Edge / Micro DC
- 5.2.3 Hyperscale / Self-built Facilities
- 5.3 By End-User Industry
- 5.3.1 BFSI
- 5.3.2 IT and Telecom
- 5.3.3 Government and Defense
- 5.3.4 Manufacturing and Industrial
- 5.3.5 Media and Entertainment
- 5.3.6 Healthcare and Life Sciences
- 5.3.7 Retail and E-commerce
- 5.4 By Power Capacity
- 5.4.1 less than equal to 500 kW
- 5.4.2 501 kW - 1 MW
- 5.4.3 1.1 - 3 MW
- 5.4.4 greater than 3 MW
- 5.5 By Tier Standard
- 5.5.1 Tier I and II
- 5.5.2 Tier III
- 5.5.3 Tier IV
- 5.6 By Geography
- 5.6.1 Germany
- 5.6.2 United Kingdom
- 5.6.3 France
- 5.6.4 Netherlands
- 5.6.5 Ireland
- 5.6.6 Spain
- 5.6.7 Italy
- 5.6.8 Nordic (Denmark, Sweden, Norway, Finland)
- 5.6.9 Poland
6 COMPETITIVE LANDSCAPE
- 6.1 Market Share Analysis
- 6.2 Company Profiles (includes Global level Overview, Market level overview, Core Segments, Financials as available, Strategic Information, Market Rank/Share for key companies, Products and Services, and Recent Developments)
- 6.2.1 ABB Ltd
- 6.2.2 Schneider Electric
- 6.2.3 Vertiv Group
- 6.2.4 Eaton Corp. (incl. Tripp Lite)
- 6.2.5 Legrand SA (Raritan, Starline)
- 6.2.6 nVent Electric (Enlogic)
- 6.2.7 Siemens AG
- 6.2.8 Cummins Inc.
- 6.2.9 Caterpillar Inc.
- 6.2.10 Generac Power Systems
- 6.2.11 Mitsubishi Electric
- 6.2.12 Delta Electronics
- 6.2.13 Huawei Technologies
- 6.2.14 Piller Power Systems
- 6.2.15 Kohler Co.
- 6.2.16 LayerZero Power Systems
- 6.2.17 Socomec Group
- 6.2.18 Panduit Corp.
- 6.2.19 Riello UPS
- 6.2.20 Power Innovations International
- 6.2.21 Powin Energy
- 6.2.22 Bloom Energy
- 6.2.23 AEG Power Solutions
- 6.2.24 Rolls-Royce (MTU Onsite Energy)
- 6.2.25 APC by Schneider
7 MARKET OPPORTUNITIES AND FUTURE OUTLOOK
- 7.1 White-space and Unmet-Need Assessment

 面向人工智慧資料中心的電力柔軟性解決方案的全球市場規模、佔有率和成長預測(2026-2031 年)人工智慧資料中心電力柔軟性系統的市場規模、市場佔有率和成長預測(2026-2032 年)
 資料中心電力、位置和管道智慧—亞太版
 資料中心電力市場成長機會、成長要素、產業趨勢分析及2026-2035年預測
 資料中心電力基礎設施市場預測至 2034 年—按基礎設施組件、資料中心層級、額定功率、電力架構、最終用戶和地區分類的全球分析
 全球資料中心電力市場:機會與策略展望(至2035年)
 資料中心電力:市場佔有率分析、產業趨勢與統計、成長預測(2026-2031 年)全球資料中心電力基礎設施市場規模、佔有率、趨勢和成長分析報告(2026-2034年)
 資料中心電源市場:按組件類型、層級類型、資料中心類型和產業分類-2026-2032年全球市場預測亞太地區資料中心電力市場:市場佔有率分析、產業趨勢與統計及成長預測(2026-2031年)