


 |
市場調查報告書
商品編碼
2121259
美國振動感測器:市場佔有率分析、行業趨勢和統計數據、成長預測(2026-2031 年)US Vibration Sensors - Market Share Analysis, Industry Trends & Statistics, Growth Forecasts (2026 - 2031) |
||||||

※ 本網頁內容可能與最新版本有所差異。詳細情況請與我們聯繫。
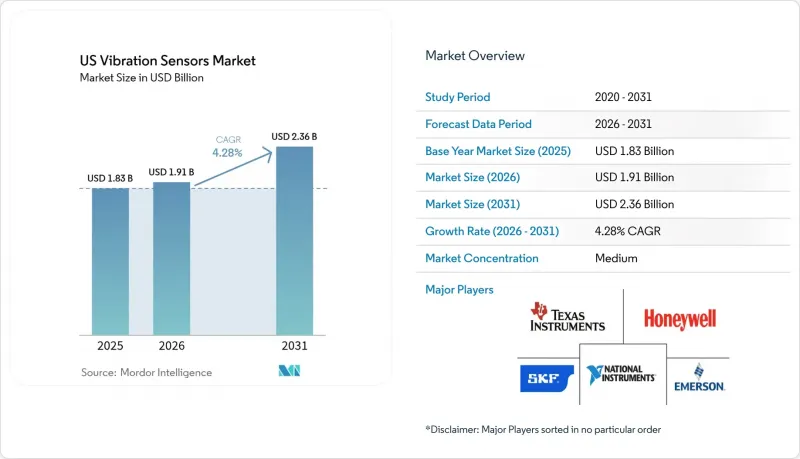
據 Mordor Intelligence 稱,2025 年美國振動感測器市值為 18.3 億美元,預計到 2031 年將達到 23.6 億美元,而 2026 年為 19.1 億美元,預測期(2026-2031 年)的複合年成長率為 4.28%。
本報告按產品類型(加速計、接近感測器、轉速計、速度感測器及其他)、感測器技術(有線、無線)、感測材料/原理(壓電、MEMS、磁致伸縮、光纖)以及終端用戶產業(汽車、航太與國防、石油天然氣、金屬與採礦等)進行分類。市場預測以美元計價。
美國振動感測器市場趨勢與洞察
對預測性維護計劃的需求日益成長
在美國製造業,意外停機造成的損失每年超過500億美元,這促使維護策略從基於時間的維護轉向基於狀態的維護。許多工廠目前正在實施連續振動監測,以便及早發現軸承磨損和不對中,從而將設備壽命延長高達30%,同時減少備件庫存。將機器學習應用於頻譜數據,可以識別出人工分析人員可能遺漏的異常情況,尤其是在存在交互機械的工廠中。風電場營運商利用這些工具預測變速箱故障,避免了相當於400萬至500萬歐元(430萬至540萬美元)的生產損失。初步部署的成功正在加速汽車、金屬和食品加工產業的採用。
支援工業物聯網的無線振動節點正變得越來越受歡迎。
無線監控無需佈線,即可監控以往難以觸及的資產。 LoRaWAN 網路的資料傳輸距離可達 15 公里,展現了其在遠端環境感測方面的卓越效能。能源採集裝置利用環境振動和熱作為能源來源,無需更換電池,從而克服了傳統的成本障礙。貝克休斯公司的 Ranger Pro 感測器已獲准在全球危險區域使用,是石油和天然氣公司尋求企業級狀態監測的理想選擇。部署週期短,方便及時維護,並可快速計算投資報酬率 (ROI)。
與傳統設備整合相關的挑戰
許多設施仍然依賴幾十年前生產的設備,這些設備缺乏標準化的感測器安裝座和通訊連接埠。維修現有設備的成本可能是為新設備安裝感測器的三到五倍。老舊機架的共振會降低訊號保真度,需要客製化固定裝置,從而增加工時。跨越多代的專有協定需要閘道器,這會增加資本支出 (Capex) 並提高網路安全風險。 Analog Devices 的 Voyager4 平台透過自適應安裝座和節點上 AI 解決了這些挑戰,但其價格較高,減緩了其普及速度。
細分市場分析
預計到2025年,加速計貨量將佔總出貨量的44.62%,凸顯了其在頻寬內的多功能性。速度感測器由於能夠及早檢測大型旋轉機械中的低頻故障,其複合年成長率(CAGR)最高,達7.43%。多參數裝置結合了加速度、速度和溫度訊息,簡化了安裝並降低了總體擁有成本(TCO)。 Analog Devices公司正在將邊緣人工智慧整合到這些封裝中,透過在節點上進行故障分類來降低網路頻寬。水力發電廠和紙漿造紙廠對速度感測技術的日益廣泛應用,正在推動美國振動感測器市場的收入多元化。
第二個成長要素在於輪胎和變速箱測試領域的擴張,三軸加速計在該領域用於追蹤複雜的動態負荷。接近式探頭雖然應用範圍較小,但在非接觸式渦輪機應用中仍至關重要。轉速表作為變速驅動裝置量級分析的基準儀器,其價值仍不減。隨著工廠數位化程度的不斷提高,資產健康管理平台正在收集來自各種產品類型的數據並產生服務費用。這提高了硬體利潤率,並加強了美國振動感測器市場供應商與客戶之間的聯繫。
由於其可靠性久經考驗且現有電纜配線架可用,有線數位系統預計在2025年將佔銷售額的60.72%。然而,隨著電池壽命和無線穩定性的提升,無線節點正以每年8.78%的速度成長。 LoRaWAN僅需一個閘道器即可實現公里級通訊範圍,為分散式太陽能發電廠提供支援。在製藥業的無塵室中,由於運作和污染控制至關重要,因此正在採用有線和無線相結合的混合架構。能源採集透過解決維護難題,正在拓展其應用場景,例如迴轉窯,迴轉窯中滑環會增加成本和複雜性。
資料二極體功能和 AES-256 加密技術緩解了以往有線配置中常見的網路安全隱患。韌體空中升級 (FOTA) 允許操作人員在無需物理存取的情況下修復漏洞。基於 ISA100 和 IEC 62938 的標準化促進了不同供應商之間的互通性,並擴展了美國振動感測器市場的生態系統。
其他好處:
- Excel格式的市場預測(ME)表
- 3個月的分析師支持
目錄
第1章:引言
- 研究假設和市場定義
- 調查範圍
第2章:調查方法
第3章執行摘要
第4章 市場狀況
- 市場概覽
- 市場促進因素
- 對預測性維護計劃的需求日益成長
- 與工業物聯網相容的無線振動測量節點正變得越來越普及。
- 低成本的MEMS加速計的應用正在加速。
- 危險產業面臨 OSHA 和 API 合規性壓力
- 邊緣人工智慧分析正在開闢新的價值來源(這一領域尚未得到足夠的媒體關注)。
- 車輛電氣化推動了對高頻振動偵測的需求(這一點尚未得到充分通報)。
- 市場限制因素
- 與傳統設備整合相關的挑戰
- 一級/二級區域本質安全型感測器短缺
- 聯網感測器引發的網路安全風險(報告不足的問題)
- 壓電陶瓷材料供應鏈的變異性(報告不足)
- 價值鏈分析
- 監管情勢和標準
- 技術展望
- 波特五力分析
第5章 市場規模與成長預測
- 依產品類型
- 加速計
- 近距離探針
- 轉速表
- 速度感測器
- 其他
- 感測器技術
- 有線(類比/數位)
- 無線(BLE、LoRa、Wi-Fi)
- 感測材料/原理
- 壓電
- MEMS(電容式/壓阻式)
- 磁致伸縮型
- 光纖
- 按最終用戶行業分類
- 車
- 航太/國防
- 石油和天然氣
- 金屬和採礦
- 發電
- 衛生保健
- 家用電子產品
- 其他終端用戶產業
第6章 競爭情勢
- 市場集中度
- 策略趨勢
- 市佔率分析
- 公司簡介
- Analog Devices Inc.
- Texas Instruments Incorporated
- Honeywell International Inc.
- Emerson Electric Co.
- Rockwell Automation Inc.
- SKF USA Inc.
- PCB Piezotronics(MTS Systems)
- TE Connectivity Ltd.
- Wilcoxon Sensing Technologies(Amphenol)
- Siemens Digital Industries USA
- STMicroelectronics Inc.
- Bosch Sensortec GmbH
- KCF Technologies Inc.
- Banner Engineering Corp.
- Fluke Corporation
- Baker Hughes(Bently Nevada)
- Meggitt PLC(Endevco)
- Omron Corporation
- National Instruments Corp.
- Hansford Sensors Ltd.
第7章 市場機會與未來展望
According to Mordor Intelligence, the United States vibration sensors market size was valued at USD 1.83 billion in 2025 and estimated to grow from USD 1.91 billion in 2026 to reach USD 2.36 billion by 2031, at a CAGR of 4.28% during the forecast period (2026-2031).
This report is Segmented by Product Type (Accelerometers, Proximity Probes, Tachometers, Velocity Sensors, Others), Sensor Technology (Wired, Wireless), Sensing Material/Principle (Piezoelectric, MEMS, Magnetostrictive, Fiber-Optic), End-User Industry (Automotive, Aerospace and Defense, Oil and Gas, Metals and Mining, and More). The Market Forecasts are Provided in Terms of Value (USD).
US Vibration Sensors Market Trends and Insights
Rising Demand for Predictive-Maintenance Programs
Unplanned downtime costs exceed USD 50 billion each year across U.S. manufacturing, prompting a shift from time-based to condition-based maintenance strategies. Many plants now deploy continuous vibration monitoring that detects bearing wear and misalignment early, extending asset life by as much as 30% while cutting spare-parts inventory. Machine learning applied to spectral data identifies anomalies that human analysts can miss, especially in facilities with interacting machines. Wind-farm operators using these tools have avoided lost production valued at EUR 4-5 million (USD 4.3-5.4 million) by predicting gearbox failures. Early adoption success is accelerating broader rollouts across automotive, metals, and food-processing sites.
IIoT-Enabled Wireless Vibration Nodes Gaining Traction
Wireless monitoring eliminates cable routing and allows coverage of assets once considered unreachable. LoRaWAN networks transmit data more than 15 kilometers, proven in remote environmental sensing. Energy-harvesting devices powered by ambient vibration or heat remove battery-change labor, addressing previous cost barriers. Baker Hughes' Ranger Pro sensor, approved for global hazardous areas, provides a template for oil and gas operators pursuing enterprise-wide condition monitoring. Short deployment times fit scheduled maintenance windows, supporting rapid ROI calculations.
Integration Issues with Legacy Machinery
Many facilities rely on equipment built decades ago without standardized sensor mounts or communication ports. Retrofitting can cost three to five times more than installing sensors on new assets. Resonance effects in older frames complicate signal fidelity and demand custom fixtures that add labor hours. Multiple generations of proprietary protocols require gateways that increase capex and cybersecurity exposure. Analog Devices' Voyager4 platform offers adaptive mounting and on-node AI to counter these hurdles, though price sensitivity slows adoption.
Other drivers and restraints analyzed in the detailed report include:
- Accelerating Adoption of MEMS-Based Low-Cost Accelerometers
- OSHA and API Compliance Pressures in Hazardous Industries
- Shortage of Intrinsically Safe Sensors for Class I/Div II Zones
For complete list of drivers and restraints, kindly check the Table Of Contents.
Segment Analysis
Accelerometers represented 44.62% of 2025 shipments, underlining their versatility across frequency ranges. Velocity sensors post the highest 7.43% CAGR as they capture low-frequency faults earlier in large rotating equipment. Multi-parameter devices combine acceleration, velocity, and temperature to simplify installation and reduce total cost of ownership. Analog Devices integrates edge AI in such packages, allowing on-node fault classification that trims network bandwidth. Growing use of velocity sensing in hydropower and pulp-and-paper plants supports revenue diversity within the United States vibration sensors market.
The second growth driver lies in expanding tire and gearbox testing where triaxial accelerometers track compound dynamic loads. Proximity probes, though niche, remain indispensable in non-contact turbine applications. Tachometers retain value as reference instruments for order analysis in variable-speed drives. As plants digitize, asset-health platforms ingest data from all product types, creating service fees that augment hardware margins and strengthen supplier-customer ties within the United States vibration sensors market.
Wired digital systems delivered 60.72% of 2025 revenue thanks to proven reliability and existing cable trays. However, wireless nodes grow 8.78% annually as battery life and radio resilience improve. LoRaWAN achieves kilometer-scale reach on single gateways, supporting distributed solar farms. Hybrid power-plus-wireless architectures appear in pharmaceutical cleanrooms where uptime and contamination control are paramount. Energy harvesting addresses maintenance pain points and expands use cases such as rotating kilns where slip rings add cost and complexity.
Data-diode features and AES-256 encryption mitigate cybersecurity concerns that once favored wired setups. Firmware-over-air updates let operators patch vulnerabilities without physical access. Standardization under ISA100 and IEC 62938 promotes interoperability across vendors, broadening the ecosystem for the United States vibration sensors market.
Complete Report Scope:
- By Product Type
- Accelerometers
- Proximity Probes
- Tachometers
- Velocity Sensors
- Others
- By Sensor Technology
- Wired (Analog/Digital)
- Wireless (BLE, LoRa, Wi-Fi)
- By Sensing Material / Principle
- Piezoelectric
- MEMS (Capacitive/Piezoresistive)
- Magnetostrictive
- Fiber-Optic
- By End-user Industry
- Automotive
- Aerospace and Defense
- Oil and Gas
- Metals and Mining
- Power Generation
- Healthcare
- Consumer Electronics
- Other End-user Industries
List of Companies Covered in this Report:
- Analog Devices Inc.
- Texas Instruments Incorporated
- Honeywell International Inc.
- Emerson Electric Co.
- Rockwell Automation Inc.
- SKF USA Inc.
- PCB Piezotronics (MTS Systems)
- TE Connectivity Ltd.
- Wilcoxon Sensing Technologies (Amphenol)
- Siemens Digital Industries USA
- STMicroelectronics Inc.
- Bosch Sensortec GmbH
- KCF Technologies Inc.
- Banner Engineering Corp.
- Fluke Corporation
- Baker Hughes (Bently Nevada)
- Meggitt PLC (Endevco)
- Omron Corporation
- National Instruments Corp.
- Hansford Sensors Ltd.
Additional Benefits:
- The market estimate (ME) sheet in Excel format
- 3 months of analyst support
TABLE OF CONTENTS
1 INTRODUCTION
- 1.1 Study Assumptions and Market Definition
- 1.2 Scope of the Study
2 RESEARCH METHODOLOGY
3 EXECUTIVE SUMMARY
4 MARKET LANDSCAPE
- 4.1 Market Overview
- 4.2 Market Drivers
- 4.2.1 Rising demand for predictive-maintenance programs
- 4.2.2 IIoT-enabled wireless vibration nodes gaining traction
- 4.2.3 Accelerating adoption of MEMS-based low-cost accelerometers
- 4.2.4 OSHA and API compliance pressures in hazardous industries
- 4.2.5 Edge-AI analytics unlocking new value pools (under-reported)
- 4.2.6 Vehicle electrification driving high-frequency vibration sensing (under-reported)
- 4.3 Market Restraints
- 4.3.1 Integration issues with legacy machinery
- 4.3.2 Shortage of intrinsically safe sensors for Class I/Div II zones
- 4.3.3 Cyber-security risks from connected sensors (under-reported)
- 4.3.4 Supply-chain volatility in piezo-ceramic materials (under-reported)
- 4.4 Value Chain Analysis
- 4.5 Regulatory Landscape and Standards
- 4.6 Technological Outlook
- 4.7 Porter's Five Forces Analysis
- 4.7.1 Threat of New Entrants
- 4.7.2 Threat of Substitutes
- 4.7.3 Bargaining Power of Suppliers
- 4.7.4 Bargaining Power of Buyers
- 4.7.5 Intensity of Competitive Rivalry
5 MARKET SIZE AND GROWTH FORECASTS (VALUES)
- 5.1 By Product Type
- 5.1.1 Accelerometers
- 5.1.2 Proximity Probes
- 5.1.3 Tachometers
- 5.1.4 Velocity Sensors
- 5.1.5 Others
- 5.2 By Sensor Technology
- 5.2.1 Wired (Analog/Digital)
- 5.2.2 Wireless (BLE, LoRa, Wi-Fi)
- 5.3 By Sensing Material / Principle
- 5.3.1 Piezoelectric
- 5.3.2 MEMS (Capacitive/Piezoresistive)
- 5.3.3 Magnetostrictive
- 5.3.4 Fiber-Optic
- 5.4 By End-user Industry
- 5.4.1 Automotive
- 5.4.2 Aerospace and Defense
- 5.4.3 Oil and Gas
- 5.4.4 Metals and Mining
- 5.4.5 Power Generation
- 5.4.6 Healthcare
- 5.4.7 Consumer Electronics
- 5.4.8 Other End-user Industries
6 COMPETITIVE LANDSCAPE
- 6.1 Market Concentration
- 6.2 Strategic Moves
- 6.3 Market Share Analysis
- 6.4 Company Profiles (includes Global level Overview, Market level overview, Core Segments, Financials as available, Strategic Information, Market Rank/Share, Products and Services, Recent Developments)
- 6.4.1 Analog Devices Inc.
- 6.4.2 Texas Instruments Incorporated
- 6.4.3 Honeywell International Inc.
- 6.4.4 Emerson Electric Co.
- 6.4.5 Rockwell Automation Inc.
- 6.4.6 SKF USA Inc.
- 6.4.7 PCB Piezotronics (MTS Systems)
- 6.4.8 TE Connectivity Ltd.
- 6.4.9 Wilcoxon Sensing Technologies (Amphenol)
- 6.4.10 Siemens Digital Industries USA
- 6.4.11 STMicroelectronics Inc.
- 6.4.12 Bosch Sensortec GmbH
- 6.4.13 KCF Technologies Inc.
- 6.4.14 Banner Engineering Corp.
- 6.4.15 Fluke Corporation
- 6.4.16 Baker Hughes (Bently Nevada)
- 6.4.17 Meggitt PLC (Endevco)
- 6.4.18 Omron Corporation
- 6.4.19 National Instruments Corp.
- 6.4.20 Hansford Sensors Ltd.
7 MARKET OPPORTUNITIES and FUTURE OUTLOOK
- 7.1 White-space and Unmet-Need Assessment

 振動感測器:市場佔有率分析、產業趨勢與統計、成長預測(2026-2031)
 高溫振動感測器市場規模:按輸出類型、應用、地區和預測分類。
 振動感測器市場:2026-2032年全球市場預測(按感測器類型、檢測技術、頻段、安裝類型、輸出類型、軸配置、應用和最終用途行業分類)
 振動感測器市場報告:按產品、技術、材料、終端應用產業和地區分類(2026-2034 年)全球振動感測器市場規模、佔有率、趨勢和成長分析報告(2026-2034年)
 2026年全球振動感測器市場報告超音波振動感測器市場按技術、產品類型、頻率範圍、應用、最終用戶和銷售管道,全球預測(2026-2032年)
 2032 年振動感測器市場預測:按類型、監測流程、設備、材料、網路、技術、最終用戶和地區進行的全球分析2032 年無線振動感測器市場預測:按感測器類型、應用和地區進行的全球分析
 振動感測器市場規模、佔有率和成長分析(按類型、監測過程、訊號、設備、技術、材料、垂直產業和地區)- 2025-2032 年產業預測