


 |
市場調查報告書
商品編碼
2120845
全像顯示器:市場佔有率分析、產業趨勢與統計、成長預測(2026-2031)Holographic Display - Market Share Analysis, Industry Trends & Statistics, Growth Forecasts (2026 - 2031) |
||||||

※ 本網頁內容可能與最新版本有所差異。詳細情況請與我們聯繫。
根據 Mordor Intelligence 估計,全像顯示市場在 2026 年的價值將達到 51.4 億美元,高於 2025 年的 43.6 億美元,預計到 2031 年將達到 116.6 億美元。
預計 2026 年至 2031 年的複合年成長率為 17.82%。
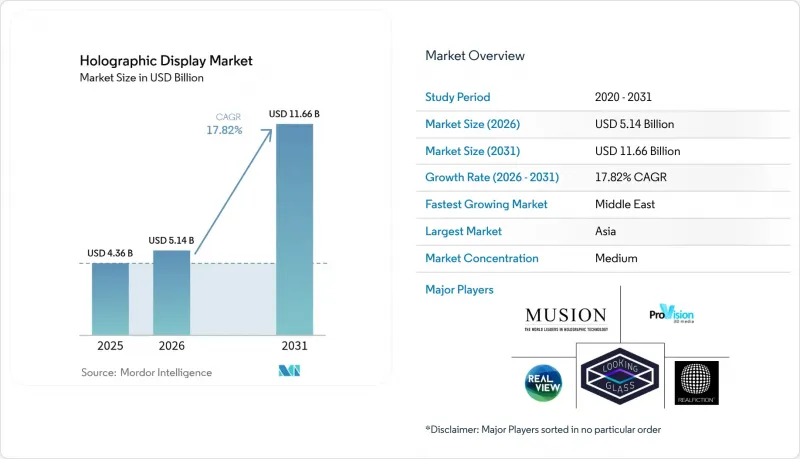
本報告按組件(硬體、軟體、服務)、技術(電子全像、觸控/空中觸覺等)、產品類型(數位電子看板和自助服務終端、智慧電視和顯示器等)、最終用戶(家用電子電器、零售和展覽等)以及地區進行細分。市場預測以價值(美元)表示。
全球全像顯示市場趨勢與洞察
汽車製造商採用擴增實境(AR)全像顯示器。
德國豪華汽車製造商和中國電動車品牌正在採用覆蓋整個擋風玻璃的全像抬頭顯示器(HUD),以凸顯其高階車型並提升駕駛員的情境察覺。現代摩比斯在2025年國際消費電子展(CES)上發布的一款概念車型,可將導航資訊、警告和娛樂內容投射到三個顯示區域,該車型由現代摩比斯與蔡司合作開發,計劃於2027年量產。市場預測,2030年,汽車出貨量將達到700萬台,屆時儀錶板空間將轉變為身臨其境型實境介面。
美國一級醫院實施3D立體手術規劃系統
醫院在腫瘤科、心臟科和整形外科領域正擴大採用真深度全像技術。 RealView Imaging公司的「HOLOSCOPE-i」系統使外科醫生能夠即時操控3D解剖結構,從而縮短手術計劃時間並最大限度地減少手術室中的誤差。臨床研究表明,與2D方法相比,61%的患者支持全像規劃,尤其是在非共面放射治療方面。
供不應求。
只有少數幾家製造廠能夠達到高效波導所需的奈米級精度,這使得其價格比LCD和OLED替代品高出40%至60%。SONY的0.44吋全高清OLED微型顯示器售價超過260美元(4萬日圓),限制了消費性電子產品的獲利能力。
細分市場分析
預計到2025年,硬體將佔全像顯示市場銷售額的74.85%,凸顯了構成全像顯示市場基礎的空間燈光調變器、雷射引擎和精密光學元件的資本密集特性。雖然投影機、光波導和微型顯示引擎仍然是成本因素,但預計到本十年末,組件價格的下降將略微降低硬體在全像顯示市場規模中的佔有率。服務業目前已錄得最高的複合年成長率(CAGR),達到22.32%,因為企業需要承包部署、校準和生命週期支援合約。整合專家正在將本地安裝、雲端渲染和培訓打包在一起,將一次性設備銷售轉變為多年合約。在醫療保健網路中,確保手術規劃室運作的服務等級協定(SLA)是強制性的,汽車製造商正在將光學系統的調校外包給一級供應商。因此,全像顯示市場正在從依賴硬體利潤率轉向依賴輔助服務的經常性收入。
同時,軟體堆疊正透過即時渲染、人工智慧驅動的內容創作和分析功能得到增強,從而在實體設備之上建立起訂閱收入層級。這一趨勢讓人想起投影和數指示牌產業過去的轉型,當時內容管理平台變得至關重要。隨著大量串流媒體的普及,頻寬最佳化和安全修補程式將進一步拓展服務領域的商業機會。硬體供應商現在要么建立內部專業服務部門,要么與系統整合商合作,以確保光學元件、韌體和管理內容之間的緊密協調。這種做法強化了全像顯示產業的生態系統鎖定。
到2025年,得益於液晶矽(LCOS)和反射式空間燈光調變器(SLM)供應鏈的成熟,預計電致全像架構將佔全像顯示器市場40.25%的佔有率。穩定的良率和成熟的設計工具集使這種格式成為汽車抬頭顯示器(HUD)和醫療掃描儀的理想選擇,並繼續保持其在全像顯示市場的主導地位。同時,觸覺空中系統預計將實現24.05%的複合年成長率,因為開發人員已將相位陣列超音波與體積視覺技術相結合,使用戶能夠「觸摸」懸浮介面。支援手勢啟動產品旋轉的零售展示台和支援無菌操作的醫院顯示器都是商業性應用的典型例子。
雷射/等離子投影解決方案主要針對戶外舞台表演和陽光照射下的儀錶板等極亮環境,而半透明波導則應用於擴增實境智慧眼鏡。浦項科技(POSTECH)發布的超表面光學技術有助於校正色差、簡化色彩管理並實現更輕薄的設備。聲學和光子捕獲技術的研究有望重新定義效率,但其商業化預計將超出目前的預測期。整體而言,在全像顯示市場,現有的電子全像供應商必須在功耗、解析度和互動方面進行創新,才能跟上快速成長的觸覺技術競爭對手的步伐。
區域分析
亞太地區憑藉著中國電動車的蓬勃發展、日本娛樂科技的進步以及韓國半導體生態系統的優勢,預計到2025年將佔全球銷售額的36.55%。公私合營合作模式正為微型LED背板和超表面光學元件的發展提供獎勵,進一步鞏固了該地區的供應優勢。亞太地區全像顯示市場的規模也得益於東京、首爾和上海等城市零售店的集中應用。歐洲緊隨其後,這得益於其在汽車行業的成功經驗,儘管亮度法規正在減緩其成長速度。然而,蔡司與現代汽車等公司的合作仍在推動創新的持續發展。
在北美,全像投影技術正穩定成長,這主要得益於美國一級醫院升級手術視覺化系統以及國防機構採購立體任務規劃台。加拿大實況活動組織者正透過試點全像投影節來拓展市場。中東地區預計到2031年將以21.18%的複合年成長率成長,成為該領域成長最快的市場。杜拜、利雅德和杜哈的豪華購物中心正大力投資360度全像展示,以增強品牌故事的敘述。阿布達比和新未來城(Neom)等政府主導的智慧城市計畫也推動了相關技術的進一步發展。
儘管由於進口關稅和頻寬限制,拉丁美洲和非洲仍處於起步階段,但聖保羅零售業和南非採礦業的可視化技術先導計畫表明,下游市場正在向外擴張。然而,由於關鍵波導的生產需要經過日本和韓國,所有地區都可能受到全球供應鏈瓶頸的影響。全像顯示市場的相關人員正在密切關注這一因素,以尋求降低風險的措施。
其他好處:
- Excel格式的市場預測(ME)表
- 3個月的分析師支持
目錄
第1章:引言
- 研究假設和市場定義
- 調查範圍
第2章:調查方法
第3章執行摘要
第4章 市場狀況
- 市場概覽
- 市場促進因素
- 德國和中國豪華車市場汽車製造商採用擴增實境(AR)全像顯示器
- 在美國,體積式 3D 手術規劃系統的應用正在迅速增加,尤其是在各大醫院。
- 中東一家購物中心的奢侈品牌連鎖店正在轉型採用 360°全像指示牌來吸引顧客。
- 實況活動和串流媒體平台正在透過全像演唱會實現盈利,尤其是在日本和韓國。
- 各國(美國、以色列)的軍事計畫正在加速採購全像沙盤。
- 人工智慧生成內容引擎正在降低全球 3D 全像圖的製作成本。
- 市場限制因素
- 供不應求。
- 歐盟關於限制雷射和等離子投影輸出功率的眼部安全和光生物學法規
- 高處理能力和高功耗阻礙了行動裝置的廣泛普及。
- 碎片化的 3D 內容創作工具鏈正在減緩生態系統的發展。
- 產業生態系分析
- 技術展望
- 波特五力分析
第5章 市場規模與成長預測
- 按組件
- 硬體
- 空間燈光調變器(SLM)
- 投影機和雷射引擎
- 光學/鏡頭模組
- 感應器和攝影機
- 其他
- 軟體
- 服務
- 整合與諮詢
- 支援與維護
- 硬體
- 透過技術
- 電全像圖
- 支援觸控/空中觸覺
- 雷射/等離子體
- 半透明
- 其他新興技術(聲學、光子陷阱)
- 依產品類型
- 數位電子看板和自助服務終端
- 智慧電視和顯示器
- 相機和智慧眼鏡
- 醫用掃描儀和顯微鏡
- 抬頭顯示器和擋風玻璃顯示器
- 智慧型手機和平板電腦
- 其他
- 最終用戶
- 家用電子產品
- 零售和貿易展覽
- 媒體、娛樂、實況活動
- 醫療保健和醫學教育
- 汽車和運輸業
- 軍事、國防、航太
- 工業和製造業
- 教育和培訓
- 按地區
- 北美洲
- 美國
- 加拿大
- 墨西哥
- 歐洲
- 德國
- 英國
- 法國
- 北歐的
- 其他歐洲國家
- 南美洲
- 巴西
- 其他南美國家
- 亞太地區
- 中國
- 日本
- 印度
- 東南亞
- 其他亞太國家
- 中東和非洲
- 中東
- 波灣合作理事會(GCC)成員國
- 土耳其
- 其他中東國家
- 非洲
- 南非
- 其他非洲國家
- 中東
- 北美洲
第6章 競爭情勢
- 市場集中度
- 策略趨勢
- 市佔率分析
- 公司簡介
- HYPERVSN(Kino-mo)
- Looking Glass Factory Inc.
- RealFiction Holding AB
- Holoxica Ltd
- RealView Imaging Ltd
- Samsung Electronics Co. Ltd.
- Sony Corporation
- Konica Minolta Inc.
- Qualcomm Technologies Inc.
- Leia Inc.
- Voxon Photonics
- IKIN Inc.
- Zebra Imaging Inc.
- Burton Inc.
- Light Field Lab, Inc.
- SeeReal Technologies GmbH
- Creal SA
- Jade Bird Display Inc.
- Holitech Technology Co., Ltd.
- Shenzhen SMX Display Technology Co., Ltd.
- MDH Hologram Ltd
- Provision Holding Inc
第7章 市場機會與未來展望
According to Mordor Intelligence, holographic display market size in 2026 is estimated at USD 5.14 billion, growing from 2025 value of USD 4.36 billion with 2031 projections showing USD 11.66 billion, growing at 17.82% CAGR over 2026-2031.
This report is Segmented by Component (Hardware, Software, Services), Technology (Electro-Holographic, Touchable/Mid-Air Haptic, and More), Product Type (Digital Signage and Kiosks, Smart TVs and Monitors, and More), End-User (Consumer Electronics, Retail and Exhibition, and More), and Geography. The Market Forecasts are Provided in Terms of Value (USD).
Global Holographic Display Market Trends and Insights
Automotive OEM adoption of augmented-reality holographic HUDs
German luxury marques and Chinese electric-vehicle brands are integrating full-windshield holographic head-up displays to differentiate premium trims and enhance driver situational awareness. Hyundai Mobis' concept shown at CES 2025 projects navigation cues, alerts, and entertainment content across three viewing zones, and joint development with Zeiss targets mass production by 2027. Market forecasts suggest 7 million automotive units will ship by 2030, converting dashboard real estate into immersive AR canvases.
Deployment of volumetric 3D surgical-planning suites in U.S. tier-1 hospitals
Hospitals are turning to true-depth holograms for oncology, cardiology, and orthopedics. RealView Imaging's HOLOSCOPE-i enables surgeons to manipulate 3D anatomy in real time, trimming planning hours and reducing operating-room errors. Clinical studies show 61% preference for holographic plans over 2D methods, especially for non-coplanar radiotherapy beams.
Scarcity of mass-production micro-LED waveguides elevating BOM costs
Few fabs can achieve the nanoscale tolerances required for efficient waveguides, keeping prices 40-60% above LCD or OLED alternatives. Sample quotes for Sony's 0.44-type Full HD OLED microdisplay exceed USD 260 (JPY 40,000), restricting consumer-device economics.
Other drivers and restraints analyzed in the detailed report include:
- Luxury retail chains in Middle-East malls pivoting to 360° holographic signage
- Live-event and streaming platforms monetizing hologram concerts
- Eye-safety and photobiological regulations limiting projection power
For complete list of drivers and restraints, kindly check the Table Of Contents.
Segment Analysis
Hardware accounted for 74.85% of 2025 revenue, underscoring the capital intensity of spatial-light modulators, laser engines, and precision optics that underpin the holographic display market. Projectors, optical waveguides, and microdisplay engines remain cost drivers, yet falling component prices will push the hardware share of the holographic display market size down modestly by the decade's close. Services already command the fastest 22.32% CAGR as enterprises look for turnkey deployment, calibration, and lifecycle support agreements. Integration specialists bundle on-premises installation, cloud rendering, and training, converting one-off device sales into multi-year contracts. Healthcare networks specify service-level agreements that guarantee uptime for surgical planning suites, while automakers outsource optical system alignment to tier-1 suppliers. The holographic display market is therefore shifting from hardware margin dependency to attached-service annuities.
In parallel, software stacks add real-time rendering, AI-assisted content creation, and analytics, layering subscription revenue atop physical equipment. The trend mimics earlier transitions in the projection and signage industries, where content-management platforms became indispensable. As volumetric streaming proliferates, bandwidth optimization and security patches will further enlarge the services opportunity. Hardware vendors now incubate internal professional-services groups or ally with systems integrators, ensuring tight coupling between optics, firmware, and managed content-an approach that strengthens ecosystem lock-in across the holographic display industry.
Electro-holographic architectures captured 40.25% revenue in 2025 thanks to mature liquid-crystal-on-silicon and reflective spatial-light-modulator supply chains. Stable yields and established design toolsets make the format the safe choice for automotive HUDs and medical scanners, sustaining its lead in the holographic display market. Meanwhile, haptic mid-air systems clock a 24.05% CAGR as developers combine phased-array ultrasounds with volumetric visuals to let users "touch" floating interfaces. Retail podiums that permit gesture-based product rotation and hospital displays allowing sterile interaction exemplify commercial traction.
Laser/plasma projection solutions target extreme-brightness scenarios such as open-air stage shows and dashboard sunlit conditions, while semi-transparent waveguides serve AR smart-glasses. Metasurface optics unveiled by POSTECH help correct chromatic aberration, simplifying color management and slimming device profiles. Acoustic and photon-trap research lines could redefine efficiency, yet commercialization sits beyond the current forecast horizon. Overall, incumbent electro-holographic vendors must innovate on power, resolution, and interaction to fend off fast-rising haptic challengers in the holographic display market.
Complete Report Scope:
- By Component
- Hardware
- Spatial Light Modulators (SLM)
- Projectors and Laser Engines
- Optical/Lens Modules
- Sensors and Cameras
- Others
- Software
- Services
- Integration and Consulting
- Support and Maintenance
- Hardware
- By Technology
- Electro-Holographic
- Touchable/Mid-Air Haptic
- Laser/Plasma
- Semi-Transparent
- Other Emerging (Acoustic, Photon-Trap)
- By Product Type
- Digital Signage and Kiosks
- Smart TVs and Monitors
- Cameras and Smart Glasses
- Medical Scanners and Microscopes
- HUDs and Windshield Displays
- Smartphones and Tablets
- Others
- By End-User
- Consumer Electronics
- Retail and Exhibition
- Media, Entertainment and Live Events
- Healthcare and Medical Education
- Automotive and Transportation
- Military, Defense and Aerospace
- Industrial and Manufacturing
- Education and Training
- By Geography
- North America
- United States
- Canada
- Mexico
- Europe
- Germany
- United Kingdom
- France
- Nordics
- Rest of Europe
- South America
- Brazil
- Rest of South America
- Asia-Pacific
- China
- Japan
- India
- South-East Asia
- Rest of Asia-Pacific
- Middle East and Africa
- Middle East
- Gulf Cooperation Council Countries
- Turkey
- Rest of Middle East
- Africa
- South Africa
- Rest of Africa
- Middle East
- North America
Geography Analysis
Asia Pacific generated 36.55% of 2025 revenue, leveraging China's electric-vehicle boom, Japan's entertainment tech, and South Korea's semiconductor ecosystem. Public-private programs funnel incentives into micro-LED backplanes and metasurface optics, fortifying regional supply dominance. The holographic display market size attributed to Asia Pacific also benefits from dense retail deployments in Tokyo, Seoul, and Shanghai. Europe follows with automotive design wins but faces brightness restrictions that temper growth, although collaborations such as Zeiss-Hyundai sustain innovation pipelines.
North America exhibits steady momentum anchored by U.S. tier-1 hospitals that upgrade surgical visualization suites and defense agencies procuring volumetric mission-planning tables. Canada's live-event promoters experiment with hologram festivals, extending market reach. The Middle East posts the highest 21.18% CAGR through 2031 as luxury malls in Dubai, Riyadh, and Doha invest heavily in 360-degree holographic showcases that elevate brand storytelling. Government smart-city initiatives in Abu Dhabi and Neom foster further experimentation.
Latin America and Africa remain early-stage, constrained by import duties and bandwidth limitations, yet pilot projects in Sao Paulo retail and South African mining visualization hint at downstream expansion. Global supply chains nonetheless route critical waveguide fabrication through Japan and South Korea, exposing all regions to potential bottlenecks, a factor that stakeholders across the holographic display market monitor closely for risk mitigation.
- HYPERVSN (Kino-mo)
- Looking Glass Factory Inc.
- RealFiction Holding AB
- Holoxica Ltd
- RealView Imaging Ltd
- Samsung Electronics Co. Ltd.
- Sony Corporation
- Konica Minolta Inc.
- Qualcomm Technologies Inc.
- Leia Inc.
- Voxon Photonics
- IKIN Inc.
- Zebra Imaging Inc.
- Burton Inc.
- Light Field Lab, Inc.
- SeeReal Technologies GmbH
- Creal SA
- Jade Bird Display Inc.
- Holitech Technology Co., Ltd.
- Shenzhen SMX Display Technology Co., Ltd.
- MDH Hologram Ltd
- Provision Holding Inc
Additional Benefits:
- The market estimate (ME) sheet in Excel format
- 3 months of analyst support
TABLE OF CONTENTS
1 INTRODUCTION
- 1.1 Study Assumptions and Market Definition
- 1.2 Scope of the Study
2 RESEARCH METHODOLOGY
3 EXECUTIVE SUMMARY
4 MARKET LANDSCAPE
- 4.1 Market Overview
- 4.2 Market Drivers
- 4.2.1 Automotive OEM Adoption of Augmented-Reality Holographic HUDs in German and Chinese Premium Segments
- 4.2.2 Surging Deployment of Volumetric 3D Surgical Planning Suites in United States Tier-1 Hospitals
- 4.2.3 Retail Luxury Chains in Middle-East Malls Pivoting to 360° Holographic Signage for Foot-Fall Generation
- 4.2.4 Live-Events and Streaming Platforms Monetising Hologram Concerts, Especially in Japan and South Korea
- 4.2.5 Defense Forces' Battlefield Visualization Programs (U.S., Israel) Accelerating Procurement of Holographic Sand-Tables
- 4.2.6 AI-Generated Content Engines Lowering Production Costs for 3D Holograms Globally
- 4.3 Market Restraints
- 4.3.1 Scarcity of Mass-Production Micro-LED Waveguides Elevating BOM Costs
- 4.3.2 Eye-Safety and Photobiological Regulations Limiting Laser/Plasma Projection Power in EU
- 4.3.3 High Compute and Power Foot-print Hindering Mobile Form-Factors
- 4.3.4 Fragmented 3D Content-Creation Toolchain Slowing Ecosystem Scale-up
- 4.4 Industry Ecosystem Analysis
- 4.5 Technological Outlook
- 4.6 Porter's Five Forces Analysis
- 4.6.1 Bargaining Power of Suppliers
- 4.6.2 Bargaining Power of Buyers
- 4.6.3 Threat of New Entrants
- 4.6.4 Threat of Substitutes
- 4.6.5 Intensity of Competitive Rivalry
5 MARKET SIZE AND GROWTH FORECASTS (VALUES)
- 5.1 By Component
- 5.1.1 Hardware
- 5.1.1.1 Spatial Light Modulators (SLM)
- 5.1.1.2 Projectors and Laser Engines
- 5.1.1.3 Optical/Lens Modules
- 5.1.1.4 Sensors and Cameras
- 5.1.1.5 Others
- 5.1.2 Software
- 5.1.3 Services
- 5.1.3.1 Integration and Consulting
- 5.1.3.2 Support and Maintenance
- 5.1.1 Hardware
- 5.2 By Technology
- 5.2.1 Electro-Holographic
- 5.2.2 Touchable/Mid-Air Haptic
- 5.2.3 Laser/Plasma
- 5.2.4 Semi-Transparent
- 5.2.5 Other Emerging (Acoustic, Photon-Trap)
- 5.3 By Product Type
- 5.3.1 Digital Signage and Kiosks
- 5.3.2 Smart TVs and Monitors
- 5.3.3 Cameras and Smart Glasses
- 5.3.4 Medical Scanners and Microscopes
- 5.3.5 HUDs and Windshield Displays
- 5.3.6 Smartphones and Tablets
- 5.3.7 Others
- 5.4 By End-User
- 5.4.1 Consumer Electronics
- 5.4.2 Retail and Exhibition
- 5.4.3 Media, Entertainment and Live Events
- 5.4.4 Healthcare and Medical Education
- 5.4.5 Automotive and Transportation
- 5.4.6 Military, Defense and Aerospace
- 5.4.7 Industrial and Manufacturing
- 5.4.8 Education and Training
- 5.5 By Geography
- 5.5.1 North America
- 5.5.1.1 United States
- 5.5.1.2 Canada
- 5.5.1.3 Mexico
- 5.5.2 Europe
- 5.5.2.1 Germany
- 5.5.2.2 United Kingdom
- 5.5.2.3 France
- 5.5.2.4 Nordics
- 5.5.2.5 Rest of Europe
- 5.5.3 South America
- 5.5.3.1 Brazil
- 5.5.3.2 Rest of South America
- 5.5.4 Asia-Pacific
- 5.5.4.1 China
- 5.5.4.2 Japan
- 5.5.4.3 India
- 5.5.4.4 South-East Asia
- 5.5.4.5 Rest of Asia-Pacific
- 5.5.5 Middle East and Africa
- 5.5.5.1 Middle East
- 5.5.5.1.1 Gulf Cooperation Council Countries
- 5.5.5.1.2 Turkey
- 5.5.5.1.3 Rest of Middle East
- 5.5.5.2 Africa
- 5.5.5.2.1 South Africa
- 5.5.5.2.2 Rest of Africa
- 5.5.5.1 Middle East
- 5.5.1 North America
6 COMPETITIVE LANDSCAPE
- 6.1 Market Concentration
- 6.2 Strategic Moves
- 6.3 Market Share Analysis
- 6.4 Company Profiles {(includes Global level Overview, Market level Overview, Core Segments, Financials as available, Strategic Information, Market Rank/Share for key companies, Products and Services, and Recent Developments)}
- 6.4.1 HYPERVSN (Kino-mo)
- 6.4.2 Looking Glass Factory Inc.
- 6.4.3 RealFiction Holding AB
- 6.4.4 Holoxica Ltd
- 6.4.5 RealView Imaging Ltd
- 6.4.6 Samsung Electronics Co. Ltd.
- 6.4.7 Sony Corporation
- 6.4.8 Konica Minolta Inc.
- 6.4.9 Qualcomm Technologies Inc.
- 6.4.10 Leia Inc.
- 6.4.11 Voxon Photonics
- 6.4.12 IKIN Inc.
- 6.4.13 Zebra Imaging Inc.
- 6.4.14 Burton Inc.
- 6.4.15 Light Field Lab, Inc.
- 6.4.16 SeeReal Technologies GmbH
- 6.4.17 Creal SA
- 6.4.18 Jade Bird Display Inc.
- 6.4.19 Holitech Technology Co., Ltd.
- 6.4.20 Shenzhen SMX Display Technology Co., Ltd.
- 6.4.21 MDH Hologram Ltd
- 6.4.22 Provision Holding Inc
7 MARKET OPPORTUNITIES AND FUTURE OUTLOOK
- 7.1 White-Space and Unmet-Need Assessment

 3D全像透明櫃市場:全球市場預測,2026-2032年全像LED顯示器市場:全球市場預測,2026-2032年
 醫療全像顯示器:市場佔有率分析、產業趨勢與統計及成長預測(2026-2031)全像顯示器市場:按顯示類型、影像尺寸、技術和應用分類的全球市場預測 – 2026-2032 年
 全像顯示器市場報告:按組件、技術、規模、應用、最終用戶和地區分類(2026-2034 年)
 全像顯示市場機會、成長要素、產業趨勢分析及2026-2035年預測
 2026年全球觸控全像顯示器市場報告2026年全球3D全像市場報告
 全像顯示市場:按技術和地區分類汽車全像顯示器市場:按組件、尺寸、解析度類型、技術類型、顯示器尺寸、應用、車輛類型、銷售管道類型分類,全球預測,2026-2032年