


 |
市場調查報告書
商品編碼
2113261
醫療全像顯示器:市場佔有率分析、產業趨勢與統計及成長預測(2026-2031)Medical Holographic Display - Market Share Analysis, Industry Trends & Statistics, Growth Forecasts (2026 - 2031) |
||||||

※ 本網頁內容可能與最新版本有所差異。詳細情況請與我們聯繫。
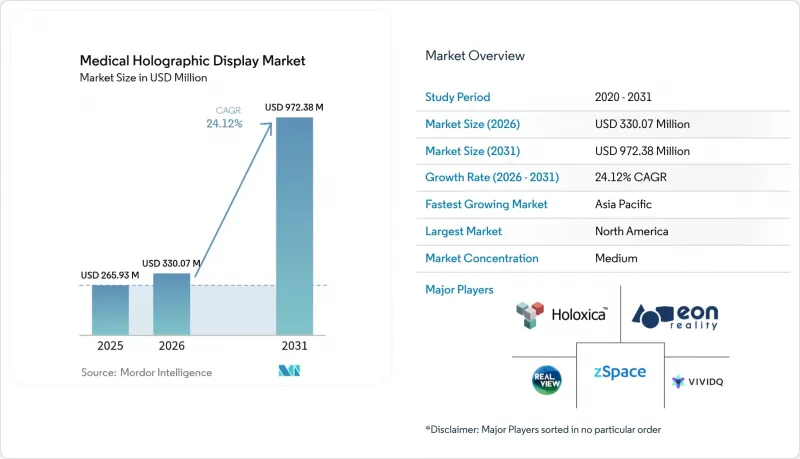
根據 Mordor Intelligence 預測,醫療全像顯示市場規模將從 2025 年的 2.6593 億美元成長到 2026 年的 3.3007 億美元,然後在 2031 年達到 9.7238 億美元,2026 年至 2031 年的複合成長率為 24.12%。
本報告按產品類型(例如,立體3D顯示器)、應用領域(醫學影像和放射學、生物醫學研究、醫學教育和培訓等)、最終用戶(例如,醫院和手術中心)以及地區(北美、歐洲、亞太地區和世界其他地區)進行細分。市場預測以美元計價。
全球醫療全像顯示市場趨勢及洞察
微創手術和影像導引手術的廣泛應用
儘管微創手術的數量正以16.8%的複合年成長率成長,但當2D顯示器上的深度資訊不清晰時,外科醫生仍然會選擇開放性手術。機器人輔助系統目前椎弓骨釘置入的準確率高達99.7%,顯著優於傳統透視技術。 GE醫療於2024年6月在明尼阿波利斯推出的OmnifyXR疊加功能,使介入放射科醫生無需切換工作站即可在原生3D影像中查看導管軌跡。全像導引已作為標準功能整合到達芬奇5手術系統中,表明原始設備製造商(OEM)將身臨其境型視覺化視為競爭優勢。 HoloCare系統已在英國和挪威的大學醫院投入使用,將對準時間縮短了74%,從而縮短了麻醉時間並提高了手術室的利用率。
慢性疾病的日益普遍需要先進的 3D 視覺化技術。
根據世界衛生組織的紀錄,2024年全球新增癌症病例2,000萬例,預計2050年將增加至3,500萬例。目前,腫瘤學和循環系統依賴體積成像技術,但由於其深度和複雜性,這些技術無法在平板顯示器上充分呈現。全像技術可將放射治療中的勾畫誤差降低高達20%,並提高關鍵器官保護的準確性。在一項腹腔鏡消融術的研究中,引入Apple Vision Pro後,手術成功率從42.5%提高到90%。與2D建模工作流程相比,藥物研究人員透過全3D可視化分子結合位點,正在加速先導化合物的篩選。
全像工作站的初始成本和維修成本都很高。
售價在 8 萬至 25 萬美元之間的系統遠遠超出門診中心的預算,而門診中心的營運利潤率比醫院平均低 20% 至 30%。年度維護契約,包括校準和 GPU 升級,又會使成本增加 12% 至 15%。由於全像輔助手術缺乏 CPT 代碼,成本回收幾乎不可能。大學附屬醫院通常依賴津貼而非營運資金,但這對美國 6,000 多家此類機構來說並不現實。供應商只有在證明手術時間縮短 10 分鐘(每分鐘價值 15 至 30 美元)能夠帶來可觀的投資回報率後,才能看到這項技術得到廣泛應用。
細分市場分析
預計2025年,體素3D顯示器將佔銷售額的39.43%,反映出多用戶協作領域的市場已趨於成熟。雷射等電漿顯示器雖然普及率排名第二,但預計將以25.10%的複合年成長率成長,成為醫療全像顯示器市場中成長最快的細分市場。無屏空氣體素技術避免了對無菌區域的干擾,這對手術室而言是一項關鍵優勢。 Leia公司的衍射背光光場系統利用消費級LCD供應鏈,提供了經濟高效的解決方案。 「其他」類別(包括數位全像顯微鏡和AR頭顯)則面向病理學和眼科學等細分市場。
儘管散熱問題和IEC 60825眼部安全標準令雷射等離子技術的前景蒙上陰影,但供應商正努力將刷新率提升至60Hz,以滿足外科手術中的追蹤要求。光場平台每年可降低20%的組件成本,但其角解析度仍落後於體成像技術。由於FDA的批准是基於應用而非光學元件,供應商透過持續改進硬體而非提交新的申請來縮短開發週期。持續創新使得醫療全像顯示市場的產品類型在監管方面保持獨立性,但臨床買家仍將影像保真度和無菌性視為關鍵因素。
區域分析
預計到2025年,北美將佔全球銷售額的45.15%,這主要得益於北美密集的學術醫療中心網路以及美國成熟的510(k)核准流程。達文西5和GE OmnifyXR的推出,凸顯了OEM廠商在該地區強大的市場地位。加拿大則相對落後,在採購前要求提供嚴格的成本效益分析。同時,墨西哥一家私立連鎖醫院正在腫瘤中心試驗應用全像技術,但面臨保險報銷不均的問題。
亞太地區預計將以25.19%的複合年成長率(CAGR)實現最高成長,並有望在2031年成為醫療全像顯示器成長最快的市場。這一成長動能主要得益於中國在醫療領域強制推行人工智慧技術、日本透過「先鋒計畫」(Pioneering)加速核准流程以及印度企業化醫院的擴張。中國本土供應商的產品價格比西方同類產品低30-40%,推動了其廣泛應用。在日本,由日本藥品和醫療器材管理局(PMDA)支持的「Holoeyes」平台已在多所大學投入使用;印度的「Apollo」和「Fortis」連鎖醫院正在神經外科手術室開展試點計畫。在韓國和澳大利亞,學術機構也在進行試點項目,同時等待保險公司的報銷決定,這些項目也取得了進展。
在歐洲,德國、英國和法國處於主導,公共研究經費的投資推動了HoloCare的普及,使其在中型市場中佔據了一席之地。 HoloCare已在利茲和奧斯陸獲得CE認證,其引入將適應期縮短了74%,直接滿足了DRG(診斷相關分組)獎勵中縮短住院時間的要求。儘管由於嚴格的歐洲醫療設備法規(MDR)的核准流程,HoloCare的核准需要一定時間,但其嚴格的安全標準得到了保障。在包括拉丁美洲、中東和非洲在內的世界其他地區,HoloCare仍是一個小眾市場,其應用程式正在私立醫療旅遊醫院和津貼的學術研究中心逐步推進。
其他好處:
- Excel格式的市場預測(ME)表
- 3個月的分析師支持
目錄
第1章:引言
- 研究假設和市場定義
- 調查範圍
第2章:調查方法
第3章執行摘要
第4章 市場狀況
- 市場概覽
- 市場促進因素
- 微創手術和影像導引手術正變得越來越普及。
- 慢性疾病的日益普遍需要先進的 3D 視覺化技術。
- 光場和體顯示器組件的快速發展
- 與磁振導航機器人手術平台整合
- GPU光電成本的降低使得即時醫療全像術成為現實。
- 製藥廠商對醫療元宇宙的研發投入激增。
- 市場限制因素
- 全像工作站的初始成本和維修成本都很高。
- 與3D患者數據相關的監管和數據管治挑戰
- 視覺疲勞和網路相關疾病正在阻礙這些設備在臨床環境中的持續使用。
- 缺乏用於全像資料集的DICOM擴展
- 價值供應鏈分析
- 監理情勢
- 技術展望
- 波特五力分析
第5章 市場規模與成長預測
- 依產品類型
- 立體3D顯示
- 光場顯示
- 雷射等電漿顯示器
- 其他
- 透過使用
- 醫學影像和放射學
- 生物醫學研究
- 醫學教育和培訓
- 其他
- 最終用戶
- 醫院和外科中心
- 診斷影像中心
- 學術研究機構
- 製藥和生物技術公司
- 按地區
- 北美洲
- 美國
- 加拿大
- 墨西哥
- 歐洲
- 德國
- 英國
- 法國
- 義大利
- 西班牙
- 其他歐洲國家
- 亞太地區
- 中國
- 日本
- 印度
- 韓國
- 澳洲
- 其他亞太國家
- 世界其他地區
- 北美洲
第6章 競爭情勢
- 市場集中度
- 市佔率分析
- 公司簡介
- BrighterWave AB
- Dimension Technologies Inc.
- EchoPixel Inc.
- EON Reality Inc.
- Holografika Kft.
- Holoxica Limited
- LightSpace Technologies
- Looking Glass Factory Inc.
- Lynx Mixed Reality
- MDH Hologram
- Ovizio Imaging Systems
- Realfiction Holding A/S
- RealView Imaging Ltd.
- VividQ Ltd.
- Voxon Photonics
- WayRay AG
- zSpace Inc.
第7章 市場機會與未來展望
According to Mordor Intelligence, the medical holographic display market size is expected to grow from USD 265.93 million in 2025 to USD 330.07 million in 2026 and is forecast to reach USD 972.38 million by 2031 at 24.12% CAGR over 2026-2031.
This report is Segmented by Product Type (Volumetric 3-D Display, and More), Application (Medical Imaging & Radiology, Biomedical Research, Medical Education & Training, Others), End User (Hospitals & Surgical Centres, and More), and Geography (North America, Europe, Asia-Pacific, Rest of the World). The Market Forecasts are Provided in Terms of Value (USD).
Global Medical Holographic Display Market Trends and Insights
Growing Adoption of Minimally Invasive & Image-Guided Surgery
Minimally invasive surgery volumes are expanding at 16.8% CAGR, yet conversion to open procedures persists when 2-D monitors obscure depth cues. Robot-assisted systems now achieve up to 99.7% pedicle-screw accuracy, greatly surpassing conventional fluoroscopy. GE Healthcare's OmnifyXR overlay, deployed in Minneapolis in June 2024, lets interventional radiologists view catheter trajectories in native 3-D without switching workstations. The da Vinci 5 platform integrates holographic guidance as a built-in feature, illustrating how OEMs perceive immersive visualization as a competitive moat. HoloCare's roll-out in U.K. and Norwegian university hospitals cut alignment time by 74%, translating into shorter anesthesia exposure and higher operating-room throughput.
Increasing Prevalence of Chronic Diseases Requiring Advanced 3-D Visualization
The WHO recorded 20 million new cancer diagnoses in 2024, with a rise to 35 million expected by 2050. Oncology and cardiology now depend on volumetric imaging modalities whose depth complexity overwhelms flat-panel displays. Holography reduces radiation-therapy contouring errors by up to 20%, improving organ-at-risk sparing. In a laparoscopic ablation study, Apple Vision Pro integration lifted procedural success from 42.5% to 90%. Pharmaceutical researchers visualize molecular binding pockets in full 3-D, accelerating lead-compound identification relative to 2-D modeling workflows.
High Capital & Maintenance Cost of Holographic Workstations
Systems priced between USD 80,000 and USD 250,000 eclipse budgets of ambulatory centers whose operating margins trail hospital averages by 20-30%. Annual maintenance contracts add 12-15%, covering calibration and GPU upgrades. Absence of CPT codes for holography-assisted surgery prevents fee recoupment. Academic hospitals often leverage grants rather than operating cash, a path impractical for 6,000-plus U.S. facilities. Vendors must prove that cutting 10 minutes of OR time (valued at USD 15-30 per minute) yields credible ROI before widespread procurement.
Other drivers and restraints analyzed in the detailed report include:
- Rapid Advances in Light-Field & Volumetric Display Components
- Integration with MR-Guided Robotic Surgery Platforms
- Regulatory & Data-Governance Hurdles for 3-D Patient Data
For complete list of drivers and restraints, kindly check the Table Of Contents.
Segment Analysis
Volumetric 3-D displays held 39.43% of 2025 revenue, reflecting maturity in multi-viewer collaboration. Laser plasma displays, though second in adoption, are forecast for 25.10% CAGR, making them the fastest-growing component of the medical holographic display market. Their screen-less mid-air voxels prevent sterile-field breaches, a decisive benefit for operating rooms. Light-field systems, powered by Leia Inc.'s diffractive backlighting, offer a cost-efficient path using consumer LCD supply chains. The "Others" cluster-digital holographic microscopy and AR headsets-serves pathology and ophthalmology niches.
Thermal dissipation and IEC 60825 eye-safety hurdles cloud laser plasma's outlook, yet vendors push refresh rates toward 60 Hz to meet surgical tracking demands. Light-field platforms slash component prices 20% per year, but angular resolution still lags volumetric peers. Because FDA clearances hinge on application rather than optics, suppliers iterate hardware without new submissions, accelerating cycle times. Continuous innovation ensures that the medical holographic display market remains product-type agnostic in regulatory eyes while clinical buyers weigh image fidelity and sterility as decisive factors.
Complete Report Scope:
- By Product Type
- Volumetric 3-D Display
- Light-Field Display
- Laser Plasma Display
- Others
- By Application
- Medical Imaging & Radiology
- Biomedical Research
- Medical Education & Training
- Others
- By End User
- Hospitals & Surgical Centres
- Diagnostic Imaging Centres
- Academic & Research Institutes
- Pharmaceutical & Biotechnology Companies
- By Geography
- North America
- United States
- Canada
- Mexico
- Europe
- Germany
- United Kingdom
- France
- Italy
- Spain
- Rest of Europe
- Asia-Pacific
- China
- Japan
- India
- South Korea
- Australia
- Rest of Asia-Pacific
- Rest of the World
- North America
Geography Analysis
North America controlled 45.15% of 2025 revenue, propelled by the United States' dense network of academic medical centers and a mature 510(k) approval pathway. The da Vinci 5 and GE OmnifyXR launches illustrate entrenched OEM dominance in the region. Canada trails, demanding rigorous cost-effectiveness evidence prior to procurement, while Mexico's private chains pilot holography in oncology centers amid reimbursement gaps.
Asia-Pacific is projected to log the highest 25.19% CAGR, expanding the medical holographic display market size most rapidly through 2031. China's AI-in-healthcare mandates, Japan's accelerated Sakigake pathway, and India's corporate-hospital expansion fuel momentum. Domestic Chinese vendors undercut Western peers by 30-40%, democratizing access. Japan's Holoeyes platform enjoys PMDA backing and broad university deployment, whereas India's Apollo and Fortis chains test systems in neurosurgery suites. South Korea and Australia advance through academic pilots, pending insurer reimbursement decisions.
Europe captures mid-tier share, led by Germany, the United Kingdom, and France, where public research funds catalyze adoption. HoloCare's CE-marked deployments in Leeds and Oslo cut alignment time by 74%, directly answering DRG incentives that reward length-of-stay reductions. The stringent European MDR elongates approvals but ensures safety rigor. Rest-of-World regions-including Latin America, the Middle East, and Africa-remain niche, with uptake in private medical-tourism hospitals and grant-funded academic centers.
- BrighterWave AB
- Dimension Technologies Inc.
- EchoPixel Inc.
- EON Reality
- Holografika Kft.
- Holoxica Limited
- LightSpace Technologies
- Looking Glass Factory Inc.
- Lynx Mixed Reality
- MDH Hologram
- Ovizio Imaging Systems
- Realfiction Holding A/S
- RealView Imaging Ltd.
- VividQ Ltd.
- Voxon Photonics
- WayRay AG
- zSpace
Additional Benefits:
- The market estimate (ME) sheet in Excel format
- 3 months of analyst support
TABLE OF CONTENTS
1 Introduction
- 1.1 Study Assumptions & Market Definition
- 1.2 Scope of the Study
2 Research Methodology
3 Executive Summary
4 Market Landscape
- 4.1 Market Overview
- 4.2 Market Drivers
- 4.2.1 Growing adoption of minimally invasive & image-guided surgery
- 4.2.2 Increasing prevalence of chronic diseases requiring advanced 3-D visualisation
- 4.2.3 Rapid advances in light-field & volumetric display components
- 4.2.4 Integration with MR-guided robotic surgery platforms
- 4.2.5 Falling cost of GPU-photonics enabling point-of-care holography
- 4.2.6 Surge in medical-metaverse R&D funding by pharma OEMs
- 4.3 Market Restraints
- 4.3.1 High capital & maintenance cost of holographic workstations
- 4.3.2 Regulatory & data-governance hurdles for 3-D patient data
- 4.3.3 Visual-fatigue and cybersickness limiting continuous clinical use
- 4.3.4 Lack of DICOM extensions for holographic datasets
- 4.4 Value / Supply-Chain Analysis
- 4.5 Regulatory Landscape
- 4.6 Technological Outlook
- 4.7 Porter's Five Forces Analysis
- 4.7.1 Threat of New Entrants
- 4.7.2 Bargaining Power of Suppliers
- 4.7.3 Bargaining Power of Buyers
- 4.7.4 Threat of Substitutes
- 4.7.5 Intensity of Rivalry
5 Market Size & Growth Forecasts (Value, USD)
- 5.1 By Product Type
- 5.1.1 Volumetric 3-D Display
- 5.1.2 Light-Field Display
- 5.1.3 Laser Plasma Display
- 5.1.4 Others
- 5.2 By Application
- 5.2.1 Medical Imaging & Radiology
- 5.2.2 Biomedical Research
- 5.2.3 Medical Education & Training
- 5.2.4 Others
- 5.3 By End User
- 5.3.1 Hospitals & Surgical Centres
- 5.3.2 Diagnostic Imaging Centres
- 5.3.3 Academic & Research Institutes
- 5.3.4 Pharmaceutical & Biotechnology Companies
- 5.4 By Geography
- 5.4.1 North America
- 5.4.1.1 United States
- 5.4.1.2 Canada
- 5.4.1.3 Mexico
- 5.4.2 Europe
- 5.4.2.1 Germany
- 5.4.2.2 United Kingdom
- 5.4.2.3 France
- 5.4.2.4 Italy
- 5.4.2.5 Spain
- 5.4.2.6 Rest of Europe
- 5.4.3 Asia-Pacific
- 5.4.3.1 China
- 5.4.3.2 Japan
- 5.4.3.3 India
- 5.4.3.4 South Korea
- 5.4.3.5 Australia
- 5.4.3.6 Rest of Asia-Pacific
- 5.4.4 Rest of the World
- 5.4.1 North America
6 Competitive Landscape
- 6.1 Market Concentration
- 6.2 Market Share Analysis
- 6.3 Company Profiles (includes Global level Overview, Market level overview, Core Segments, Financials as available, Strategic Information, Market Rank/Share for key companies, Products & Services, and Recent Developments)
- 6.3.1 BrighterWave AB
- 6.3.2 Dimension Technologies Inc.
- 6.3.3 EchoPixel Inc.
- 6.3.4 EON Reality Inc.
- 6.3.5 Holografika Kft.
- 6.3.6 Holoxica Limited
- 6.3.7 LightSpace Technologies
- 6.3.8 Looking Glass Factory Inc.
- 6.3.9 Lynx Mixed Reality
- 6.3.10 MDH Hologram
- 6.3.11 Ovizio Imaging Systems
- 6.3.12 Realfiction Holding A/S
- 6.3.13 RealView Imaging Ltd.
- 6.3.14 VividQ Ltd.
- 6.3.15 Voxon Photonics
- 6.3.16 WayRay AG
- 6.3.17 zSpace Inc.
7 Market Opportunities & Future Outlook
- 7.1 White-space & Unmet-Need Assessment

 全像顯示器市場:按顯示類型、影像尺寸、技術和應用分類的全球市場預測 – 2026-2032 年
 全像顯示器市場報告:按組件、技術、規模、應用、最終用戶和地區分類(2026-2034 年)
 全像顯示市場機會、成長要素、產業趨勢分析及2026-2035年預測
 2026年全球觸控全像顯示器市場報告2026年全球3D全像市場報告
 全像顯示市場:按技術和地區分類汽車全像顯示器市場:按組件、尺寸、解析度類型、技術類型、顯示器尺寸、應用、車輛類型、銷售管道類型分類,全球預測,2026-2032年
 全像顯示市場分析及至2035年預測:按類型、產品、技術、組件、應用、材料類型、設備、製程、最終用戶及安裝類型分類
 全球全像顯示器市場規模、佔有率、趨勢和成長分析報告(2026-2034年)2026年全像顯示器市場報告