


 |
市場調查報告書
商品編碼
2120834
光伏發電(PV):市場佔有率分析、行業趨勢和統計數據、成長預測(2026-2031)Solar Photovoltaic (PV) - Market Share Analysis, Industry Trends & Statistics, Growth Forecasts (2026 - 2031) |
||||||

※ 本網頁內容可能與最新版本有所差異。詳細情況請與我們聯繫。
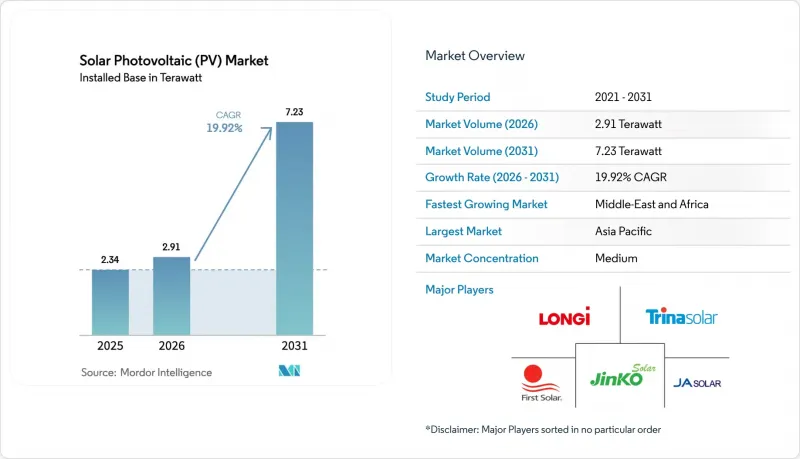
根據 Mordor Intelligence 預測,太陽能發電市場的裝置容量預計將在 2025 年達到 2.34兆瓦,2026 年達到 2.91兆瓦,到 2031 年達到 7.23兆瓦,2026 年至 2031 年的複合年成長率為 19.92%。
本報告按技術(單晶矽、多晶矽、薄膜、疊層/鈣鈦礦)、安裝類型(地面安裝、屋頂/建築整合太陽能、漂浮式)、最終用戶(住宅、商業/工業、公用事業規模獨立發電項目)和地區(北美、歐洲、亞太、南美、中東和非洲)進行細分。市場預測以總波數(GW)為單位。
全球光電市場趨勢與洞察
組件平均售價(ASP)的下降將擴大實現市電平價的區域。
2025年7月,中國離岸價(FOB China)下的太陽能現貨價格高峰跌至每瓦0.082美元,較2024年初下降32%。這項跌幅使得適用市電平價的國家數量增加至142個,在這些國家,公用事業規模的太陽能發電比煤炭或天然氣發電便宜15%至25%。 2025年,前五名供應商佔了68%的出貨量,加速了市場整合。公用事業規模專案21%、屋頂系統19%的監管能源效率標準確保了性能標準。為此,開發商已開始整合組件生產和EPC服務,以恢復利潤率。根據期貨價格曲線,預計到2027年,隨著N型TOPCon技術在製造成本方面與PERC技術相媲美,價格還將進一步下降10%至15%。
IRA推動太陽能發電製造業回歸美國。
一項針對組件每瓦直流電0.07美元、電池每瓦直流電0.04美元的第45X條稅額扣抵,促成了一項到2025年投資100億美元的工廠建設計畫。 First Solar位於路易斯安那州的工廠計畫於2026年新增3.5吉瓦的薄膜太陽能電池產能。 2024年,美國國內組件產量達到12吉瓦(直流電),但僅滿足了國內需求的8%。財政部指南,到2027年,美國製造的成本佔比必須達到55%,才能獲得全額30%的投資稅額扣抵。垂直整合的供應鏈已將前置作業時間縮短至八週,並將東海岸專案的運輸成本降低了40%。
可再生能源滲透率高的地區存在電網擁塞和輸出限制的風險。
2023年,加州可再生能源發電減少了260萬兆瓦時,相當於38.5萬戶家庭的年用電量。夜間發電量波動導致燃氣調峰電廠的週期成本每兆瓦時增加15至20美元。德州電力可靠性委員會(ERCOT)預測,到2028年,德克薩斯的太陽能發電量將超過輸電能力,導致每年減少400萬兆瓦時的發電量。 2024年,德國向受限電影響的發電公司支付了12億歐元的補償金。南澳對住宅太陽能發電系統實施了動態輸電限制,導致居民用電收入減少了12%至18%。由於美國電網接入等待容量超過2000吉瓦,電網擴建計畫預計需要10年時間,這將迫使開發商在「表後」位置安裝太陽能發電系統,對太陽能市場構成重大挑戰。
細分市場分析
2025年,單晶矽太陽能板在市場中維持了86.1%的佔有率,其電池效率達到27.81%,進一步鞏固了主導地位。預計到2031年,先進的疊層和鈣鈦礦組件的市場規模將以31.1%的複合年成長率成長。這得歸功於牛津光伏公司(Oxford PV)的商業產品實現了24.5%的效率和10,000小時的穩定性里程碑。多晶矽的市佔率下降至8.2%。這是由於製造商轉向N型TOPCon和異質接面生產線,這些技術在成本相近的情況下可帶來1.5-2個百分點的效能提升。
預計到2025年,主要公司將在研發方面投資超過12億美元,專注於研發雙面、半切和多匯流排佈局的太陽能板,以實現600瓦或以上的功率等級。薄膜碲化鎘(CdTe)太陽能板保持4.9%的市佔率。由於其溫度係數低,且能夠提高年發電量3%至5%,因此在炎熱氣候下的電力設施中備受青睞。資金籌措的確定性取決於是否符合IEC 61215和IEC 61730標準,這些標準構成了融資條款的基礎,並可將債務利差降低至多50個基點。
區域分析
到2025年底,亞太地區將佔全球裝置容量的64.3%,主要得益於中國新計畫和印度累積新增的85吉瓦裝置容量。在日本,由於上網電價補貼(FIT)政策的逐步下調,住宅太陽能發電的成長速度有所放緩,但由於液化天然氣價格波動加劇了人們對價格穩定性的關注,企業購電協議(PPA)數量增加了62%。在東協市場,由於優惠融資政策將債務溢價降低了30-40個基點,新增裝置容量達到18吉瓦。在澳大利亞,居民太陽能發電普及率達38%,但由於可再生能源佔比高的州實施動態出口上限,資金轉向了公用事業規模的太陽能發電+儲能系統。
中東和非洲地區預計將以21.5%的複合年成長率成長,這主要得益於沙烏地阿拉伯的「2030願景」藍圖(58.7吉瓦)和阿拉伯聯合大公國的杜拜園區擴建計畫(5吉瓦)。沙烏地阿拉伯的蘇代爾電廠(裝置容量1.5吉瓦)創下了每度電0.0104美元的最低競標價格紀錄。阿拉伯聯合大公國的努爾阿布達比電廠目前滿足了當地10%的電力需求,並透過輸電網聯網線路向波斯灣地區出口電力。南非在第六輪競標中獲得了3.2吉瓦的訂單,但由於輸電網的限制,推遲了其中1.8吉瓦的部署。奈及利亞將於2025年部署一個450兆瓦的微電網,為280萬人供電。
到2025年,北美太陽能裝置容量佔全球的12.8%。美國新增裝置容量32吉瓦,其中德克薩斯州的年成長率超過加州。加拿大的清潔電力稅額扣抵(30%)促進了亞伯達和安大略省總計2.5吉瓦的裝機量成長。在墨西哥,淨計量系統的不確定性減緩了住宅太陽能裝置速度。歐洲佔了9.4%的市場。德國新增裝置容量8.5吉瓦,西班牙新增裝置容量6.2吉瓦,但由於二氧化碳價格約每噸90歐元,這兩個地區的裝置量都面臨碳定價的壓力。 2025年,巴西的分散式發電裝置容量將達到18吉瓦,並且剩餘電力零售補貼政策將全面維持。
其他好處:
- Excel格式的市場預測(ME)表
- 3個月的分析師支持
目錄
第1章:引言
- 研究假設和市場定義
- 調查範圍
第2章:調查方法
第3章執行摘要
第4章 市場狀況
- 市場概覽
- 市場促進因素
- 組件平均售價(ASP)的下降擴大了市電平價的應用範圍。
- 愛爾蘭共和國的改革促使太陽能光電(PV)製造業回歸美國。
- 利用人工智慧預測太陽能發電量,降低調整成本。
- 綠色氫電解槽計畫的需求
- 企業承諾提供全天候清潔電力購電協議
- 農耕兩用為土地的雙重用途創造了創造收入的可能性。
- 市場限制因素
- 可再生能源普及率高的地區有電網擁塞和輸出限制的風險。
- 多晶矽價格的快速波動給生產商的利潤率帶來了壓力。
- 反傾銷措施正在擾亂供應鏈。
- 更嚴格的屋頂火災法規增加了系統周邊設備 (BOS) 的成本。
- 供應鏈分析
- 監理情勢
- 技術展望
- 波特五力模型
- 裝置容量和出貨趨勢
- 價格和LCOE趨勢
- 重大項目儲備
第5章 市場規模與成長預測
- 透過技術
- 單晶矽
- 多晶矽
- 薄膜(CdTe、CIGS、a-Si)
- 串聯/鈣鈦礦
- 依部署類型
- 地面安裝
- 屋頂/建築一體化光伏(BIPV)
- 浮體式太陽能發電
- 最終用戶
- 住宅
- 商業和工業用途
- 公用事業規模的獨立發電廠
- 按地區
- 北美洲
- 美國
- 加拿大
- 墨西哥
- 歐洲
- 德國
- 英國
- 法國
- 義大利
- 俄羅斯
- 其他歐洲國家
- 亞太地區
- 中國
- 印度
- 日本
- 韓國
- 東南亞國協
- 澳洲
- 亞太地區(其他)
- 南美洲
- 巴西
- 阿根廷
- 其他南美國家
- 中東和非洲
- 沙烏地阿拉伯
- 阿拉伯聯合大公國
- 南非
- 奈及利亞
- 其他中東和非洲國家
- 北美洲
第6章 競爭情勢
- 市場集中度
- 策略趨勢(併購、聯盟、購電協議)
- 市場佔有率分析(主要公司的市場排名和佔有率)
- 公司簡介
- LONGi Green Energy Technology Co. Ltd.
- Trina Solar Co. Ltd.
- JinkoSolar Holding Co. Ltd.
- JA Solar Technology Co. Ltd.
- First Solar Inc.
- Canadian Solar Inc.
- Hanwha Q Cells Co. Ltd.
- SunPower Corporation
- Risen Energy Co. Ltd.
- Sharp Corporation
- Suntech Power Co. Ltd.
- REC Solar Holdings AS
- GCL System Integration Technology
- Maxeon Solar Technologies
- Yingli Solar
- Adani Solar
- Axitec Energy GmbH
- FuturaSun Srl
- Waaree Energies Ltd.
- Meyer Burger Technology AG
第7章 市場機會與未來展望
According to Mordor Intelligence, the solar photovoltaic market size in terms of installed base is projected to be 2.34 Terawatt in 2025, 2.91 Terawatt in 2026, and reach 7.23 Terawatt by 2031, growing at a CAGR of 19.92% from 2026 to 2031.
This report is Segmented by Technology (Monocrystalline-Si, Multicrystalline-Si, Thin-Film, Tandem/Perovskite), Deployment Type (Ground-Mounted, Rooftop/BIPV, Floating PV), End-User (Residential, Commercial and Industrial, Utility-Scale IPPs), and Geography (North America, Europe, Asia-Pacific, South America, Middle East and Africa). The Market Forecasts are Provided in Terms of Volume (GW).
Global Solar Photovoltaic (PV) Market Trends and Insights
Falling Module ASPs Widen Grid-Parity Zones
Spot prices in the Solar PV market dropped to USD 0.082 per watt-peak FOB China in July 2025, a 32% fall from early 2024. The decrease expanded grid-parity to 142 nations where utility-scale solar now undercuts coal and gas generation by 15-25%. Market consolidation accelerated as the five largest suppliers controlled 68% of 2025 shipments. Regulatory efficiency thresholds of 21% for utility projects and 19% for rooftop systems safeguard performance standards. Developers responded by integrating module production and EPC services to recapture margin. Forward price curves suggest another 10-15% decline by 2027 as N-type TOPCon technology achieves manufacturing parity with PERC.
IRA-Driven On-Shoring of PV Manufacturing in the U.S.
Section 45X credits of USD 0.07 per watt-dc for modules and USD 0.04 per watt-dc for cells spurred USD 10 billion of factory announcements through 2025. First Solar's Louisiana plant adds 3.5 GW of thin-film output in 2026. Domestic module production reached 12 GW dc in 2024, yet satisfied only 8% of local demand. Treasury guidance now requires 55% U.S. cost content by 2027 to qualify for the full 30% investment tax credit. Vertically integrated supply chains cut lead times to eight weeks and slashed freight costs by 40% for East Coast projects.
Grid-Congestion & Curtailment Risks in High-Penetration Regions
California curtailed 2.6 million MWh of renewable electricity in 2023, equal to 385,000 homes' annual use. Evening ramps increase gas-peaker cycling costs by USD 15-20 per MWh. ERCOT foresees 4 million MWh of curtailment each year by 2028 as West-Texas solar surpasses transmission capacity. Germany paid EUR 1.2 billion to compensate curtailed generators in 2024. South Australia imposed dynamic export limits on rooftop systems, cutting household feed-in revenue 12-18%. U.S. interconnection queues above 2,000 GW stretch upgrade timelines to a decade, posing a key challenge for the Solar photovoltaic PV market by pushing developers toward behind-the-meter installations.
Other drivers and restraints analyzed in the detailed report include:
- AI-Enabled Solar Forecasting Cuts Balancing Costs
- Demand From Green-Hydrogen Electrolyzer Projects
- Rapid Polysilicon Price Swings Squeeze Producer Margins
For complete list of drivers and restraints, kindly check the Table Of Contents.
Segment Analysis
Monocrystalline silicon maintained 86.1% solar panels market share in 2025 as cell efficiencies reached 27.81%, reinforcing its leadership in the Solar PV industry. The solar panels market size for advanced tandem and perovskite modules is forecast to grow at 31.1% CAGR through 2031, reflecting Oxford PV's 24.5% commercial products and 10,000-hour stability milestones. Multicrystalline declined to 8.2% as producers migrated toward N-type TOPCon and heterojunction lines that lift performance by 1.5-2 percentage points at comparable costs.
Investment in R&D topped USD 1.2 billion among leading firms in 2025, focusing on bifacial, half-cut, and multi-bus-bar layouts that push 600 W-plus panel ratings. Thin-film cadmium-telluride retained a 4.9% share, favored for hot-climate utility sites where lower temperature coefficients elevate annual energy yield 3-5%. Bankability hinges on IEC 61215 and IEC 61730 compliance, which underpins financing terms and lowers debt margins by up to 50 basis points.
Complete Report Scope:
- By Technology
- Monocrystalline-Si
- Multicrystalline-Si
- Thin-film (CdTe, CIGS, a-Si)
- Tandem/Perovskite
- By Deployment Type
- Ground-mounted
- Rooftop/Building-Integrated (BIPV)
- Floating PV
- By End-User
- Residential
- Commercial and Industrial
- Utility-scale IPPs
- By Geography
- North America
- United States
- Canada
- Mexico
- Europe
- Germany
- United Kingdom
- France
- Italy
- Russia
- Rest of Europe
- Asia-Pacifc
- China
- India
- Japan
- South Korea
- ASEAN Countries
- Australia
- Rest of Asia-Pacifc
- South America
- Brazil
- Argentina
- Rest of South America
- Middle East and Africa
- Saudi Arabia
- United Arab Emirates
- South Africa
- Nigeria
- Rest of Middle East and Africa
- North America
Geography Analysis
Asia-Pacific closed 2025 with 64.3% of global installed capacity, driven by China's 210 GW of new projects and India's 85 GW cumulative base. Japan's feed-in tariff step-down slowed rooftop growth, but corporate PPAs advanced 62% as LNG volatility spurred interest in price stability. ASEAN markets added 18 GW thanks to concessional finance that trimmed debt premiums 30-40 basis points. Australia's household penetration reached 38%, yet dynamic export caps in high-renewables states redirected capital toward utility-scale solar-plus-storage.
The Middle East and Africa are set for a 21.5% CAGR, supported by Saudi Arabia's 58.7 GW Vision 2030 roadmap and the UAE's 5 GW Dubai park expansion. Saudi Arabia's 1.5 GW Sudair plant achieved a record USD 0.0104 per kWh bid price. The UAE's Noor Abu Dhabi now covers 10% of local demand and exports into the Gulf interconnector. South Africa awarded 3.2 GW in Bid Window 6 but postponed 1.8 GW due to grid constraints. Nigeria deployed 450 MW of mini-grids in 2025, extending service to 2.8 million people.
North America accounted for 12.8% of the solar photovoltaic market capacity in 2025. The United States added 32 GW, with Texas surpassing California in annual additions. Canada's 30% clean-electricity tax credit stimulated 2.5 GW across Alberta and Ontario. Mexican rooftop deployment slowed amid net-metering uncertainty. Europe captured a 9.4% share; Germany installed 8.5 GW and Spain 6.2 GW under carbon-price pressures near EUR 90 per t CO2. Brazil's distributed-generation base hit 18 GW in 2025, retaining full retail credit for exports.
- LONGi Green Energy Technology Co. Ltd.
- Trina Solar Co. Ltd.
- JinkoSolar Holding Co. Ltd.
- JA Solar Technology Co. Ltd.
- First Solar Inc.
- Canadian Solar Inc.
- Hanwha Q Cells Co. Ltd.
- SunPower Corporation
- Risen Energy Co. Ltd.
- Sharp Corporation
- Suntech Power Co. Ltd.
- REC Solar Holdings AS
- GCL System Integration Technology
- Maxeon Solar Technologies
- Yingli Solar
- Adani Solar
- Axitec Energy GmbH
- FuturaSun Srl
- Waaree Energies Ltd.
- Meyer Burger Technology AG
Additional Benefits:
- The market estimate (ME) sheet in Excel format
- 3 months of analyst support
TABLE OF CONTENTS
1 Introduction
- 1.1 Study Assumptions & Market Definition
- 1.2 Scope of the Study
2 Research Methodology
3 Executive Summary
4 Market Landscape
- 4.1 Market Overview
- 4.2 Market Drivers
- 4.2.1 Falling module ASPs widen grid-parity zones
- 4.2.2 IRA-driven on-shoring of PV manufacturing in the U.S.
- 4.2.3 AI-enabled solar forecasting cuts balancing costs
- 4.2.4 Demand from green-hydrogen electrolyzer projects
- 4.2.5 Corporate 24/7 clean-power PPA commitments
- 4.2.6 Agrivoltaics unlocks dual-land use revenues
- 4.3 Market Restraints
- 4.3.1 Grid-congestion & curtailment risks in high-penetration regions
- 4.3.2 Rapid polysilicon price swings squeeze producer margins
- 4.3.3 Anti-dumping trade actions fragment supply chains
- 4.3.4 Rising rooftop-fire regulations add balance-of-system (BOS) cost
- 4.4 Supply-Chain Analysis
- 4.5 Regulatory Landscape
- 4.6 Technological Outlook
- 4.7 Porter's Five Forces
- 4.7.1 Bargaining Power of Suppliers
- 4.7.2 Bargaining Power of Consumers
- 4.7.3 Threat of New Entrants
- 4.7.4 Threat of Substitutes
- 4.7.5 Intensity of Competitive Rivalry
- 4.8 Installed-Capacity and Shipment Trends
- 4.9 Pricing and LCOE Trends
- 4.10 Key Projects Pipeline
5 Market Size & Growth Forecasts
- 5.1 By Technology
- 5.1.1 Monocrystalline-Si
- 5.1.2 Multicrystalline-Si
- 5.1.3 Thin-film (CdTe, CIGS, a-Si)
- 5.1.4 Tandem/Perovskite
- 5.2 By Deployment Type
- 5.2.1 Ground-mounted
- 5.2.2 Rooftop/Building-Integrated (BIPV)
- 5.2.3 Floating PV
- 5.3 By End-User
- 5.3.1 Residential
- 5.3.2 Commercial and Industrial
- 5.3.3 Utility-scale IPPs
- 5.4 By Geography
- 5.4.1 North America
- 5.4.1.1 United States
- 5.4.1.2 Canada
- 5.4.1.3 Mexico
- 5.4.2 Europe
- 5.4.2.1 Germany
- 5.4.2.2 United Kingdom
- 5.4.2.3 France
- 5.4.2.4 Italy
- 5.4.2.5 Russia
- 5.4.2.6 Rest of Europe
- 5.4.3 Asia-Pacifc
- 5.4.3.1 China
- 5.4.3.2 India
- 5.4.3.3 Japan
- 5.4.3.4 South Korea
- 5.4.3.5 ASEAN Countries
- 5.4.3.6 Australia
- 5.4.3.7 Rest of Asia-Pacifc
- 5.4.4 South America
- 5.4.4.1 Brazil
- 5.4.4.2 Argentina
- 5.4.4.3 Rest of South America
- 5.4.5 Middle East and Africa
- 5.4.5.1 Saudi Arabia
- 5.4.5.2 United Arab Emirates
- 5.4.5.3 South Africa
- 5.4.5.4 Nigeria
- 5.4.5.5 Rest of Middle East and Africa
- 5.4.1 North America
6 Competitive Landscape
- 6.1 Market Concentration
- 6.2 Strategic Moves (M&A, Partnerships, PPAs)
- 6.3 Market Share Analysis (Market Rank/Share for key companies)
- 6.4 Company Profiles (includes Global level Overview, Market level overview, Core Segments, Financials as available, Strategic Information, Products & Services, and Recent Developments)
- 6.4.1 LONGi Green Energy Technology Co. Ltd.
- 6.4.2 Trina Solar Co. Ltd.
- 6.4.3 JinkoSolar Holding Co. Ltd.
- 6.4.4 JA Solar Technology Co. Ltd.
- 6.4.5 First Solar Inc.
- 6.4.6 Canadian Solar Inc.
- 6.4.7 Hanwha Q Cells Co. Ltd.
- 6.4.8 SunPower Corporation
- 6.4.9 Risen Energy Co. Ltd.
- 6.4.10 Sharp Corporation
- 6.4.11 Suntech Power Co. Ltd.
- 6.4.12 REC Solar Holdings AS
- 6.4.13 GCL System Integration Technology
- 6.4.14 Maxeon Solar Technologies
- 6.4.15 Yingli Solar
- 6.4.16 Adani Solar
- 6.4.17 Axitec Energy GmbH
- 6.4.18 FuturaSun Srl
- 6.4.19 Waaree Energies Ltd.
- 6.4.20 Meyer Burger Technology AG
7 Market Opportunities & Future Outlook
- 7.1 White-space & Unmet-need Assessment

 太陽能整合隔音牆市場:策略分析與預測(2026-2031)
 北美光電發電(PV):市場佔有率分析、產業趨勢與統計及成長預測(2026-2031)
 全球太陽能市場:機會與策略展望(至2035年)
 太陽能發電廠市場:按類型、技術、應用、最終用戶、國家和地區分類-全球產業分析、市場規模、市場佔有率及2026年至2033年預測太陽能隔音屏障市場:依產品類型、應用、材料、安裝方式、光電模組、國家及地區分類-全球產業分析、市場規模、市場佔有率及2026年至2033年預測全球資料中心表後電力市場:按電源類型、供電方式、配置、資料中心類型和最終用戶分類-市場規模、產業動態、機會分析和預測(2026-2035 年)
 住宅太陽能市場:依安裝類型、併網方式、組件類型、技術類型、安裝方法、銷售管道和應用分類-2026-2032年全球市場預測太陽能市場:2026-2032年全球市場預測(按面板類型、技術類型、組件、發電容量、系統類型、安裝類型、應用和所有權類型分類)太陽能樹:市場佔有率分析、產業趨勢與統計、成長預測(2026-2031)全球電源調節器市場規模、佔有率、趨勢和成長分析報告(2026-2034年)