


 |
市場調查報告書
商品編碼
2115174
北美光電發電(PV):市場佔有率分析、產業趨勢與統計及成長預測(2026-2031)North America Solar Photovoltaic (PV) - Market Share Analysis, Industry Trends & Statistics, Growth Forecasts (2026 - 2031) |
||||||

※ 本網頁內容可能與最新版本有所差異。詳細情況請與我們聯繫。
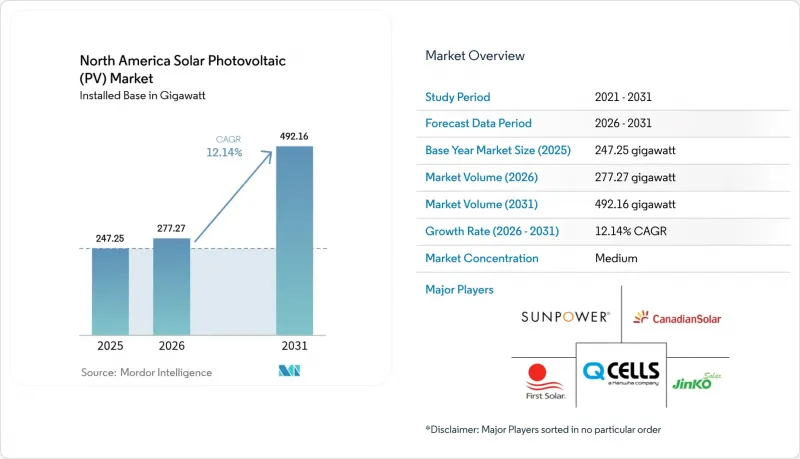
根據 Mordor Intelligence 預測,到 2031 年,北美光電 (PV) 市場規模預計將達到 492.16 GW,從 2026 年的 277.27 GW 成長到 2025 年的 247.25 GW,在預測期(2026-2031 年成長率為 2.12.12.12年成長率。
本報告按電網類型(併網/離網)、最終用戶(公用事業規模、商業/工業、住宅)和地區(美國、加拿大、墨西哥)進行細分。市場規模和預測以裝置容量(GW)表示。
北美太陽能光伏(PV)市場趨勢與洞察
《通貨膨脹控制法》下的投資獎勵措施和延長的投資稅額扣抵(ITC)
30% 的基礎投資稅收抵免 (ITC) 政策已延長至 2032 年,旨在提升整個北美太陽能市場的獲利能力。開發商若符合國內採購要求,可額外獲得 10 個百分點的稅收抵免;若位置於石化燃料產區,又可再獲得 10 個百分點的稅收抵免,使合格的項目實際稅額扣抵率達到 50%。自 2022 年以來,美國宣布的超過 500 億美元的新製造業投資體現了這項政策,其中包括美國能源部承諾提供的 14.5 億美元融資,用於將 Qcells 位於喬治亞的工廠擴建至 8.4 吉瓦的綜合產能。國內採購獎勵要求規定,鋼鐵必須 100% 產自美國,且至少 55% 的產品成本必須來自美國本土,這正在推動多晶矽和晶圓生產的後向整合。針對低收入地區的補貼鼓勵向歷史上電力供應不足的普查區提供分散式發電,從而支持公平部署並促進住宅市場的擴張。
降低商業規模太陽能發電的平準化電力成本(LCOE)。
對於2024年動工的公用事業規模太陽能發電廠,未補貼的平準化電力成本已降至每兆瓦時46美元,加上投資稅額扣抵(ITC),成本進一步降至每兆瓦時31美元,比新建燃氣聯合循環發電廠的成本低約20%。 TOPCon和異質接面組件效率超過24%,加上85%的新建設採用單軸追蹤器,正在提高淨容量利用率並降低系統總成本。目前,雙面組件占美國組件採購量的60%以上,在高反照率位置可將發電量提高5%至10%。 2024 年平均資本成本為每瓦特 (WAC) 1.43 美元,這使得德克薩斯州和西南地區的開發商能夠以每兆瓦時 30 美元或更低的價格簽訂購電協議,從而加速燃煤發電廠的退役並推遲天然氣調峰電廠的建設。
電網連接和電力傳輸瓶頸
至2024年,區域併網備用容量將超過2,600吉瓦,其中太陽能發電將佔1,086吉瓦。然而,歷史數據顯示,實際投入運作的備用容量僅佔15%至20%。備用週期中位數已從2015年的2年增加到5年。聯邦能源監管委員會(FERC)2023號令強制要求進行叢集調查,旨在簡化審查流程,但由於實施延誤,開發商在等待調查結果期間不得不繳納巨額保證金。在中西部和大西洋中部地區,電網升級成本超過每千瓦100美元,對專案利潤率造成壓力。因此,營運商正轉向配電級或離網解決方案,以規避大型電網的限制。自2010年以來,美國新增的輸電線路中,只有12%是為滿足發電需求而預先建造的。這一結構性瓶頸導致每年 20-30 吉瓦發電容量的實現被推遲。
細分市場分析
離網系統成長最快,預計到2031年將以21.30%的複合年成長率成長。礦業公司、農場和電信業者紛紛採用太陽能和儲能結合的混合設計,以避免併網延遲。在北美太陽能市場,離網資產規模預計將從目前的小規模規模成長到2031年的30.52吉瓦,儘管併併網在裝置數量上仍然佔據主導地位。內華達州、亞利桑那州和加拿大北部的偏遠礦場正在將5-20兆瓦的太陽能陣列與柴油發電機結合,以減少40-60%的燃料消耗,並將投資回收期縮短至4-6年。加州中央谷地和德克薩斯州高平原地區的農業生產者在2024年安裝了1,200多套太陽能灌溉系統,以緩解尖峰時段的用電費用(通常超過每千瓦20美元)。
聯邦和州政府的津貼項目正在推動這一趨勢,這些項目為在農村地區部署可再生能源設施提供高達50%的資本成本補貼。電信業者面臨日益嚴格的正常運作要求,正在颶風易發地區的行動電話安裝10-50千瓦的太陽能發電和儲能裝置,以減少停電期間柴油加油的頻率。隨著磷酸鋰鐵鋰電池的價格在2024年降至每千瓦時150美元以下,以及微電網控制設備日趨成熟並能夠實現自主負載平衡,系統總成本已與電網擴建方案相媲美。雖然到2025年併併網專案將佔總裝置容量的96.12%,但離網系統具有更高的利潤率和更短的開發週期,這一優勢正吸引著專業金融機構和工程總承包(EPC)公司進入這一細分市場。
其他福利
- Excel格式的市場預測(ME)表
- 3個月的分析師支持
目錄
第1章:引言
- 研究假設和市場定義
- 調查範圍
第2章:調查方法
第3章執行摘要
第4章 市場狀況
- 市場概覽
- 市場促進因素
- 延長個人退休帳戶投資和投資稅收抵免的優惠待遇。
- 大型太陽能發電的平準化電成本下降
- 企業購電協議 (PPA) 和實現淨零排放的努力
- 併網逆變器簡介
- 住宅電廠整合的勢頭
- 擴大國內多晶矽組件產能
- 市場限制因素
- 電網連接和電力傳輸瓶頸
- 利率上升導致資金籌措成本上升
- 美國貿易法措施與世界貿易組織令造成的混亂
- 基於土地利用和生物多樣性方面的擔憂,有人反對位置。
- 供應鏈分析
- 監理情勢
- 技術展望
- 波特五力模型
第5章 市場規模與成長預測
- 按網格類型
- 併網
- 離網
- 最終用戶
- 實用規模
- 商業和工業(C&I)
- 住宅
- 按地區
- 美國
- 加拿大
- 墨西哥
- 按成分(定性分析)
- 太陽能模組/面板
- 逆變器(組串式、集中式、微型)
- 安裝和追蹤系統
- 系統平衡和電氣設備
- 儲能和混合整合
第6章 競爭情勢
- 市場集中度
- 策略趨勢(併購、聯盟、購電協議)
- 市場佔有率分析(主要公司的市場排名和佔有率)
- 公司簡介
- First Solar, Inc.
- Canadian Solar Inc.
- Hanwha Q CELLS Co. Ltd.
- SunPower Corp.
- Sunrun Inc.
- Trina Solar Ltd.
- JinkoSolar Holding Co. Ltd.
- JA Solar Technology Co. Ltd.
- Maxeon Solar Technologies
- Tesla Inc.(Energy Generation)
- Enphase Energy Inc.
- SMA Solar Technology AG
- Nextracker Inc.
- Array Technologies Inc.
- Silfab Solar Inc.
- LONGi Green Energy Tech. Co. Ltd.
- GAF Energy LLC
- Silicon Ranch Corp.
- Brookfield Renewable Partners LP
- Soligent Distribution LLC
第7章 市場機會與未來展望
According to Mordor Intelligence, the North America solar photovoltaic (PV) market size was valued at 247.25 gigawatt in 2025 and estimated to grow from 277.27 gigawatt in 2026 to reach 492.16 gigawatt by 2031, at a CAGR of 12.14% during the forecast period (2026-2031).
This report is Segmented by Grid Type (On-Grid and Off-Grid), End-User (Utility-Scale, Commercial and Industrial, and Residential), and Geography (United States, Canada, and Mexico). The Market Sizes and Forecasts are Provided in Terms of Installed Capacity (GW).
North America Solar Photovoltaic (PV) Market Trends and Insights
Inflation Reduction Act Investment and Extended ITC Incentives
The 30% base ITC, extended through 2032, underpins project economics across the North America solar photovoltaic market. Developers may stack an additional 10 percentage points for domestic-content compliance and another 10 points for siting in former fossil-fuel communities, lifting the effective credit to 50% for qualifying projects. More than USD 50 billion in new U.S. manufacturing announcements since 2022 reflect this design, including a USD 1.45 billion Department of Energy loan commitment that will lift Qcells' Georgia complex to 8.4 GW of fully integrated capacity. The domestic-content bonus requires 100% U.S.-sourced steel and at least 55% domestic product cost, prompting backward integration into polysilicon and wafer production. Low-income community adders are steering distributed generation toward historically underserved census tracts, supporting equitable adoption and broadening the residential addressable market.
Declining Levelized Cost of Energy for Utility-Scale Solar
Utility-scale solar's unsubsidized levelized cost fell to USD 46 per MWh for 2024-vintage projects, and the ITC reduces that to USD 31 per MWh, under-pricing new gas combined-cycle capacity by roughly 20%. Module efficiencies above 24% for TOPCon and heterojunction designs, combined with single-axis trackers on 85% of new builds, are raising net capacity factors and lowering balance-of-system costs. Bifacial modules now represent more than 60% of U.S. procurement and add 5%-10% energy gain in high-albedo sites. Capital costs averaged USD 1.43 per WAC-watt in 2024, allowing developers in Texas and the Southwest to sign sub-USD 30 per MWh power-purchase agreements that displace coal retirements and defer gas peaker construction.
Interconnection and Transmission Bottlenecks
The regional interconnection queue topped 2,600 GW in 2024, with solar accounting for 1,086 GW, yet historically, only 15%-20% of queued capacity reaches operation. The median queue time stretched to 5 years, up from 2 years in 2015. Cluster studies mandated by FERC Order 2023 are designed to streamline reviews, but implementation lags have left developers carrying high-deposit exposures while waiting for study outcomes. In the Midwest and Mid-Atlantic, network-upgrade costs exceed USD 100 per kW, eroding project margins and steering sponsors toward distribution-level or off-grid solutions that bypass bulk-system constraints. Only 12% of U.S. transmission added since 2010 was built proactively ahead of generation, creating a structural bottleneck that defers 20-30 GW of otherwise viable capacity each year.
Other drivers and restraints analyzed in the detailed report include:
- Corporate PPA and Net-Zero Commitments
- Grid-Forming Inverter Adoption
- Rising Interest-Rate Driven Financing Costs
For complete list of drivers and restraints, kindly check the Table Of Contents.
Segment Analysis
Off-grid systems posted the fastest growth, expanding at a 21.30% CAGR through 2031 as mines, farms, and telecom operators adopt hybrid solar-plus-storage designs to avoid interconnection delays. The North America solar photovoltaic market size for off-grid assets is projected to grow from a modest base to 30.52 GW by 2031, while on-grid installations maintain numerical dominance. Remote mining operations in Nevada, Arizona, and northern Canada are pairing 5-20 MW solar arrays with diesel gensets, cutting fuel consumption 40%-60% and trimming payback periods to 4-6 years. Agricultural producers in California's Central Valley and Texas's High Plains deployed more than 1,200 solar-powered irrigation systems in 2024, limiting peak-period demand charges that often top USD 20 per kW.
Momentum is reinforced by federal and provincial grant programs that subsidize up to 50% of capital costs for rural renewable installations. Telecommunications carriers, facing stricter uptime requirements, are fitting cell towers in hurricane-prone regions with 10-50 kW solar-storage kits, reducing diesel refueling trips during grid outages. As lithium-iron-phosphate battery prices dipped below USD 150 per kWh in 2024, microgrid controllers matured, enabling autonomous load balancing that keeps total system costs competitive with grid-extension alternatives. Although on-grid projects retain 96.12% of 2025 installed capacity, the off-grid cohort supplies higher margins and shorter development cycles, a combination that is drawing specialized financiers and EPC firms into the niche.
Complete Report Scope:
- By Grid Type
- On-Grid
- Off-Grid
- By End-User
- Utility-Scale
- Commercial and Industrial (C&I)
- Residential
- By Geography
- United States
- Canada
- Mexico
- By Component (Qualitative Analysis)
- Solar Modules/Panels
- Inverters (String, Central, Micro)
- Mounting and Tracking Systems
- Balance-of-System and Electricals
- Energy Storage and Hybrid Integration
List of Companies Covered in this Report:
- First Solar, Inc.
- Canadian Solar Inc.
- Hanwha Q CELLS Co. Ltd.
- SunPower Corp.
- Sunrun Inc.
- Trina Solar Ltd.
- JinkoSolar Holding Co. Ltd.
- JA Solar Technology Co. Ltd.
- Maxeon Solar Technologies
- Tesla Inc. (Energy Generation)
- Enphase Energy Inc.
- SMA Solar Technology AG
- Nextracker Inc.
- Array Technologies Inc.
- Silfab Solar Inc.
- LONGi Green Energy Tech. Co. Ltd.
- GAF Energy LLC
- Silicon Ranch Corp.
- Brookfield Renewable Partners LP
- Soligent Distribution LLC
Additional Benefits:
- The market estimate (ME) sheet in Excel format
- 3 months of analyst support
TABLE OF CONTENTS
1 Introduction
- 1.1 Study Assumptions & Market Definition
- 1.2 Scope of the Study
2 Research Methodology
3 Executive Summary
4 Market Landscape
- 4.1 Market Overview
- 4.2 Market Drivers
- 4.2.1 IRA investment & extended ITC incentives
- 4.2.2 Declining LCOE for utility-scale solar
- 4.2.3 Corporate PPA & net-zero commitments
- 4.2.4 Grid-forming inverter adoption
- 4.2.5 Residential VPP aggregation momentum
- 4.2.6 Domestic polysilicon & module build-out
- 4.3 Market Restraints
- 4.3.1 Interconnection & transmission bottlenecks
- 4.3.2 Rising interest-rate driven financing costs
- 4.3.3 U.S. trade-law actions & WRO disruptions
- 4.3.4 Land-use & biodiversity siting opposition
- 4.4 Supply-Chain Analysis
- 4.5 Regulatory Landscape
- 4.6 Technological Outlook
- 4.7 Porter's Five Forces
- 4.7.1 Threat of New Entrants
- 4.7.2 Bargaining Power of Suppliers
- 4.7.3 Bargaining Power of Buyers
- 4.7.4 Threat of Substitutes
- 4.7.5 Competitive Rivalry
5 Market Size & Growth Forecasts
- 5.1 By Grid Type
- 5.1.1 On-Grid
- 5.1.2 Off-Grid
- 5.2 By End-User
- 5.2.1 Utility-Scale
- 5.2.2 Commercial and Industrial (C&I)
- 5.2.3 Residential
- 5.3 By Geography
- 5.3.1 United States
- 5.3.2 Canada
- 5.3.3 Mexico
- 5.4 By Component (Qualitative Analysis)
- 5.4.1 Solar Modules/Panels
- 5.4.2 Inverters (String, Central, Micro)
- 5.4.3 Mounting and Tracking Systems
- 5.4.4 Balance-of-System and Electricals
- 5.4.5 Energy Storage and Hybrid Integration
6 Competitive Landscape
- 6.1 Market Concentration
- 6.2 Strategic Moves (M&A, Partnerships, PPAs)
- 6.3 Market Share Analysis (Market Rank/Share for key companies)
- 6.4 Company Profiles (includes Global level Overview, Market level overview, Core Segments, Financials as available, Strategic Information, Products & Services, and Recent Developments)
- 6.4.1 First Solar, Inc.
- 6.4.2 Canadian Solar Inc.
- 6.4.3 Hanwha Q CELLS Co. Ltd.
- 6.4.4 SunPower Corp.
- 6.4.5 Sunrun Inc.
- 6.4.6 Trina Solar Ltd.
- 6.4.7 JinkoSolar Holding Co. Ltd.
- 6.4.8 JA Solar Technology Co. Ltd.
- 6.4.9 Maxeon Solar Technologies
- 6.4.10 Tesla Inc. (Energy Generation)
- 6.4.11 Enphase Energy Inc.
- 6.4.12 SMA Solar Technology AG
- 6.4.13 Nextracker Inc.
- 6.4.14 Array Technologies Inc.
- 6.4.15 Silfab Solar Inc.
- 6.4.16 LONGi Green Energy Tech. Co. Ltd.
- 6.4.17 GAF Energy LLC
- 6.4.18 Silicon Ranch Corp.
- 6.4.19 Brookfield Renewable Partners LP
- 6.4.20 Soligent Distribution LLC
7 Market Opportunities & Future Outlook
- 7.1 White-space & Unmet-need Assessment

 太陽能整合隔音牆市場:策略分析與預測(2026-2031)
 光伏發電(PV):市場佔有率分析、行業趨勢和統計數據、成長預測(2026-2031)
 全球太陽能市場:機會與策略展望(至2035年)
 太陽能發電廠市場:按類型、技術、應用、最終用戶、國家和地區分類-全球產業分析、市場規模、市場佔有率及2026年至2033年預測太陽能隔音屏障市場:依產品類型、應用、材料、安裝方式、光電模組、國家及地區分類-全球產業分析、市場規模、市場佔有率及2026年至2033年預測全球資料中心表後電力市場:按電源類型、供電方式、配置、資料中心類型和最終用戶分類-市場規模、產業動態、機會分析和預測(2026-2035 年)
 住宅太陽能市場:依安裝類型、併網方式、組件類型、技術類型、安裝方法、銷售管道和應用分類-2026-2032年全球市場預測太陽能市場:2026-2032年全球市場預測(按面板類型、技術類型、組件、發電容量、系統類型、安裝類型、應用和所有權類型分類)太陽能樹:市場佔有率分析、產業趨勢與統計、成長預測(2026-2031)全球電源調節器市場規模、佔有率、趨勢和成長分析報告(2026-2034年)