


 |
市場調查報告書
商品編碼
2097341
太陽能樹:市場佔有率分析、產業趨勢與統計、成長預測(2026-2031)Solar Tree - Market Share Analysis, Industry Trends & Statistics, Growth Forecasts (2026 - 2031) |
||||||

※ 本網頁內容可能與最新版本有所差異。詳細情況請與我們聯繫。
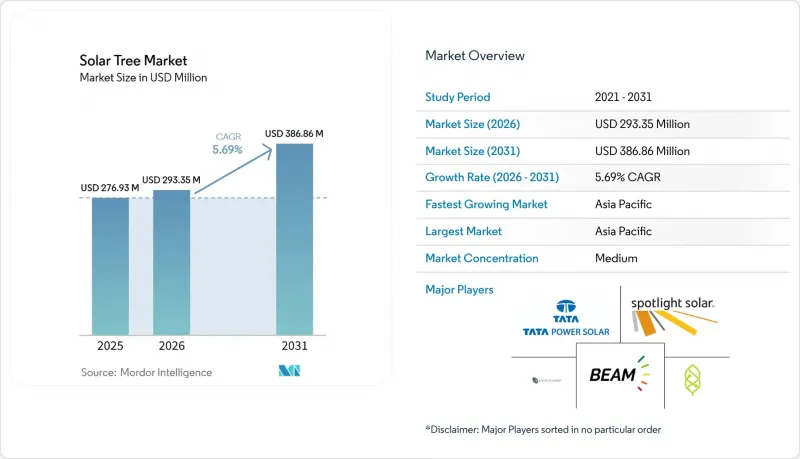
根據 Mordor Intelligence 預測,太陽能樹市場規模預計在 2025 年達到 2.7693 億美元,2026 年達到 2.9335 億美元,到 2031 年達到 3.8686 億美元,2026 年至 2031 年的複合年成長率為 5.69%。
本報告按產品類型(併網型、離網型、混合型)、太陽能電池技術(單晶矽、其他)、輸出功率(1千瓦以下、1-5千瓦、5千瓦以上)、安裝方式(自主型、其他)、應用領域(城市景觀、其他)和地區(北美、歐洲、亞太、南美、中東和非洲)進行細分。市場預測以美元計價。
全球太陽能樹市場趨勢與分析
超過70個國家強制採用可再生能源
政策目標正在推動分散式發電的普及,當土地和屋頂空間有限,難以安裝平板太陽能板時,太陽能樹市場便從中受益。修訂後的歐盟可再生能源指令要求成員國在2030年將其電力供應中可再生能源發電的比例提高到42.5%。加州的SB 100法案和第24號建築規範要求新停車場必須配備相容太陽能的基礎設施,這鼓勵業主安裝座艙罩式太陽能樹。馬裡蘭州的HB 1036法案要求到2030年,州政府機構50%的停車位必須安裝太陽能板,這將立即創造200兆瓦的市場機會。印度的國家太陽能計畫旨在2030年部署500吉瓦的可再生能源,並利用其智慧城市計畫的資金為街道配備發電設施。雖然目前很少有法規明確規定使用太陽能樹,但當屋頂安裝空間飽和或位於受建築保護的區域時,市政負責人擴大選擇太陽能樹。
對城市綠化和智慧城市設施的需求
市政委員會正透過安裝能源生產設施,將碳中和目標與「場所營造」結合。杜拜當局已安裝了103棵“智慧棕櫚樹”,每天可發電7.2千瓦時,同時提供Wi-Fi和設備充電功能,使其成為旅遊景點。類似的策略正在東協的特大城市推廣,這些太陽能樹為人行道提供遮蔭,降低照明成本,並透過內建感測器收集數據。公眾日益成長的興趣和社群媒體的關注正在加速預算核准,為供應商提供了進入原本較為保守的採購管道的機會。此外,一體化設計也推高了安裝地點周邊的土地價值,開發商正利用這些土地價值來收回投資成本。
高初始資本支出(CAPEX)與屋頂太陽能發電相比
根據美國能源局(DOE) 的基準數據,安裝成本在每瓦 4.50 美元至 6 美元之間,仍比安裝在平屋頂上的太陽能板高出 30% 至 50%。如果能透過停車場遮陽或品牌推廣獲得額外收入,這一差距會縮小,但市政預算通常優先考慮成本較低的車棚式太陽能板。巴西分散式發電領域的支出預計到 2026 年將呈下降趨勢,這將對高價值產品帶來壓力。雖然資金籌措方案正在不斷發展,康乃狄克州綠色銀行在 2026 年 2 月發布的招標書中也明確允許在空間受限的場地安裝太陽能樹,但此類設施仍然不常見,並且會阻礙銷售。
細分市場分析
至2025年,離網系統佔總銷售額的65.1%。這主要是由於農村計畫和災害應變機構優先考慮「即插即用」解決方案的可靠性。 ECOSUN的貨櫃式「Mobil-Grid」系統正在取代偏遠礦區的柴油發電機,當燃料成本超過0.40美元/千瓦時,其投資回收期不到四年。隨著電池成本降至75美元/度左右,混合動力系統正以7.4%的複合年成長率成長,使都市區能夠在停電期間透過現場儲能維持電力供應,同時還能根據上網電價補貼(FIT)計劃獲得補貼。僅併網的設計方案在歐洲FIT市場仍然存在,但在其他地區逐漸失去市場佔有率。
地方政府開展的示範計畫表明,各種應用場景下的功能整合日益增強。佛羅裡達電力照明公司(Florida Power & Light)的「SolarNow」計畫計畫在2025年在70個地點部署100多套混合動力裝置,證明遊客中心在颶風期間也能受益於備用電源。像達亞南達·薩加爾學院(Dayananda Sagar College)這樣的工程院校正在將小型風力渦輪機整合到太陽能樹中,儘管資本投資增加了25%,但仍獲得了研究經費。在塵土飛揚的薩赫勒地區進行的安裝項目表明,如果不定期清潔,每年會損失15%至20%的能量,這促使製造商採用防水塗層。
預計到2025年,單晶矽將佔74.7%的市場佔有率,這主要得益於大規模生產帶來的成本優勢。晶科能源的TOPCon電池效率超過23%,從而減少了每個安裝項目的組件數量,並減輕了桅杆結構的重量。隨著歷史建築中反射玻璃的減少,薄膜和建築光伏一體化(BIPV)太陽能電池板的市場佔有率預計將會上升。在杜拜,一棵裝有ASCA公司開發的有機太陽能電池的棕櫚樹展示了軟性組件如何滿足傳統硬體無法滿足的設計要求。
鈣鈦礦疊層太陽能板的研究表明,其潛在發電效率可達25%,重量可減輕70%,但保固期不足10年,限制了其在市政合約中的應用,因為市政合約通常要求20年保固。雙面太陽能板可利用地表反照率效應額外發電10-18%,在日本,人們正透過東西向安裝系統,利用尖峰時段的價格差異實現雙面太陽能板的商業化。隨著產品日益多元化,電池板供應商正專注於輕質薄膜(用於行動裝置)和拓普康單晶矽電池板(用於併網設備)等領域,這導致整個市場的採購合作關係發生變化。
區域分析
亞太地區預計在2024年佔全球銷售額的45.5%,並預計在2030年之前以6.2%的複合年成長率成長,這主要得益於高密度都市化、積極的可再生能源組合標準以及降低硬體成本的強大區域供應鏈。中國正在興建的8吉瓦沙漠綜合體展現了規模經濟效益,並已惠及地方政府計畫的組件價格。在新加坡和泰國,進口電力和區域間電網互聯的政策獎勵確保了土地資源有限的大都會圈對緊湊、高效解決方案的持續需求。
北美和歐洲是成熟的、政策主導市場,零碳建築標準和企業ESG目標確保了訂單的穩定,即便人事費用不斷上漲。加州強制性商業太陽能發電以及紐約市第92號和第94號地區法律設定了最低合規標準,優先考慮垂直安裝,以最大限度地利用屋頂空間。在歐洲,各國稅額扣抵的差異,從德國30%的稅額扣抵到義大利的“超級獎勵”,影響著各國的發展軌跡,但歷史中心通用的土地稀缺問題促使買家傾向於選擇具有雕塑般造型的太陽能發電方案。預計到2027年,每年新增太陽能發電裝置容量將達到93.1吉瓦,將進一步擴大符合嚴格城市設計標準的特色項目儲備。
儘管南美洲和中東及非洲地區目前僅佔總合收入的一小部分,但它們展現出巨大的長期潛力。組件價格的下降使尼日的面板銷售量加倍,刺激了對可繞過脆弱電網的垂直陣列的需求。加納一個16.8兆瓦的屋頂太陽能發電工程表明,捐助者的支持計畫如何加速了在熱帶環境中展現卓越性能的開創性計畫。隨著資金籌措管道的成熟,預計這些地區將直接過渡到模組化、離網的“太陽能樹”,用於灌溉、醫療和通訊塔等領域。
其他好處:
- Excel格式的市場預測(ME)表
- 3個月的分析師支持
目錄
第1章:引言
- 市場分析與定義的前提條件
- 分析範圍
第2章 分析方法
第3章執行摘要
第4章 市場狀況
- 市場概覽
- 市場促進因素
- 超過70個國家強制採用可再生能源
- 智慧城市對城市綠化和街道設施的需求
- 適用於土地資源有限的大都會圈的節省空間的電源供應方案。
- 電動車充電站激增需要太陽能樹
- 輕質生物樹脂桅杆可縮短安裝時間。
- 市場限制因素
- 與屋頂太陽能發電相比,前期投資成本高昂
- 歐盟以外地區消費者對能源性能證照的認知度較低
- 關於歷史街區建築高度和景觀的條例
- 鉸接式花瓣設計的複雜操作與維護
- 供應鏈分析
- 監理情勢
- 技術展望
- 波特五力分析
第5章:預測市場規模與成長率
- 依產品類型
- 併網太陽能樹
- 離網太陽能樹
- 混合太陽能樹
- 透過太陽能電池技術
- 單晶矽
- 多晶矽
- 薄膜/光電一體化
- 依輸出類型
- 1千瓦或以下
- 1~5 kW
- 5千瓦或以上
- 透過安裝方法
- 自主
- 屋頂/露台安裝類型
- 模組化套件、移動單元
- 透過使用
- 城市景觀與公園
- 商業和工業園區
- 教育與研究園區
- 住宅微型太陽能發電
- 電動車充電與交通樞紐
- 農村電氣化、農業應用
- 按地區
- 北美洲
- 美國
- 加拿大
- 墨西哥
- 歐洲
- 德國
- 英國
- 法國
- 義大利
- 北歐國家
- 俄羅斯
- 其他歐洲國家
- 亞太地區
- 中國
- 印度
- 日本
- 韓國
- 東南亞國協
- 其他亞太國家
- 南美洲
- 巴西
- 阿根廷
- 其他南美國家
- 中東和非洲
- 沙烏地阿拉伯
- 阿拉伯聯合大公國
- 南非
- 埃及
- 其他中東和非洲國家
- 北美洲
第6章 競爭情勢
- 市場集中度
- 策略趨勢(併購、聯盟、購電協議)
- 市場佔有率分析(主要公司的市場排名和市場佔有率)
- 公司簡介
- Arka Energy
- Beam Global
- Big Sun Energy Technology Inc.
- Cofly Energy
- CSIR-Central Mechanical Engineering Research Institute(CSIR-CMERI)
- ENGO Planet
- Envision Solar International, Inc.
- Heliatronics, Inc.
- Ideematec Deutschland GmbH
- JinkoSolar Holding Co., Ltd.
- NXTGEN NanoTree
- Smartflower Solar GmbH
- Solar Vertical SAS
- SolarBotanic Trees Ltd.
- Solarix BV
- Spotlight Solar LLC
- Su-Kam Power Systems Limited
- SunRobotics Technologies Private Limited
- Tata Power Solar Systems Limited(Solar-Tree Division)
- Tree Power Co., Ltd.
第7章 市場機會與未來展望
According to Mordor Intelligence, the solar tree market size is projected to be USD 276.93 million in 2025, USD 293.35 million in 2026, and reach USD 386.86 million by 2031, growing at a CAGR of 5.69% from 2026 to 2031.
This report is Segmented by Product Type (On-Grid, Off-Grid, Hybrid), Solar-Panel Technology (Monocrystalline, and Others), Power Output (Up To 1 KW, 1-5 KW, Above 5 KW), Installation Mode (Free-Standing, and Others), Application (Urban Landscaping, and Others), and Geography (North America, Europe, Asia-Pacific, South America, Middle East and Africa). Market Forecasts are Provided in Value (USD).
Global Solar Tree Market Trends and Insights
Renewable-Energy Mandates From Over 70 Countries
Policy targets are steering procurement toward distributed generation, and the solar tree market benefits when land or roof constraints rule out flat panels. The European Union's revised Renewable Energy Directive compels member states to hit 42.5% renewable electricity by 2030. California's SB 100 and Title 24 codes now require solar-ready infrastructure on new parking structures, nudging owners toward canopy-style solar trees. Maryland's HB 1036 demands solar on 50% of state-agency parking space by 2030, instantly creating a 200-megawatt opportunity. India's National Solar Mission seeks 500 gigawatts of renewables by 2030 and channels Smart Cities Mission funds into energy-generating street furniture. Although few rules explicitly name solar trees, municipal planners increasingly select them where rooftops are saturated or architecturally protected.
Urban Greening and Smart-City Furniture Demand
City councils are combining carbon-neutrality goals with placemaking by adopting energy-producing amenities. Dubai Municipality installed 103 Smart Palm units that generate 7.2 kWh per day while offering Wi-Fi and device charging, establishing these as tourist landmarks. Similar strategies are emerging across ASEAN mega-cities, where solar trees shade walkways, reduce lighting costs, and collect data via embedded sensors. Public interest and social media visibility are accelerating budget approvals, giving suppliers an entry point into otherwise conservative procurement channels. Integrated designs are also increasing land value around deployment sites, which developers use to recoup capital costs.
High Initial CAPEX vs. Rooftop PV
Installed costs of USD 4.50-6.00 per W remain 30-50% above flat roof installations, according to DOE benchmarks. This gap narrows where parking shade or branding generates additional revenue; however, municipal budgets often default to lower-cost carport arrays. Brazil's distributed-generation outlays are declining for 2026, putting pressure on premium products. Financing options are evolving, with Connecticut Green Bank's February 2026 RFP explicitly permitting solar trees on constrained sites, but such structures remain uncommon, maintaining friction in the sales cycle.
Other drivers and restraints analyzed in the detailed report include:
- Space-Efficient Power for Land-Scarce Metros
- Surge in EV-Charging Nodes Needing Solar Trees
- Low Consumer / EPC Familiarity Outside EU
For complete list of drivers and restraints, kindly check the Table Of Contents.
Segment Analysis
Off-grid systems accounted for 65.1% of 2025 revenue, primarily because rural programs and disaster response agencies prioritize plug-and-play reliability. ECOSUN's containerized Mobil-Grid replaces diesel at remote mines, with payback periods of under four years when fuel costs exceed USD 0.40 /kWh. Hybrid systems are growing at a 7.4% CAGR as battery costs decline toward USD 75/kWh, enabling cities to capture feed-in credits while maintaining power during outages through on-site storage. On-grid-only designs remain present in European feed-in-tariff markets but are losing share elsewhere.
Municipal pilots demonstrate functional convergence across applications. Florida Power & Light's SolarNow program deployed more than 100 hybrid units across 70 venues before the program ended in 2025, showing that visitor centers benefit from backup power during hurricanes. Engineering institutions such as Dayananda Sagar College are integrating small wind rotors onto solar trees, attracting research funding despite a 25% higher capital expenditure. Installations in dusty Sahel environments show 15-20% annual energy losses without regular cleaning, prompting manufacturers to adopt hydrophobic coatings.
Monocrystalline silicon held a 74.7% market share in 2025, driven by cost advantages from mass production. JinkoSolar's TOPCon cells exceed 23% efficiency, enabling fewer panels per installation and lighter mast structures. The market share of thin-film and building-integrated variants is expected to rise, as heritage sites reject reflective glass. Dubai's ASCA organic-photovoltaic palms demonstrate how flexible modules meet design requirements that conventional hardware cannot fulfill.
Perovskite tandem research indicates potential efficiency of 25% alongside 70% weight savings; however, warranties remain under ten years, limiting adoption in municipal contracts that require 20-year coverage. Bifacial modules capture 10-18% additional yield from ground albedo, with Japan's east-west rack installations monetizing this through peak-price arbitrage. Growing diversification is prompting panel suppliers to specialize, lightweight film for mobile kits and TOPCon monocrystalline for grid-tied installations, reshaping procurement alliances across the market.
Complete Report Scope:
- By Product Type
- On-grid Solar Trees
- Off-grid Solar Trees
- Hybrid Solar Trees
- By Solar-Panel Technology
- Monocrystalline Silicon
- Polycrystalline Silicon
- Thin-film and BIPV
- By Power Output
- Up to 1 kW
- 1 to 5 kW
- Above 5 kW
- By Installation Mode
- Free-standing Foundation
- Rooftop / Terrace Mounted
- Modular Kit and Mobile Units
- By Application
- Urban Landscaping and Parks
- Commercial and Industrial Estates
- Educational and Research Campuses
- Residential Micro-PV
- EV-Charging and Transport Hubs
- Rural Electrification and Agri-uses
- By Geography
- North America
- United States
- Canada
- Mexico
- Europe
- Germany
- United Kingdom
- France
- Italy
- NORDIC Countries
- Russia
- Rest of Europe
- Asia-Pacific
- China
- India
- Japan
- South Korea
- ASEAN Countries
- Rest of Asia-Pacific
- South America
- Brazil
- Argentina
- Rest of South America
- Middle East and Africa
- Saudi Arabia
- United Arab Emirates
- South Africa
- Egypt
- Rest of Middle East and Africa
- North America
Geography Analysis
Asia-Pacific retained 45.5% of 2024 revenue and is on track for a 6.2% CAGR to 2030, supported by dense urbanization, aggressive renewable-portfolio standards, and regional supply-chain depth that lowers hardware costs. China's build-out of an 8 GW desert complex demonstrates the scale benefits that spill into component pricing for regional municipal projects. Singapore and Thailand layer policy incentives on imported electricity and regional grid links, ensuring continuous demand for compact, high-yield solutions in land-scarce metros.
North America and Europe form a mature, policy-driven corridor where zero-carbon building codes and corporate ESG targets sustain steady orders despite higher labor costs. California's commercial solar mandate and New York City's Local Laws 92/94 set compliance floors that favor vertical arrays when roofs are fully utilized. In Europe, differential tax credits-from Germany's 30% write-off to Italy's Superbonus-shape country-level growth trajectories, yet shared land-scarcity issues in historic cores tilt buyers toward sculptural solar options. The 93.1 GW annual solar-addition outlook through 2027 deepens the pipeline for specialty formats that coexist with strict urban-design codes.
South America, the Middle East, and Africa collectively account for a smaller revenue slice but exhibit outsized long-run potential. Falling module prices doubled panel sales in Niger and seeded demand for vertical arrays that can bypass fragile grids. Ghana's 16.8 MW rooftop showcase illustrates how donor-backed programs accelerate first-mover projects that validate performance under tropical conditions. As financing tools mature, these regions are expected to leapfrog directly to modular, off-grid trees for irrigation, healthcare, and telecom towers.
- Arka Energy
- Beam Global
- Big Sun Energy Technology Inc.
- Cofly Energy
- CSIR - Central Mechanical Engineering Research Institute (CSIR-CMERI)
- ENGO Planet
- Envision Solar International, Inc.
- Heliatronics, Inc.
- Ideematec Deutschland GmbH
- JinkoSolar Holding Co., Ltd.
- NXTGEN NanoTree
- Smartflower Solar GmbH
- Solar Vertical SAS
- SolarBotanic Trees Ltd.
- Solarix B.V.
- Spotlight Solar LLC
- Su-Kam Power Systems Limited
- SunRobotics Technologies Private Limited
- Tata Power Solar Systems Limited (Solar-Tree Division)
- Tree Power Co., Ltd.
Additional Benefits:
- The market estimate (ME) sheet in Excel format
- 3 months of analyst support
TABLE OF CONTENTS
1 Introduction
- 1.1 Study Assumptions & Market Definition
- 1.2 Scope of the Study
2 Research Methodology
3 Executive Summary
4 Market Landscape
- 4.1 Market Overview
- 4.2 Market Drivers
- 4.2.1 Renewable-energy mandates from Over 70 countries
- 4.2.2 Urban greening & smart-city furniture demand
- 4.2.3 Space-efficient power for land-scarce metros
- 4.2.4 Surge in EV-charging nodes needing solar trees
- 4.2.5 Lightweight bio-resin mast reduces install time
- 4.3 Market Restraints
- 4.3.1 High initial CAPEX vs. rooftop PV
- 4.3.2 Low consumer/EPC familiarity outside EU
- 4.3.3 Height & aesthetic by-laws in heritage districts
- 4.3.4 Complex O&M for articulated petal designs
- 4.4 Supply-Chain Analysis
- 4.5 Regulatory Landscape
- 4.6 Technological Outlook
- 4.7 Porter's Five Forces
- 4.7.1 Threat of New Entrants
- 4.7.2 Bargaining Power of Buyers
- 4.7.3 Bargaining Power of Suppliers
- 4.7.4 Threat of Substitutes
- 4.7.5 Competitive Rivalry
5 Market Size & Growth Forecasts
- 5.1 By Product Type
- 5.1.1 On-grid Solar Trees
- 5.1.2 Off-grid Solar Trees
- 5.1.3 Hybrid Solar Trees
- 5.2 By Solar-Panel Technology
- 5.2.1 Monocrystalline Silicon
- 5.2.2 Polycrystalline Silicon
- 5.2.3 Thin-film and BIPV
- 5.3 By Power Output
- 5.3.1 Up to 1 kW
- 5.3.2 1 to 5 kW
- 5.3.3 Above 5 kW
- 5.4 By Installation Mode
- 5.4.1 Free-standing Foundation
- 5.4.2 Rooftop / Terrace Mounted
- 5.4.3 Modular Kit and Mobile Units
- 5.5 By Application
- 5.5.1 Urban Landscaping and Parks
- 5.5.2 Commercial and Industrial Estates
- 5.5.3 Educational and Research Campuses
- 5.5.4 Residential Micro-PV
- 5.5.5 EV-Charging and Transport Hubs
- 5.5.6 Rural Electrification and Agri-uses
- 5.6 By Geography
- 5.6.1 North America
- 5.6.1.1 United States
- 5.6.1.2 Canada
- 5.6.1.3 Mexico
- 5.6.2 Europe
- 5.6.2.1 Germany
- 5.6.2.2 United Kingdom
- 5.6.2.3 France
- 5.6.2.4 Italy
- 5.6.2.5 NORDIC Countries
- 5.6.2.6 Russia
- 5.6.2.7 Rest of Europe
- 5.6.3 Asia-Pacific
- 5.6.3.1 China
- 5.6.3.2 India
- 5.6.3.3 Japan
- 5.6.3.4 South Korea
- 5.6.3.5 ASEAN Countries
- 5.6.3.6 Rest of Asia-Pacific
- 5.6.4 South America
- 5.6.4.1 Brazil
- 5.6.4.2 Argentina
- 5.6.4.3 Rest of South America
- 5.6.5 Middle East and Africa
- 5.6.5.1 Saudi Arabia
- 5.6.5.2 United Arab Emirates
- 5.6.5.3 South Africa
- 5.6.5.4 Egypt
- 5.6.5.5 Rest of Middle East and Africa
- 5.6.1 North America
6 Competitive Landscape
- 6.1 Market Concentration
- 6.2 Strategic Moves (M&A, Partnerships, PPAs)
- 6.3 Market Share Analysis (Market Rank/Share for key companies)
- 6.4 Company Profiles (includes Global level Overview, Market level overview, Core Segments, Financials as available, Strategic Information, Products & Services, and Recent Developments)
- 6.4.1 Arka Energy
- 6.4.2 Beam Global
- 6.4.3 Big Sun Energy Technology Inc.
- 6.4.4 Cofly Energy
- 6.4.5 CSIR - Central Mechanical Engineering Research Institute (CSIR-CMERI)
- 6.4.6 ENGO Planet
- 6.4.7 Envision Solar International, Inc.
- 6.4.8 Heliatronics, Inc.
- 6.4.9 Ideematec Deutschland GmbH
- 6.4.10 JinkoSolar Holding Co., Ltd.
- 6.4.11 NXTGEN NanoTree
- 6.4.12 Smartflower Solar GmbH
- 6.4.13 Solar Vertical SAS
- 6.4.14 SolarBotanic Trees Ltd.
- 6.4.15 Solarix B.V.
- 6.4.16 Spotlight Solar LLC
- 6.4.17 Su-Kam Power Systems Limited
- 6.4.18 SunRobotics Technologies Private Limited
- 6.4.19 Tata Power Solar Systems Limited (Solar-Tree Division)
- 6.4.20 Tree Power Co., Ltd.
7 Market Opportunities & Future Outlook
- 7.1 White-space & Unmet-need Assessment

 全球太陽能市場:機會與策略展望(至2035年)
 太陽能發電廠市場:按類型、技術、應用、最終用戶、國家和地區分類-全球產業分析、市場規模、市場佔有率及2026年至2033年預測太陽能隔音屏障市場:依產品類型、應用、材料、安裝方式、光電模組、國家及地區分類-全球產業分析、市場規模、市場佔有率及2026年至2033年預測全球資料中心表後電力市場:按電源類型、供電方式、配置、資料中心類型和最終用戶分類-市場規模、產業動態、機會分析和預測(2026-2035 年)
 住宅太陽能市場:依安裝類型、併網方式、組件類型、技術類型、安裝方法、銷售管道和應用分類-2026-2032年全球市場預測太陽能市場:2026-2032年全球市場預測(按面板類型、技術類型、組件、發電容量、系統類型、安裝類型、應用和所有權類型分類)
 全球電源調節器市場規模、佔有率、趨勢和成長分析報告(2026-2034年)
 電源調節器市場規模、佔有率和成長分析:按類型、相數、額定功率、最終用戶、應用和地區分類-2026-2033年產業預測
 共用太陽能市場預測—全球分析(按所有權/資金籌措模式、會員類型、專案規模、區域部署狀況、政策/法律規範、技術類型、最終用戶和地區分類)—2034年
 太陽能市場機會、成長要素、產業趨勢分析及2026-2035年預測。