


 |
市場調查報告書
商品編碼
2120455
歐洲綠色資料中心:市場佔有率分析、產業趨勢與統計及成長預測(2026-2031 年)Europe Green Data Center - Market Share Analysis, Industry Trends & Statistics, Growth Forecasts (2026 - 2031) |
||||||

※ 本網頁內容可能與最新版本有所差異。詳細情況請與我們聯繫。
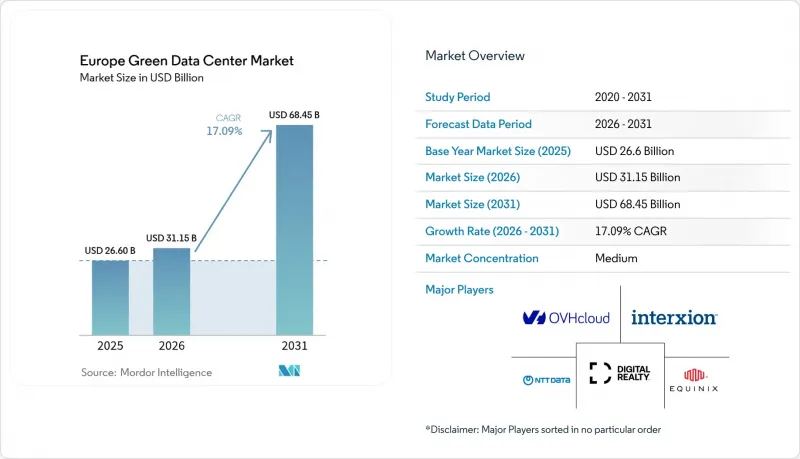
據 Mordor Intelligence 稱,2025 年歐洲綠色資料中心市值為 266 億美元,預計到 2031 年將達到 684.5 億美元,而 2026 年為 311.5 億美元,預測期(2026-2031 年)的複合年成長率為 17.09%。
本報告將產業分為「服務」(系統整合、監控服務、專業服務及其他服務)、「解決方案」(電源、伺服器、管理軟體等)、「使用者」(託管服務提供者、雲端服務供應商、企業)和「終端用戶產業」(醫療保健、金融服務、政府機構等)。市場預測以美元計價。
歐洲綠色資料中心市場趨勢與洞察
雲端運算和巨量資料工作負載的激增
2024年,人工智慧和機器學習任務佔歐洲資料中心電力消耗量的8%,預計2028年將達到20%。這推動了液冷技術的快速普及,其散熱速度比風冷快15到25倍。微軟承諾在利茲投資25億美元建造一個專注於人工智慧的園區,該園區到2026年將容納超過2萬個GPU,顯示超超大規模資料中心業者正在圍繞高密度機架重塑設施架構。邊緣端小規模的推理工作負載正在創建連接到中央訓練叢集的分散式微型站點,從而在降低延遲的同時實現可再生能源目標。量化的永續性指標現已納入企業雲端策略。 2024年,38%的歐洲營運商投資建造更環保的設施,以平衡人工智慧的成長與減少碳排放的承諾。液冷設計和機架級熱回收利用在性能和合規性方面均有優勢,進一步凸顯了此因素在短期需求形成中的重要性。
歐盟綠色交易和「適合55歲」強制規定
能源效率指令要求裝置容量超過 500 千瓦的資料中心公佈年度資源指標,並在 2030 年前將能耗降低 11.7%。德國的《能源效率法》規定,2026 年 7 月之後新建設的 PUE 值上限為 1.2,並強制要求到 2027 年實現 100%可再生能源供應。將於 2024 年 9 月生效的歐盟永續發展評估框架將使營運商能夠對標自身績效,並確保從受《企業永續發展報告指令》約束的公司獲得優先採購權。對合規性的投入正在推動產品創新。 Equinix 正在試行一個餘熱網路,該網路在降低其設施 PUE 值的同時,也能為附近的住宅供暖。能夠提供高度透明指標的營運商在企業提案中獲得了競爭優勢,從而加速了自動化監控和生命週期碳排放計算平台的普及應用。
用於液體冷卻和現場可再生能源的高資本支出 (CAPEX)
晶片級直接冷卻 (DTC) 和浸沒式冷卻系統在整個生命週期內具有潛在的成本節約優勢,但它們比風冷系統高成本20% 至 40%,這意味著對於沒有低成本資金籌措管道的運營商而言,投資回收期會更長。隨著 20 kW 以上 AI 機架的日益普及,對這些升級的需求也隨之增加,但這些維修需要重新設計樓層平面圖、維修電氣系統以及對員工進行再培訓。安裝現場太陽能板和電池儲能系統需要六個月的授權期,這會使工期更加複雜,並增加維護成本。雖然大規模跨國公司正在透過與永續發展掛鉤的融資來降低成本,但規模小規模的託管業者則面臨邊際效益下降的風險,直到資金籌措創新和夥伴關係模式能夠抵消其初期負擔。
細分市場分析
2025年,解決方案銷售額達159.4億美元,佔總支出的59.94%。這主要得益於營運商部署高效電力系統、高密度伺服器和先進冷卻系統,以滿足基於指令的PUE基準。歐洲綠色資料中心服務市場規模達到106.6億美元,預計2031年將以21.66%的複合年成長率成長。這反映出市場對碳會計、生命週期監測和監管諮詢服務的需求激增。專用系統整合方法透過在維修空間內整合液冷和風冷技術,提高了資源效率並縮短了過渡期。資料中心基礎設施管理(DCIM)軟體的持續監測實現了能源報告的自動化,這是歐盟綠色交易透明度審計的強制性要求。在範圍3追蹤義務不斷加強的背景下,專注於供應商審計和嵌入式碳評估的專業服務組合正在獲得市場佔有率,這再次印證了以服務主導的成熟階段,該階段與硬體更新周期相輔相成。
預計到2025年,超大規模資料中心超大規模資料中心業者的營收將佔總營收的34.85%,複合年成長率(CAGR)為23.79%。憑藉著雄厚的財力,他們正積極簽訂可再生能源契約,並開展大規模液冷試點計畫。在超大規模資料中心園區的推動下,歐洲綠色資料中心市場預計到2031年將超過333億美元,購電協議中的永續性條款將成為其長期競爭力的基礎。託管服務供應商透過提供可再生能源證書和餘熱回收方案來吸引中型企業,從而實現差異化競爭。儘管企業內部部署環境持續萎縮,但對延遲敏感型工作負載的企業仍在採用混合模式,利用具備高效冷卻能力的邊緣節點。邊緣節點提供者正在人口密集地區附近部署250千瓦至1兆瓦的模組,並透過重複利用空氣節熱器和模組化電池儲能來確保符合監管要求。領先的超大規模資料中心業者中心營運商正在公開宣布其在建設階段的碳減排計畫。例如,AWS 在瑞典採用了低碳鋼,將其產品固有的排放量減少了高達 70%,並樹立了一個小規模的競爭對手正在努力效仿的標竿。
其他好處:
- Excel格式的市場預測(ME)表
- 3個月的分析師支持
目錄
第1章:引言
- 研究假設和市場定義
- 調查範圍
第2章:調查方法
第3章執行摘要
第4章 市場狀況
- 市場概覽
- 市場促進因素
- 主要促進因素
- 雲端運算和巨量資料工作負載的激增
- 歐盟綠色新政與「適合55歲」強制規定
- FLAP-D 中心中的超大規模和邊緣增強
- 被忽視的促進因素
- Nordic PPA 實現了超低 PUE
- 對利用區域供熱系統廢熱提供補貼。
- 綠色服務水準協定的需求主要集中在範圍 3。
- 市場限制因素
- 主要抑制因素
- 水冷系統和現場可再生能源的高資本支出 (CAPEX)
- 電力短缺樞紐的電網連接延遲
- 表中未顯示的阻礙因素
- 對鋼材和混凝土中含碳量進行詳細檢測。
- 永續資料中心領域工程師短缺
- 價值供應鏈分析
- 監理情勢
- 技術展望
- 波特五力模型
- 評估宏觀經濟趨勢對市場的影響
第5章 市場規模與成長預測
- 按組件
- 按服務
- 系統整合
- 監控服務
- 專業服務
- 其他服務
- 透過解決方案
- Power
- 冷卻
- 伺服器
- 網路裝置
- 管理軟體
- 其他解決方案
- 按服務
- 依資料中心類型
- 託管服務提供者
- 超大規模資料中心業者雲端服務供應商/雲端服務供應商
- 企業和邊緣運算
- 層級特定
- 一級和二級
- 三級
- 第四級
- 按行業分類
- 衛生保健
- 金融服務
- 政府
- 通訊/IT
- 製造業
- 媒體與娛樂
- 其他行業
- 國家
- 德國
- 英國
- 法國
- 荷蘭
- 愛爾蘭
- 挪威
- 瑞典
- 丹麥
- 西班牙
- 義大利
- 俄羅斯
- 其他歐洲國家
第6章 競爭情勢
- 市場集中度
- 策略趨勢
- 市佔率分析
- 公司簡介
- Equinix Inc.
- Digital Realty Trust Inc.
- NTT Global Data Centers EMEA GmbH
- Schneider Electric SE
- Fujitsu Ltd.
- Cisco Systems Inc.
- Dell Technologies Inc.
- Hewlett Packard Enterprise Co.
- IBM Corporation
- Eaton Corporation plc
- Vertiv Holdings Co.
- OVH Groupe SAS
- Interxion Holding NV
- Vantage Data Centers LLC
- Bulk Infrastructure AS
- Green Mountain AS
- EcoDataCenter AB
- Stack Infrastructure Inc.
- Iron Mountain Inc.
- Deep Green Data Centres Ltd.
- Verne Global Ltd.
第7章 市場機會與未來展望
According to Mordor Intelligence, the Europe green data center market size was valued at USD 26.6 billion in 2025 and estimated to grow from USD 31.15 billion in 2026 to reach USD 68.45 billion by 2031, at a CAGR of 17.09% during the forecast period (2026-2031).
This report Segments the Industry Into Service (System Integration, Monitoring Services, Professional Services, Other Services), Solution (Power, Servers, Management Software, and More), User (Colocation Providers, Cloud Service Providers, Enterprises), and End-User Industry (Healthcare, Financial Services, Government, and More). The Market Forecasts are Provided in Terms of Value (USD).
Europe Green Data Center Market Trends and Insights
Cloud & Big-Data Workload Surge
AI and machine-learning tasks consumed 8% of data-center electricity in Europe during 2024 and may hit 20% by 2028, prompting rapid adoption of liquid cooling that removes heat 15-25 times faster than air. Microsoft earmarked USD 2.5 billion for an AI-focused campus in Leeds hosting more than 20,000 GPUs by 2026, signalling how hyperscalers reshape facility architecture around high-density racks. Smaller inference workloads at the edge are spawning distributed micro-sites tethered to central training clusters, reducing latency while sustaining renewable-energy targets. Enterprise cloud strategies now include quantitative sustainability metrics; 38% of European operators invested in greener facilities in 2024 to balance AI growth with carbon-reduction pledges. Liquid-ready designs and rack-level heat reuse deliver both performance and compliance benefits that reinforce the driver's position in near-term demand formation.
EU Green Deal & Fit-for-55 Mandates
The Energy Efficiency Directive obliges data centers above 500 kW to publish annual resource metrics and to cut energy consumption by 11.7% by 2030. Germany's Energy Efficiency Act sets a PUE ceiling of 1.2 for new builds from July 2026 and a 100% renewable-electricity mandate by 2027. A pan-EU sustainability-rating framework entering force in September 2024 enables operators to benchmark performance and secure procurement preference from corporates bound by the Corporate Sustainability Reporting Directive. Compliance spending is unlocking product innovation: Equinix is piloting waste-heat networks that warm neighboring homes while lowering facility PUE. Operators able to evidence transparent metrics gain a competitive edge in enterprise RFPs, intensifying adoption of automated monitoring and lifecycle-carbon accounting platforms.
High CAPEX for Liquid-Cooling & On-site RE
Direct-to-chip and immersion systems cost 20-40% more than air cooling despite life-cycle savings, stretching payback timelines for operators lacking low-cost capital. AI racks topping 20 kW magnify the need for these upgrades, yet retrofit works demand floorplate reconfiguration, electrical refits, and staff reskilling. On-site solar or battery installations face six-month permitting windows, complicating schedules and raising holding costs. Larger multinationals mitigate expense through sustainability-linked loans, but smaller colocation players risk margin compression until financing innovation or partnership models neutralize upfront burdens.
Other drivers and restraints analyzed in the detailed report include:
- Hyperscale & Edge Build-outs in FLAP-D Hubs
- Nordic PPAs Enabling Ultra-Low PUE
- Grid-Connection Delays in Power-Scarce Hubs
For complete list of drivers and restraints, kindly check the Table Of Contents.
Segment Analysis
Solutions revenue reached USD 15.94 billion in 2025, equal to 59.94% of overall expenditure, as operators procured efficient power trains, high-density servers, and advanced cooling to satisfy Directive-driven PUE benchmarks. Europe green data center market size for services registered USD 10.66 billion and is on track for a 21.66% CAGR to 2031, reflecting surging demand for carbon accounting, lifecycle monitoring, and regulatory advisory. Dedicated system-integration practices align liquid and air cooling within retrofit footprints, compressing migration time while raising resource efficiency. Continuous monitoring via data-center-infrastructure-management (DCIM) software automates energy reporting, a mandatory prerequisite for transparency audits under the EU Green Deal. As Scope 3 tracking obligations deepen, professional-services portfolios focused on supplier audits and embodied-carbon assessments capture an incremental share, reaffirming a services-led maturity phase that complements hardware refresh cycles.
Hyperscalers held 34.85% of 2025 revenue and expand at 23.79% CAGR, capitalizing on balance-sheet strength to lock renewable contracts and trial liquid-cooling at scale. The Europe green data center market size attributed to hyperscale campuses is projected to exceed USD 33.3 billion by 2031, with sustainability clauses embedded in power-purchase agreements anchoring long-term competitiveness. Colocation providers differentiate by bundling renewable credits and waste-heat-reuse schemes that appeal to mid-sized enterprises. Enterprise on-premises footprints continue to shrink, yet firms with latency-sensitive workloads maintain hybrid models that lean on edge nodes outfitted with efficient cooling. Edge providers deploy 250 kW-1 MW modules near population centers, ensuring regulatory compliance through recycled-air economizers and modular battery storage. Larger hyperscalers publicize construction-phase carbon cuts, such as AWS adopting low-carbon steel in Sweden to trim embodied emissions by up to 70%, setting a bar smaller competitors strive to match.
Complete Report Scope:
- By Component
- By Service
- System Integration
- Monitoring Services
- Professional Services
- Other Services
- By Solution
- Power
- Cooling
- Servers
- Networking Equipment
- Management Software
- Other Solutions
- By Service
- By Data Center Type
- Colocation Providers
- Hyperscalers/Cloud Service Providers
- Enterprise and Edge
- By Tier Type
- Tier 1 and 2
- Tier 3
- Tier 4
- By Industry Vertical
- Healthcare
- Financial Services
- Government
- Telecom and IT
- Manufacturing
- Media and Entertainment
- Other Verticals
- By Country
- Germany
- United Kingdom
- France
- Netherlands
- Ireland
- Norway
- Sweden
- Denmark
- Spain
- Italy
- Russia
- Rest of Europe
List of Companies Covered in this Report:
- Equinix Inc.
- Digital Realty Trust Inc.
- NTT Global Data Centers EMEA GmbH
- Schneider Electric SE
- Fujitsu Ltd.
- Cisco Systems Inc.
- Dell Technologies Inc.
- Hewlett Packard Enterprise Co.
- IBM Corporation
- Eaton Corporation plc
- Vertiv Holdings Co.
- OVH Groupe SAS
- Interxion Holding N.V.
- Vantage Data Centers LLC
- Bulk Infrastructure AS
- Green Mountain AS
- EcoDataCenter AB
- Stack Infrastructure Inc.
- Iron Mountain Inc.
- Deep Green Data Centres Ltd.
- Verne Global Ltd.
Additional Benefits:
- The market estimate (ME) sheet in Excel format
- 3 months of analyst support
TABLE OF CONTENTS
1 Introduction
- 1.1 Study Assumptions and Market Definition
- 1.2 Scope of the Study
2 Research Methodology
3 Executive Summary
4 Market Landscape
- 4.1 Market Overview
- 4.2 Market Drivers
- 4.2.1 Mainstream Drivers
- 4.2.2 Cloud and Big-Data Workload Surge
- 4.2.3 EU Green Deal and Fit-for-55 Mandates
- 4.2.4 Hyperscale and Edge Build-outs in FLAP-D Hubs
- 4.2.5 Under-the-Radar Drivers
- 4.2.6 Nordic PPAs Enabling Ultra-Low PUE
- 4.2.7 District-Heating Waste-Heat Subsidies
- 4.2.8 Scope-3-Focused Green SLAs Demand
- 4.3 Market Restraints
- 4.3.1 Mainstream Restraints
- 4.3.2 High CAPEX for Liquid-Cooling and On-site RE
- 4.3.3 Grid-Connection Delays in Power-Scarce Hubs
- 4.3.4 Under-the-Radar Restraints
- 4.3.5 Embodied-Carbon Steel and Concrete Scrutiny
- 4.3.6 Sustainable-DC Engineering Talent Shortage
- 4.4 Value / Supply-Chain Analysis
- 4.5 Regulatory Landscape
- 4.6 Technological Outlook
- 4.7 Porter's Five Forces
- 4.7.1 Bargaining Power of Suppliers
- 4.7.2 Bargaining Power of Buyers
- 4.7.3 Threat of New Entrants
- 4.7.4 Threat of Substitutes
- 4.7.5 Competitive Rivalry
- 4.8 Assessment of the impact of Macro Economic Trends on the Market
5 Market Size and Growth Forecasts (Value)
- 5.1 By Component
- 5.1.1 By Service
- 5.1.1.1 System Integration
- 5.1.1.2 Monitoring Services
- 5.1.1.3 Professional Services
- 5.1.1.4 Other Services
- 5.1.2 By Solution
- 5.1.2.1 Power
- 5.1.2.2 Cooling
- 5.1.2.3 Servers
- 5.1.2.4 Networking Equipment
- 5.1.2.5 Management Software
- 5.1.2.6 Other Solutions
- 5.1.1 By Service
- 5.2 By Data Center Type
- 5.2.1 Colocation Providers
- 5.2.2 Hyperscalers/Cloud Service Providers
- 5.2.3 Enterprise and Edge
- 5.3 By Tier Type
- 5.3.1 Tier 1 and 2
- 5.3.2 Tier 3
- 5.3.3 Tier 4
- 5.4 By Industry Vertical
- 5.4.1 Healthcare
- 5.4.2 Financial Services
- 5.4.3 Government
- 5.4.4 Telecom and IT
- 5.4.5 Manufacturing
- 5.4.6 Media and Entertainment
- 5.4.7 Other Verticals
- 5.5 By Country
- 5.5.1 Germany
- 5.5.2 United Kingdom
- 5.5.3 France
- 5.5.4 Netherlands
- 5.5.5 Ireland
- 5.5.6 Norway
- 5.5.7 Sweden
- 5.5.8 Denmark
- 5.5.9 Spain
- 5.5.10 Italy
- 5.5.11 Russia
- 5.5.12 Rest of Europe
6 Competitive Landscape
- 6.1 Market Concentration
- 6.2 Strategic Moves
- 6.3 Market Share Analysis
- 6.4 Company Profiles (includes Global?level Overview, Market?level Overview, Core Segments, Financials, Strategic Info, Market Rank/Share, Products and Services, Recent Developments)
- 6.4.1 Equinix Inc.
- 6.4.2 Digital Realty Trust Inc.
- 6.4.3 NTT Global Data Centers EMEA GmbH
- 6.4.4 Schneider Electric SE
- 6.4.5 Fujitsu Ltd.
- 6.4.6 Cisco Systems Inc.
- 6.4.7 Dell Technologies Inc.
- 6.4.8 Hewlett Packard Enterprise Co.
- 6.4.9 IBM Corporation
- 6.4.10 Eaton Corporation plc
- 6.4.11 Vertiv Holdings Co.
- 6.4.12 OVH Groupe SAS
- 6.4.13 Interxion Holding N.V.
- 6.4.14 Vantage Data Centers LLC
- 6.4.15 Bulk Infrastructure AS
- 6.4.16 Green Mountain AS
- 6.4.17 EcoDataCenter AB
- 6.4.18 Stack Infrastructure Inc.
- 6.4.19 Iron Mountain Inc.
- 6.4.20 Deep Green Data Centres Ltd.
- 6.4.21 Verne Global Ltd.
7 Market Opportunities and Future Outlook
- 7.1 White-Space and Unmet-Need Assessment

 2026年全球綠色資料中心電力市場報告
 綠色電信發展趨勢(2026):人工智慧驅動的電力需求與液冷資料中心
 亞太地區綠色資料中心:市場佔有率分析、產業趨勢與統計及成長預測(2026-2031)
 綠色資料中心市場:按組件、資料中心類型、冷卻方式和最終用戶分類-2026-2032年全球市場預測
 綠色資料中心市場:產業趨勢及2035年全球預測-按組件類型、資料中心規模、最終用戶、產業和地區分類
 綠色資料中心市場:按組件、類型、容量、部署方式、最終用途、國家和地區分類-全球產業分析、市場規模及佔有率、未來預測(2026-2033)
 綠色資料中心市場預測至2034年:按組件、企業規模、最終用戶和地區分類的全球分析綠色銀行解決方案市場預測至2034年-按解決方案類型、銀行職能、技術、部署模式和最終用戶分類的全球分析
 2026-2030年全球綠色資料中心(GDC)市場綠色資料中心:市場佔有率分析、產業趨勢與統計、成長預測(2026-2031)