


 |
市場調查報告書
商品編碼
2066466
綠色資料中心:市場佔有率分析、產業趨勢與統計、成長預測(2026-2031)Green Data Center - Market Share Analysis, Industry Trends & Statistics, Growth Forecasts (2026 - 2031) |
||||||

※ 本網頁內容可能與最新版本有所差異。詳細情況請與我們聯繫。
據 Mordor Intelligence 稱,2025 年綠色資料中心市值為 856.8 億美元,預計到 2031 年將達到 2061.5 億美元,而 2026 年為 991.7 億美元,預測期(2026-2031 年)的複合年成長率為 15.74%。
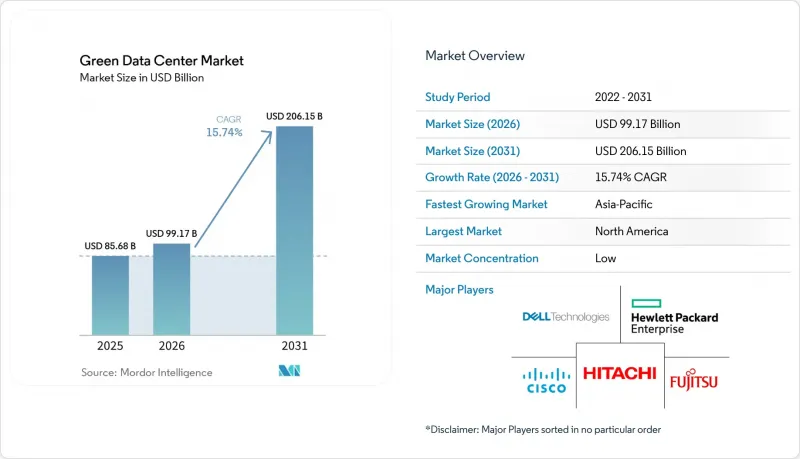
本報告按組件(服務、解決方案)、資料中心類型(託管服務提供者、超大規模資料中心業者/雲端服務供應商、企業級、邊緣運算)、層級(一級和二級、三級、四級)、產業(醫療保健、銀行、金融服務和保險、政府等)以及地區進行細分。市場預測以美元計價。
全球綠色資料中心市場趨勢與洞察
超大規模雲端擴展過渡到 100%可再生能源。
目前,綠色資料中心市場正受益於超大規模營運商大規模承接風能、太陽能和電池儲能混合項目,其規模遠超過自身直接消耗量。亞馬遜的目標是到2024年實現公司範圍內100%使用可再生能源,微軟承諾到2030年實現碳負排放運營,谷歌則利用剩餘再生能源開展城市區域供熱項目,進一步實現餘熱貨幣化。這些策略使營運商能夠獲得價格穩定的電力,透過出售可再生能源證書來獲得對沖收益,並建立供託管設施所有者後續遵循的採購範本。
推動經合組織國家製定法規,將PUE降低至1.3或更低
歐盟新指令和美國修訂後的能源標準要求綠色資料中心市場透明地報告PUE(電源使用效率)、用水效率和碳排放強度。德國的《能源效率法》要求揭露冷卻效率,而AWS報告稱其2024年的全球PUE為1.15,這表明透過結合基於人工智慧的工作負載調度和液冷技術,完全可以滿足監管要求。儘早進行維修的營運商可以透過降低風扇功耗和機械冗餘來節省成本,並在續約託管合約時獲得競爭優勢。違規行為的處罰逐年加大,加速了企業短期內採用節能設備的步伐。
與棕地維修相比,初始資本支出(CAPEX)成長率為(30-40%)
高性能隔熱材料、相容於浸沒式冷卻機架的結構化佈線以及現場太陽能發電和儲能系統,與傳統機房相比,會使建造成本增加高達 40%。即使到了 2025 年,低碳混凝土和相變保溫牆等建築材料的供應仍然有限,這為綠色資料中心市場的發展帶來了進度風險。小規模業者擴大選擇分階段進行能源效率維修,而不是完全採用綠色建設,這在組件價格恢復正常之前,會減緩整體容量的成長。
細分市場分析
2025年,解決方案業務部門將佔總營收的62.54%,在資本密集度方面推動綠色資料中心市場規模的成長。營運商正優先採用電力調節器、熱回收冷卻器和人工智慧驅動的資料中心基礎設施管理(DCIM)軟體來滿足效率要求,同時液冷晶片冷卻產品線的出貨量也實現了兩位數的成長。服務業務板塊雖然絕對規模較小,但預計將以15.38%的複合年成長率成長,這主要得益於設施所有者聘請專家進行生命週期永續性審計、人工智慧驅動的編配以及ESG報告。
電力系統升級,包括採用效率高達98%的UPS模組和智慧電網介面,提高了容錯能力並降低了營運成本。冷卻解決方案也從高位空氣處理機組轉向後門式熱交換器結合熱水循環系統。在服務方面,整合合作夥伴正在提供碳排放計算儀錶板和可再生能源證書(REC)交易平台。這種在永續發展管理方面的專業化發展,代表著綠色資料中心產業的結構性改進。
隨著企業持續推進外包策略,託管公司在2025年將佔總支出的36.62%,但超大規模資料中心業者資料中心營運商以16.21%的複合年成長率 (CAGR) 表現優於其他營運商,推動了綠色資料中心市場自有容量的整體規模成長。他們簽署的價值數十億美元的可再生能源購電協議以及客製化設計的浸沒式冷卻系統正在推動技術應用趨勢,其影響也正蔓延至零售託管服務領域。
企業營運商穩步推進現有設施(棕地)的現代化改造,採用封閉式艙體和模組化電池儲能系統,以滿足板級排放目標。邊緣微型設施仍在開發中,已採用被動式冷卻和太陽能UPS來支援5G基地台的處理能力。大型雲端公司的採購能力持續壓低組件供應商的成本,間接降低了二級供應商的進入門檻。
區域分析
預計到2025年,北美將佔全球銷售額的26.14%,這得益於可靠的可再生能源發電、豐厚的稅收優惠以及維吉尼亞、奧勒岡州和德克薩斯州周邊超大規模資料中心的集中運營。隨著各州監管機構強制要求披露詳細的ESG信息,基於人工智慧的能源管理技術正在被早期採用,該地區的綠色資料中心市場技術領先。
預計到2031年,亞太地區的年複合成長率(CAGR)將達到22.86%,這主要得益於日本的碳中和資料中心計劃、印度的數據主權政策以及澳大利亞的可再生能源區等新建設。東南亞電網瓶頸問題正在推動專用線路太陽能發電和電池儲能組合專案的發展,一旦電網升級改造完成,該地區的能源效率有望顯著提升。
歐洲透過《氣候中和資料中心營運商協議》等統一政策,維持核心地位。在北歐資料中心園區,自然冷卻和豐富的水力資源正被用於向城市供熱網路供熱,從而將有效PUE值降低至1.1。在南歐,太陽能與其他能源結合的混合項目正在加速推進,而德國的購電協議(PPA)正在推動法蘭克福的多重雲端部署。總體而言,區域政策的一致性正在支撐綠色資料中心市場的投資動能。
其他好處:
- Excel格式的市場預測(ME)表
- 3個月的分析師支持
目錄
第1章:引言
- 研究假設和市場定義
- 調查範圍
第2章:調查方法
第3章執行摘要
第4章 市場狀況
- 市場概覽
- 市場促進因素
- 超大規模雲端擴展正在轉向100%可再生能源。
- 在經合組織國家推廣旨在將PUE值控制在1.3或以下的法規
- 校園內裝置容量超過10兆瓦的現場氫燃料電池示範計畫(2025-2028年)
- 區域供熱網路中的廢熱再利用,用於人工智慧工作負載
- 以地區為基礎可再生能源信用額度貨幣化
- 由伺服器OEM廠商合作催生的液冷承包生態系統。
- 市場限制因素
- 與棕地維修相比,初始資本支出(CAPEX)增加了 30-40%。
- 新興國家可再生能源輸電網容量限制
- 城市中心及周邊地區再生水使用權短缺
- 低全球暖化潛勢冷媒(R-718、R-1234yf)的供應鏈波動性
- 供應鏈分析
- 監理情勢
- 技術展望
- 波特五力分析
- 對影響市場的宏觀經濟因素進行評估
第5章 市場規模與成長預測
- 按組件
- 按服務
- 系統整合
- 監控服務
- 專業服務
- 其他服務
- 透過解決方案
- Power
- 冷卻
- 伺服器
- 網路裝置
- 管理軟體
- 其他解決方案
- 按服務
- 依資料中心類型
- 託管服務提供者
- 超大規模資料中心業者雲端服務供應商/雲端服務供應商
- 企業和邊緣運算
- 層級特定
- 一級和二級
- 三級
- 第四級
- 按行業分類
- 衛生保健
- BFSI
- 政府
- 通訊/IT
- 製造業
- 媒體與娛樂
- 其他行業
- 按地區
- 北美洲
- 美國
- 加拿大
- 墨西哥
- 南美洲
- 巴西
- 阿根廷
- 其他南美國家
- 歐洲
- 德國
- 英國
- 法國
- 荷蘭
- 其他歐洲國家
- 亞太地區
- 中國
- 日本
- 印度
- 韓國
- 澳洲和紐西蘭
- 其他亞太國家
- 中東和非洲
- 中東
- 阿拉伯聯合大公國
- 沙烏地阿拉伯
- 土耳其
- 其他中東國家
- 非洲
- 南非
- 奈及利亞
- 其他非洲國家
- 中東
- 北美洲
第6章 競爭情勢
- 市場集中度
- 策略趨勢
- 市佔率分析
- 公司簡介
- Fujitsu Ltd
- Cisco Systems Inc.
- Hewlett Packard Enterprise Co.
- Dell Technologies Inc.
- Hitachi Ltd
- Schneider Electric SE
- IBM Corporation
- Eaton Corporation
- Vertiv Holdings Co
- Equinix Inc.
- Digital Realty Trust Inc.
- NTT Communications Corp.
- Amazon Web Services Inc.
- Microsoft Corp.
- Google LLC
- Huawei Technologies Co. Ltd
- Rittal GmbH and Co. KG
- Siemens AG
- Vapor IO Inc.
- Iron Mountain Inc.
- QTS Realty Trust Inc.
- Keppel Data Centres
第7章 市場機會與未來展望
According to Mordor Intelligence, the green data center market size was valued at USD 85.68 billion in 2025 and is estimated to grow from USD 99.17 billion in 2026 to reach USD 206.15 billion by 2031, at a CAGR of 15.74% during the forecast period (2026-2031).
This report is Segmented by Component (Service, Solution), Data Center Type (Colocation Providers, Hyperscalers/Cloud Service Providers, Enterprise, and Edge), Tier Type (Tier 1 and 2, Tier 3, Tier 4), Industry Vertical (Healthcare, BFSI, Government and More) and by Geography. The Market Forecasts are Provided in Terms of Value (USD).
Global Green Data Center Market Trends and Insights
Hyperscale Cloud Build-outs Shifting to 100% Renewable Power
The green data center market is benefiting from hyperscale operators that now contract for wind, solar, and battery-hybrid projects sized well beyond their direct consumption. Amazon achieved company-wide 100% renewable energy in 2024, Microsoft has pledged carbon-negative operations by 2030, and Google channels surplus renewable power into municipal district-heating projects that further monetise waste heat. These strategies help operators lock in price-stable electricity, create hedging income through renewable-energy credit sales, and establish procurement templates that colocation landlords subsequently follow
Regulatory Push for PUE <= 1.3 Across OECD Economies
New directives in the EU and updated U.S. energy codes require transparent reporting of PUE, water-usage effectiveness, and carbon intensity in the green data center market. Germany's Energy Efficiency Act mandates cooling-efficiency disclosures, while AWS reported a global PUE of 1.15 in 2024, proving compliance is feasible when AI-based workload scheduling and liquid cooling are combined. Operators that retrofit early capture cost savings from lower fan energy and reduced mechanical redundancy, improving competitiveness during colocation contract renewals. Penalties for non-compliance increase each fiscal year, creating a near-term rush to commission energy-efficient equipment.
Up-front CAPEX Premium (30-40%) Versus Brownfield Retrofits
High-performance insulation, structured cabling rated for immersion-cooled racks, and on-site solar plus storage systems inflate build costs by as much as 40% relative to conventional shells. Construction inputs such as low-carbon concrete and phase-change thermal walls remain supply-constrained in 2025, adding schedule risk to green data center market deployments. Smaller operators often pivot to incremental efficiency retrofits instead of full green builds, slowing overall capacity additions until component prices normalise.
Other drivers and restraints analyzed in the detailed report include:
- On-site Hydrogen Fuel-Cell Pilots in Greater than 10 MW Campuses (2025-2028)
- AI-workload Waste-Heat Reuse for District Heating Networks
- Limited Green-Power Grid Capacity in Emerging Economies
For complete list of drivers and restraints, kindly check the Table Of Contents.
Segment Analysis
Solutions generated 62.54% of 2025 revenue, underpinning the green data center market size leadership in capital intensity. Operators prioritised power-conditioning gear, heat-recovery chillers, and artificial-intelligence DCIM software to satisfy efficiency mandates, while liquid-to-chip cooling lines experienced double-digit unit shipment growth. Services, though smaller in absolute value, are forecast for 15.38% CAGR as facility owners engage specialists for lifecycle sustainability audits, AI-driven workload orchestration, and ESG reporting.
Power-train upgrades, including 98%-efficient UPS modules and smart grid interfaces, strengthened resilience and trimmed operating costs. Cooling solutions shifted from raised-floor air handlers to rear-door heat exchangers coupled with warm-water loops. On the services side, integration partners now bundle carbon accounting dashboards and renewable-certificate trading platforms. This professionalisation of sustainability management marks a structural uplift in the green data center industry.
Colocation firms held 36.62% of 2025 spending as enterprises continued outsourcing strategies, yet hyperscalers outpaced the field with a 16.21% CAGR, enlarging the overall green data center market size for self-owned capacity. Their billion-dollar renewable PPAs and custom-designed immersion systems set technology adoption curves that trickle down into retail colocation suites.
Enterprise operators remained steady, refreshing brownfield assets with containment pods and modular battery storage to meet board-level emissions targets. Edge micro-facilities, though nascent, adopted passive cooling and solar-powered UPS to support 5G cell-site processing. The procurement heft of cloud majors keeps component suppliers' cost curves descending, indirectly lowering barriers for second-tier providers.
Geography Analysis
North America accounted for 26.14% revenue in 2025, buttressed by reliable renewable generation, robust tax incentives, and hyperscale activity clustering around Virginia, Oregon, and Texas. State regulators impose granular ESG disclosures, prompting early adoption of AI-based energy management that pushes the regional green data center market ahead in technology maturity.
Asia Pacific is forecast for a 22.86% CAGR through 2031 as Japan's carbon-neutral data center initiative, India's data-sovereignty policy, and Australia's renewable energy zones catalyse new builds. Grid bottlenecks in Southeast Asia have spurred private-wire solar plus battery deals, positioning the region for leap-frog efficiency gains once interconnect upgrades materialise.
Europe maintains a central role through unified policy such as the Climate Neutral Data Centre Operator Pact. Nordic campuses leverage near-free cooling and ample hydropower, exporting heat into municipal networks and thereby lowering effective PUE to 1.1. Southern Europe accelerates solar-hybrid projects, and Germany's corporate PPAs fuel multicloud adoption in Frankfurt. Collectively, regional policy coherence sustains investment momentum within the green data center market
- Fujitsu Ltd
- Cisco Systems Inc.
- Hewlett Packard Enterprise Co.
- Dell Technologies Inc.
- Hitachi Ltd
- Schneider Electric SE
- IBM Corporation
- Eaton Corporation
- Vertiv Holdings Co
- Equinix Inc.
- Digital Realty Trust Inc.
- NTT Communications Corp.
- Amazon Web Services Inc.
- Microsoft Corp.
- Google LLC
- Huawei Technologies Co. Ltd
- Rittal GmbH and Co. KG
- Siemens AG
- Vapor IO Inc.
- Iron Mountain Inc.
- QTS Realty Trust Inc.
- Keppel Data Centres
Additional Benefits:
- The market estimate (ME) sheet in Excel format
- 3 months of analyst support
TABLE OF CONTENTS
1 INTRODUCTION
- 1.1 Study Assumptions and Market Definition
- 1.2 Scope of the Study
2 RESEARCH METHODOLOGY
3 EXECUTIVE SUMMARY
4 MARKET LANDSCAPE
- 4.1 Market Overview
- 4.2 Market Drivers
- 4.2.1 Hyperscale cloud build-outs shifting to 100 % renewable power
- 4.2.2 Regulatory push for PUE Less than or Equal to 1.3 across OECD economies
- 4.2.3 On-site hydrogen fuel-cell pilots in Greater Than 10 MW campuses (2025-2028)
- 4.2.4 AI-workload waste-heat reuse for district heating networks
- 4.2.5 Location-based renewable-energy credits monetization
- 4.2.6 Liquid-cooling turnkey ecosystems from server-OEM alliances
- 4.3 Market Restraints
- 4.3.1 Up-front CAPEX premium (30-40 %) versus brownfield retrofits
- 4.3.2 Limited green-power grid capacity in emerging economies
- 4.3.3 Scarcity of recycled-water rights near urban cores
- 4.3.4 Supply-chain volatility for low-GWP refrigerants (R-718, R-1234yf)
- 4.4 Supply-Chain Analysis
- 4.5 Regulatory Landscape
- 4.6 Technological Outlook
- 4.7 Porter's Five Forces Analysis
- 4.7.1 Bargaining Power of Suppliers
- 4.7.2 Bargaining Power of Buyers
- 4.7.3 Threat of New Entrants
- 4.7.4 Intensity of Competitive Rivalry
- 4.7.5 Threat of Substitute Products
- 4.8 Assesment of Macroeconomic Factors on the Market
5 MARKET SIZE AND GROWTH FORECASTS (VALUE)
- 5.1 By Component
- 5.1.1 By Service
- 5.1.1.1 System Integration
- 5.1.1.2 Monitoring Services
- 5.1.1.3 Professional Services
- 5.1.1.4 Other Services
- 5.1.2 By Solution
- 5.1.2.1 Power
- 5.1.2.2 Cooling
- 5.1.2.3 Servers
- 5.1.2.4 Networking Equipment
- 5.1.2.5 Management Software
- 5.1.2.6 Other Solutions
- 5.1.1 By Service
- 5.2 By Data Center Type
- 5.2.1 Colocation Providers
- 5.2.2 Hyperscalers/Cloud Service Providers
- 5.2.3 Enterprise and Edge
- 5.3 By Tier Type
- 5.3.1 Tier 1 and 2
- 5.3.2 Tier 3
- 5.3.3 Tier 4
- 5.4 By Industry Vertical
- 5.4.1 Healthcare
- 5.4.2 BFSI
- 5.4.3 Government
- 5.4.4 Telecom and IT
- 5.4.5 Manufacturing
- 5.4.6 Media and Entertainment
- 5.4.7 Other Verticals
- 5.5 By Geography
- 5.5.1 North America
- 5.5.1.1 United States
- 5.5.1.2 Canada
- 5.5.1.3 Mexico
- 5.5.2 South America
- 5.5.2.1 Brazil
- 5.5.2.2 Argentina
- 5.5.2.3 Rest of South America
- 5.5.3 Europe
- 5.5.3.1 Germany
- 5.5.3.2 United Kingdom
- 5.5.3.3 France
- 5.5.3.4 Netherlands
- 5.5.3.5 Rest of Europe
- 5.5.4 Asia_Pacific
- 5.5.4.1 China
- 5.5.4.2 Japan
- 5.5.4.3 India
- 5.5.4.4 South Korea
- 5.5.4.5 Australia and New Zealand
- 5.5.4.6 Rest of Asia-Pacific
- 5.5.5 Middle East and Africa
- 5.5.5.1 Middle East
- 5.5.5.1.1 United Arab Emirates
- 5.5.5.1.2 Saudi Arabia
- 5.5.5.1.3 Turkey
- 5.5.5.1.4 Rest of Middle East
- 5.5.5.2 Africa
- 5.5.5.2.1 South Africa
- 5.5.5.2.2 Nigeria
- 5.5.5.2.3 Rest of Africa
- 5.5.5.1 Middle East
- 5.5.1 North America
6 COMPETITIVE LANDSCAPE
- 6.1 Market Concentration
- 6.2 Strategic Moves
- 6.3 Market Share Analysis
- 6.4 Company Profiles (includes Global level Overview, Market level overview, Core Segments, Financials as available, Strategic Information, Market Rank/Share, Products and Services, Recent Developments)
- 6.4.1 Fujitsu Ltd
- 6.4.2 Cisco Systems Inc.
- 6.4.3 Hewlett Packard Enterprise Co.
- 6.4.4 Dell Technologies Inc.
- 6.4.5 Hitachi Ltd
- 6.4.6 Schneider Electric SE
- 6.4.7 IBM Corporation
- 6.4.8 Eaton Corporation
- 6.4.9 Vertiv Holdings Co
- 6.4.10 Equinix Inc.
- 6.4.11 Digital Realty Trust Inc.
- 6.4.12 NTT Communications Corp.
- 6.4.13 Amazon Web Services Inc.
- 6.4.14 Microsoft Corp.
- 6.4.15 Google LLC
- 6.4.16 Huawei Technologies Co. Ltd
- 6.4.17 Rittal GmbH and Co. KG
- 6.4.18 Siemens AG
- 6.4.19 Vapor IO Inc.
- 6.4.20 Iron Mountain Inc.
- 6.4.21 QTS Realty Trust Inc.
- 6.4.22 Keppel Data Centres
7 MARKET OPPORTUNITIES and FUTURE OUTLOOK
- 7.1 White-space and Unmet-Need Assessment

 綠色資料中心市場:按組件、資料中心類型、冷卻方式和最終用戶分類-2026-2032年全球市場預測
 綠色資料中心市場:產業趨勢及2035年全球預測-按組件類型、資料中心規模、最終用戶、產業和地區分類
 綠色資料中心市場:按組件、類型、容量、部署方式、最終用途、國家和地區分類-全球產業分析、市場規模及佔有率、未來預測(2026-2033)
 綠色資料中心市場預測至2034年:按組件、企業規模、最終用戶和地區分類的全球分析綠色銀行解決方案市場預測至2034年-按解決方案類型、銀行職能、技術、部署模式和最終用戶分類的全球分析
 2026-2030年全球綠色資料中心(GDC)市場綠色資料中心技術市場預測至2034年—按組件、技術類型、資料中心類型、最終用戶和地區分類的全球分析氫能資料中心市場預測至2034年-按發電系統、能源來源、設施類型、應用、最終用戶和地區分類的全球分析碳中和資料中心市場預測至2034年-按資料中心類型、能源來源、技術、應用、最終用戶和地區分類的全球分析
 綠色資料中心市場規模、佔有率、趨勢和預測:按組件、資料中心類型、行業和地區分類,2026-2034年