


 |
市場調查報告書
商品編碼
2120390
下一代儲存:市場佔有率分析、行業趨勢和統計數據以及成長預測(2026-2031 年)Next-generation Storage - Market Share Analysis, Industry Trends & Statistics, Growth Forecasts (2026 - 2031) |
||||||

※ 本網頁內容可能與最新版本有所差異。詳細情況請與我們聯繫。
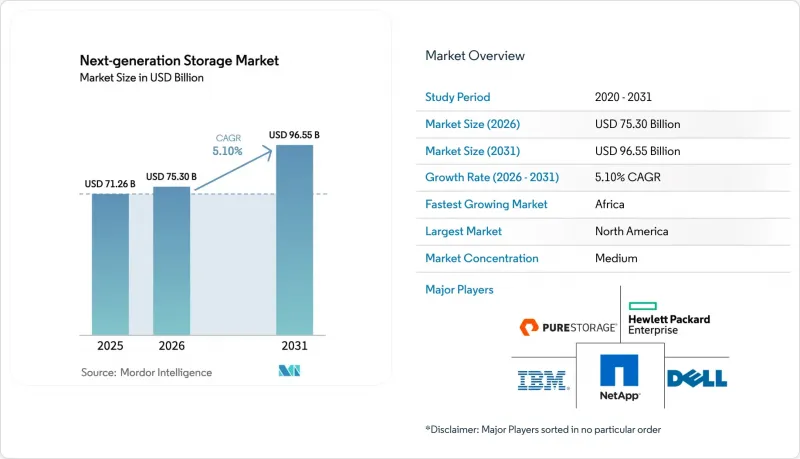
根據 Mordor Intelligence 預測,下一代儲存市場規模將從 2025 年的 712.6 億美元成長到 2026 年的 753 億美元,到 2031 年達到 965.5 億美元,2026 年至 2031 年的複合年成長率為 5.10%。
本報告按儲存系統(直接附加儲存、網路附加儲存、儲存區域網路)、儲存架構(檔案儲存、物件式儲存、區塊儲存)、終端使用者產業(銀行、金融服務和保險、零售、IT和電信、其他)、部署模式(本地部署、雲端部署、混合部署)和地區進行細分。市場預測以美元計價。
全球下一代儲存市場趨勢與洞察
人工智慧推動企業級固態硬碟需求快速成長
生成式人工智慧的訓練使儲存吞吐量成為一項競爭優勢,而超大規模資料中心業者採用全快閃叢集實現數百萬個隨機讀取IOPS,將更新週期從五年縮短至三年。 2025年第二季度,企業級固態硬碟的出貨量年增42%,其中三星PM9E1和美光6550 ION單盤IOPS均超過200萬,使得用一台伺服器取代多個傳統節點成為可能。雲端服務供應商目前主導藍圖的設計,敦促供應商增加儲存層數並降低每Terabyte的功耗。這正在擴大下一代儲存的整體市場規模。
在混合雲端環境中擴充橫向擴充型 NAS
越來越多的公司將部門文件管理器整合到分散式叢集,並自動將存取頻率較低的資料分層儲存到公共雲端物件儲存中,從而推動網路附加儲存 (NAS) 實現兩位數成長。 NetApp 的全快閃 NAS 銷售額在 2025 會計年度第三季度成長了 28%,而戴爾的 PowerScale 則增加了對 S3 的原生支持,使其能夠在同一命名空間內跨本地閃存存儲桶使用。透過消除閘道器和手動遷移,橫向擴展 NAS 降低了管理開銷並加快了資料傳輸速度,從而擴大了其在下一代儲存市場的佔有率。
NAND快閃記憶體體供應鏈持續波動
地緣政治緊張局勢導致NAND快閃記憶體價格劇烈波動,2025年上半年合約價格上漲18%,但由於韓國新產能運作,第三季下跌8%。在高現貨價格下進行避險會擠壓廠商的毛利率,因此一些客戶仍在繼續採用固態硬碟(SSD)和機械硬碟(HDD)混合部署方案,這延緩了下一代儲存架構的全面普及。
細分市場分析
預計到2025年,網路附加儲存 (NAS) 將佔據下一代儲存市場41.40%的佔有率,並將以11.50%的複合年成長率持續成長至2031年。這一成長主要得益於橫向擴展文件集群的廣泛應用,這些集群能夠維護Petabyte級命名空間,用於儲存人工智慧訓練資料、媒體庫和基因組儲存庫。儘管由於融合式基礎架構基礎設施帶來的容量池化,直接附加儲存(DAS) 的市場佔有率正在下降,但儲存區域網路(SAN) 仍然在確保核心銀行和航空系統的確定性延遲方面發揮著至關重要的作用,儘管其年成長率僅為3.2%。
這種轉變反映了非結構化資料的主導地位,非結構化資料目前佔產生資料的 80% 以上,並且與能夠在單一命名空間內處理數十億個檔案的 NAS 協議天然契合。 Qumulo 等供應商報告稱,其媒體相關客戶在Petabyte級叢集上實現了持續 100 GB/s 的寫入速度。同時,NetApp 的 ONTAP 具備自主勒索軟體偵測功能,可在幾秒鐘內擷取異常活動並產生簡介。安全性和可擴展性的結合正在加速 NAS 技術進入以前僅限於物件儲存的工作負載領域,推動其在下一代儲存市場中崛起。
到 2025 年,物件式的系統將佔總收入的 57.80%,而區塊陣列預計到 2031 年將以 9.46% 的複合年成長率成長,這反映出人們對超低延遲的重新關注。 SAP HANA、Oracle Exadata 和容器持久性磁碟區依賴原子寫入,而檔案語意無法保證這一點。因此,企業擴大採用 NVMe over Fabrics 陣列,其吞吐量是傳統光纖通道的 10 倍。由此,區塊陣列在有狀態微服務和記憶體內分析領域重新獲得重視,並在事務處理領域擴大了其在下一代儲存市場的佔有率。
對於容量密集型歸檔應用,能夠提供Exabyte級可擴充性並將每Terabyte成本降低至十分之一的文件和物件平台仍然備受歡迎。據 Cloudian 稱,客戶的平均部署規模超過 5 PB。同時,Scality 的 ARTESCA 將多Petabyte級儲存庫整合到單一命名空間中,從而實現不到一秒鐘的元資料搜尋。這種兩極化使得混合架構的空間有限,區塊儲存主要面向效能密集型工作負載,而檔案儲存則面向容量密集型應用。然而,兩者在更廣泛的下一代儲存市場中都至關重要。
區域分析
到2025年,北美將佔AWS總收入的37.46%,這反映出維吉尼亞、德克薩斯州、奧勒岡州和愛荷華州的超大規模資料中心高度集中。支出主要集中在提升效能的升級項目上,例如Frontier在田納西州部署的700 PB全快閃超級電腦。由於加拿大資料居住法規的限制,AWS於2025年在卡加利新增了一個區域。同時,墨西哥近岸外包業務的蓬勃發展也推動了邊緣運算部署的成長。
在歐洲,《數位營運彈性法案》強制要求歐盟內部建立資料副本,這加劇了主權之爭,促使Oracle和AWS開設了專門的歐洲區域。德國網路安全機構建議對敏感工作負載使用本地部署,這減緩了雲端遷移的步伐,而脫歐後的英國機構則利用美國區域來獲得成本優勢。
非洲市場表現尤為突出,預計到2031年將以14.10%的複合年成長率成長。微軟Azure服務在肯亞的推出以及Google雲端拉各斯區域的計畫開放,正在滿足當地資料儲存需求,並加速本地市場的發展。中東和南美洲也呈現出類似的成長勢頭,共同構成了一個支撐下一代儲存市場的區域格局。
其他好處:
- Excel格式的市場預測(ME)表
- 3個月的分析師支持
目錄
第1章:引言
- 研究假設和市場定義
- 調查範圍
第2章:調查方法
第3章執行摘要
第4章 市場狀況
- 市場概覽
- 市場促進因素
- 數位資料量的成長
- 固態裝置的廣泛應用
- 人工智慧驅動企業級固態硬碟需求快速成長。
- 支援 5G 的邊緣存儲
- 在混合雲端環境中擴充橫向擴充型 NAS
- 基於主權資料居住要求的儲存監管舉措
- 市場限制因素
- 雲端服務中的資料安全漏洞
- NAND快閃記憶體體供應鏈持續波動。
- 儲存型DevOps人才短缺
- 全Flash陣列需要高額的初始資本投入
- 產業價值鏈分析
- 監理情勢
- 技術展望
- 宏觀經濟因素的影響
- 波特五力分析
第5章 市場規模與成長預測
- 儲存系統
- 直接附加儲存(DAS)
- 網路附加儲存 (NAS)
- 儲存區域網路(SAN)
- 儲存架構
- 文件和物件式存儲 (FOBS)
- 區塊儲存
- 按最終用戶行業分類
- BFSI
- 零售
- 資訊科技/通訊
- 衛生保健
- 媒體與娛樂
- 按部署模式
- 現場
- 雲
- 混合
- 按地區
- 北美洲
- 美國
- 加拿大
- 墨西哥
- 歐洲
- 德國
- 英國
- 法國
- 義大利
- 西班牙
- 俄羅斯
- 其他歐洲國家
- 亞太地區
- 中國
- 日本
- 印度
- 韓國
- 澳洲
- 其他亞太國家
- 中東
- 沙烏地阿拉伯
- 阿拉伯聯合大公國
- 土耳其
- 其他中東國家
- 非洲
- 南非
- 奈及利亞
- 其他非洲國家
- 南美洲
- 巴西
- 阿根廷
- 其他南美國家
- 北美洲
第6章 競爭情勢
- 市場集中度
- 策略趨勢
- 市佔率分析
- 公司簡介
- Dell Technologies Inc.
- Hewlett Packard Enterprise Company
- NetApp, Inc.
- Hitachi Vantara LLC
- International Business Machines Corporation(IBM)
- Toshiba Corporation
- Pure Storage, Inc.
- DataDirect Networks, Inc.
- Scality SA
- Fujitsu Limited
- NETGEAR, Inc.
- Huawei Technologies Co., Ltd.
- Western Digital Corporation
- Samsung Electronics Co., Ltd.
- Micron Technology, Inc.
- Seagate Technology Holdings plc
- Synology Inc.
- QNAP Systems, Inc.
- Buffalo Inc.
- Qumulo, Inc.
- Cloudian, Inc.
第7章 市場機會與未來展望
According to Mordor Intelligence, the next-generation storage market size is expected to increase from USD 71.26 billion in 2025 to USD 75.30 billion in 2026 and reach USD 96.55 billion by 2031, growing at a CAGR of 5.10% over 2026-2031.
This report is Segmented by Storage System (Direct Attached Storage, Network Attached Storage, and Storage Area Network), Storage Architecture (File and Object-Based Storage, and Block Storage), End-User Industry (BFSI, Retail, IT and Telecom, and More), Deployment Model (On-Premises, Cloud, and Hybrid), and Geography. The Market Forecasts are Provided in Terms of Value (USD).
Global Next-generation Storage Market Trends and Insights
Rapid AI-Driven Demand for Enterprise SSDs
Generative AI training has turned storage throughput into a competitive differentiator, shrinking refresh cycles from five to three years as hyperscalers adopt all-flash clusters that deliver millions of random read IOPS. Enterprise SSD bit shipments surged 42% year-over-year in 2Q 2025, with Samsung's PM9E1 and Micron's 6550 ION surpassing 2 million IOPS in a single drive, enabling one server to replace multiple legacy nodes. Cloud operators now dictate the design of roadmaps, pushing vendors toward higher layer counts and lower power consumption per terabyte, which raises the total available market for next-generation storage.
Expansion Of Scale-Out NAS In Hybrid Clouds
Enterprises consolidating departmental filers onto distributed clusters that automatically tier cold data to public-cloud object stores are fueling double-digit growth in Network Attached Storage. NetApp's all-flash NAS revenue climbed 28% in fiscal 3Q 2025, while Dell's PowerScale added native S3 support, allowing the same namespace to span on-premises flash and cloud buckets. By eliminating gateways and manual migrations, scale-out NAS reduces administrative overhead and accelerates data mobility, thereby increasing its market share in the next-generation storage market.
Persistent Supply-Chain Volatility For NAND Flash
Geopolitical frictions are causing erratic NAND pricing, with contract rates rising 18% in 1H 2025 before falling 8% in 3Q as new South Korean capacity came online. Vendor gross margins compress when hedging at elevated spot levels, prompting some customers to extend hybrid deployments that combine SSDs with hard-disk drives, thereby delaying the full adoption of next-generation storage architectures.
Other drivers and restraints analyzed in the detailed report include:
- Regulatory Push For Sovereign Data-Residency Storage
- 5G-Enabled Edge Storage
- Data-Security Breaches In Cloud Services
For complete list of drivers and restraints, kindly check the Table Of Contents.
Segment Analysis
Network Attached Storage captured a 41.40% slice of the next-generation storage market share in 2025 and is forecast to climb at an 11.50% CAGR to 2031. The aggressive adoption of scale-out file clusters, which sustain petabyte-scale namespaces for AI training footage, media libraries, and genomics repositories, underpins this growth. Direct-Attached Storage is fading as converged infrastructure allows for pooled capacity, while Storage Area Networks remain relevant for deterministic latency in core banking and airline systems, yet they grow at only 3.2% annually.
The shift reflects the dominance of unstructured data, now accounting for more than 80% of generated bits, which naturally aligns with NAS protocols that permit billions of files in a single namespace. Vendors such as Qumulo report media customers writing 100 GB/s sustained to petabyte clusters, while NetApp's ONTAP now includes autonomous ransomware detection that snapshots anomalous activity within seconds. Security plus scalability accelerates NAS encroachment into workloads once reserved for object storage, reinforcing the ascendancy of NAS within the next-generation storage market.
File and object-based systems controlled 57.80% of revenue in 2025, yet block arrays are on track for a 9.46% CAGR through 2031, reflecting renewed interest in ultra-low latency. SAP HANA, Oracle Exadata, and container persistent volumes rely on atomic writes, which file semantics cannot guarantee, prompting enterprises to adopt NVMe-over-Fabrics arrays that deliver 10 times the throughput of legacy Fibre Channel. Consequently, block arrays are reclaiming relevance for stateful microservices and in-memory analytics, expanding their slice of the next-generation storage market in transactional contexts.
Capacity-oriented archives still favor file and object platforms that deliver exabyte scalability at one-tenth the cost per terabyte. Cloudian claims average customer deployments exceed 5 PB, while Scality's ARTESCA collapses multi-petabyte repositories into a single namespace with sub-second metadata lookups. This bifurcation leaves little room for hybrid architectures, positioning block storage for performance workloads and file storage for capacity, each integral to the broader next-generation storage market.
Complete Report Scope:
- By Storage System
- Direct Attached Storage (DAS)
- Network Attached Storage (NAS)
- Storage Area Network (SAN)
- By Storage Architecture
- File and Object-Based Storage (FOBS)
- Block Storage
- By End-User Industry
- BFSI
- Retail
- IT and Telecom
- Healthcare
- Media and Entertainment
- By Deployment Model
- On-Premises
- Cloud
- Hybrid
- By Geography
- North America
- United States
- Canada
- Mexico
- Europe
- Germany
- United Kingdom
- France
- Italy
- Spain
- Russia
- Rest of Europe
- Asia-Pacific
- China
- Japan
- India
- South Korea
- Australia
- Rest of Asia-Pacific
- Middle East
- Saudi Arabia
- United Arab Emirates
- Turkey
- Rest of Middle East
- Africa
- South Africa
- Nigeria
- Rest of Africa
- South America
- Brazil
- Argentina
- Rest of South America
- North America
Geography Analysis
North America held 37.46% of 2025 revenue, reflecting dense hyperscale footprints in Virginia, Texas, Oregon and Iowa. Spending tilts toward performance upgrades like Frontier's 700 PB all-flash supercomputer in Tennessee. Canada's data-residency rules spurred AWS to add a Calgary region in 2025, while Mexico's nearshoring boom fuels edge deployments.
Europe fragments along sovereignty lines as the Digital Operational Resilience Act enforces EU-resident replicas, prompting Oracle and AWS to open Europe-only regions. Germany's cybersecurity agency recommends on-premises arrays for classified workloads, slowing cloud migration, whereas post-Brexit United Kingdom institutions leverage U.S. regions for cost advantage.
Africa is the standout, predicted to grow at 14.10% CAGR to 2031. Microsoft Azure's Kenya launch and Google Cloud's forthcoming Lagos region satisfy in-country data mandates, catalyzing local adoption. Parallel momentum in the Middle East and South America rounds out the regional mosaic that sustains the next-generation storage market.
- Dell Technologies Inc.
- Hewlett Packard Enterprise Company
- NetApp, Inc.
- Hitachi Vantara LLC
- International Business Machines Corporation (IBM)
- Toshiba Corporation
- Pure Storage, Inc.
- DataDirect Networks, Inc.
- Scality SA
- Fujitsu Limited
- NETGEAR, Inc.
- Huawei Technologies Co., Ltd.
- Western Digital Corporation
- Samsung Electronics Co., Ltd.
- Micron Technology, Inc.
- Seagate Technology Holdings plc
- Synology Inc.
- QNAP Systems, Inc.
- Buffalo Inc.
- Qumulo, Inc.
- Cloudian, Inc.
Additional Benefits:
- The market estimate (ME) sheet in Excel format
- 3 months of analyst support
TABLE OF CONTENTS
1 INTRODUCTION
- 1.1 Study Assumptions and Market Definition
- 1.2 Scope of the Study
2 RESEARCH METHODOLOGY
3 EXECUTIVE SUMMARY
4 MARKET LANDSCAPE
- 4.1 Market Overview
- 4.2 Market Drivers
- 4.2.1 Increasing Volume of Digital Data
- 4.2.2 Rising Adoption of Solid-State Devices
- 4.2.3 Rapid AI-Driven Demand for Enterprise SSDs
- 4.2.4 5G-Enabled Edge Storage
- 4.2.5 Expansion of Scale-Out NAS in Hybrid Clouds
- 4.2.6 Regulatory Push for Sovereign Data-Residency Storage
- 4.3 Market Restraints
- 4.3.1 Data-Security Breaches in Cloud Services
- 4.3.2 Persistent Supply-Chain Volatility for NAND Flash
- 4.3.3 Talent Shortage in Storage-Centric DevOps
- 4.3.4 High Up-Front Capex for All-Flash Arrays
- 4.4 Industry Value Chain Analysis
- 4.5 Regulatory Landscape
- 4.6 Technological Outlook
- 4.7 Impact of Macroeconomic Factors
- 4.8 Porter's Five Forces Analysis
- 4.8.1 Threat of New Entrants
- 4.8.2 Bargaining Power of Suppliers
- 4.8.3 Bargaining Power of Buyers
- 4.8.4 Threat of Substitutes
- 4.8.5 Competitive Rivalry
5 MARKET SIZE AND GROWTH FORECASTS (VALUE)
- 5.1 By Storage System
- 5.1.1 Direct Attached Storage (DAS)
- 5.1.2 Network Attached Storage (NAS)
- 5.1.3 Storage Area Network (SAN)
- 5.2 By Storage Architecture
- 5.2.1 File and Object-Based Storage (FOBS)
- 5.2.2 Block Storage
- 5.3 By End-User Industry
- 5.3.1 BFSI
- 5.3.2 Retail
- 5.3.3 IT and Telecom
- 5.3.4 Healthcare
- 5.3.5 Media and Entertainment
- 5.4 By Deployment Model
- 5.4.1 On-Premises
- 5.4.2 Cloud
- 5.4.3 Hybrid
- 5.5 By Geography
- 5.5.1 North America
- 5.5.1.1 United States
- 5.5.1.2 Canada
- 5.5.1.3 Mexico
- 5.5.2 Europe
- 5.5.2.1 Germany
- 5.5.2.2 United Kingdom
- 5.5.2.3 France
- 5.5.2.4 Italy
- 5.5.2.5 Spain
- 5.5.2.6 Russia
- 5.5.2.7 Rest of Europe
- 5.5.3 Asia-Pacific
- 5.5.3.1 China
- 5.5.3.2 Japan
- 5.5.3.3 India
- 5.5.3.4 South Korea
- 5.5.3.5 Australia
- 5.5.3.6 Rest of Asia-Pacific
- 5.5.4 Middle East
- 5.5.4.1 Saudi Arabia
- 5.5.4.2 United Arab Emirates
- 5.5.4.3 Turkey
- 5.5.4.4 Rest of Middle East
- 5.5.5 Africa
- 5.5.5.1 South Africa
- 5.5.5.2 Nigeria
- 5.5.5.3 Rest of Africa
- 5.5.6 South America
- 5.5.6.1 Brazil
- 5.5.6.2 Argentina
- 5.5.6.3 Rest of South America
- 5.5.1 North America
6 COMPETITIVE LANDSCAPE
- 6.1 Market Concentration
- 6.2 Strategic Moves
- 6.3 Market Share Analysis
- 6.4 Company Profiles (includes Global level Overview, Market level overview, Core Segments, Financials as available, Strategic Information, Market Rank/Share for key companies, Products and Services, and Recent Developments)
- 6.4.1 Dell Technologies Inc.
- 6.4.2 Hewlett Packard Enterprise Company
- 6.4.3 NetApp, Inc.
- 6.4.4 Hitachi Vantara LLC
- 6.4.5 International Business Machines Corporation (IBM)
- 6.4.6 Toshiba Corporation
- 6.4.7 Pure Storage, Inc.
- 6.4.8 DataDirect Networks, Inc.
- 6.4.9 Scality SA
- 6.4.10 Fujitsu Limited
- 6.4.11 NETGEAR, Inc.
- 6.4.12 Huawei Technologies Co., Ltd.
- 6.4.13 Western Digital Corporation
- 6.4.14 Samsung Electronics Co., Ltd.
- 6.4.15 Micron Technology, Inc.
- 6.4.16 Seagate Technology Holdings plc
- 6.4.17 Synology Inc.
- 6.4.18 QNAP Systems, Inc.
- 6.4.19 Buffalo Inc.
- 6.4.20 Qumulo, Inc.
- 6.4.21 Cloudian, Inc.
7 MARKET OPPORTUNITIES AND FUTURE OUTLOOK
- 7.1 White-Space and Unmet-Need Assessment

 下一代資料儲存市場:全球預測,2026-2032年
 歐洲下一代儲存:市場佔有率分析、行業趨勢和統計數據以及成長預測(2026-2031 年)
 全球新一代資料儲存市場(至 2032 年):按儲存系統(直接附加儲存、網路附加儲存)、儲存媒體(硬碟、固態磁碟機)和儲存架構(基於檔案的儲存、基於物件的儲存)分類
 下一代資料儲存市場:按類型、架構、儲存媒體、部署模式、產業和地區分類
 2026-2030年全球人工智慧最佳化儲存市場
 2026年全球天基資料記錄市場報告2026年全球下一代資料儲存市場報告
 全像資料儲存市場機會、成長要素、產業趨勢分析及2026-2035年預測
 新一代資料儲存市場:依儲存類型(DAS、NAS、SAN)、儲存媒體、架構、最終用戶(銀行、金融服務和保險(BFSI)、零售、醫療保健、製造業、政府、IT 和電信、其他最終用戶)和地區劃分 - 至2027年的全球預測
 新一代資料儲存技術市場-全球產業規模、佔有率、趨勢、機會與預測:按類型、解決方案、記憶體、地區和競爭格局分類,2021-2031年