


 |
市場調查報告書
商品編碼
2120327
發電機組:市場佔有率分析、產業趨勢與統計、成長預測(2026-2031)Generator Sets - Market Share Analysis, Industry Trends & Statistics, Growth Forecasts (2026 - 2031) |
||||||

※ 本網頁內容可能與最新版本有所差異。詳細情況請與我們聯繫。
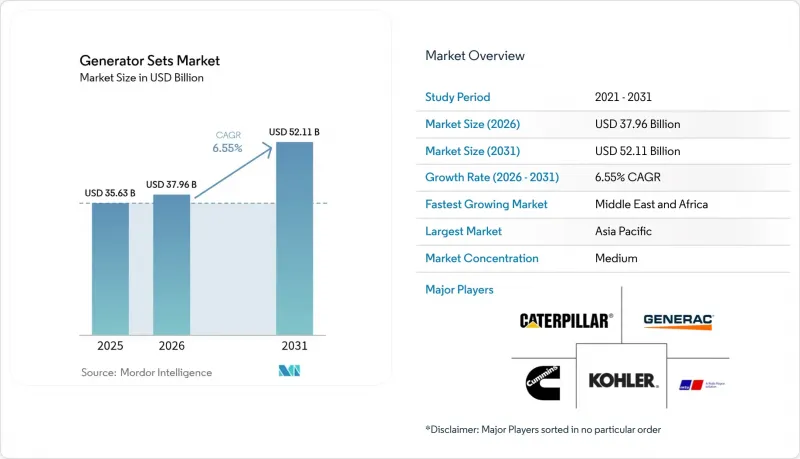
據 Mordor Intelligence 稱,2025 年發電機組市值為 356.3 億美元,預計到 2031 年將達到 521.1 億美元,而 2026 年為 379.6 億美元,預測期(2026-2031 年)的複合年成長率為 6.55%。
本報告按容量(小於 75 千伏安、75-375 千伏安、375-750 千伏安及其他)、燃料類型(柴油、天然氣、雙燃料和混合動力及其他)、應用(備用電源、一次/連續電源、微電網和混合支援等)、最終用戶(住宅、工業/製造業、北美資料中心等)和地區分類業(中東地區和非洲地區。
全球發電機組市場趨勢及洞察
新興經濟體電網可靠性問題
發展中地區頻繁的停電迫使企業繼續使用發電機組作為主要和備用電源。儘管奈及利亞2024年的發電高峰達到6003兆瓦,但長期的電力供不應求迫使許多中型工廠每天運作75-375千伏安的柴油發電機數小時。東南亞、拉丁美洲和撒哈拉以南非洲部分地區也普遍存在類似的電力不穩定問題,意外停機造成的生產損失超過了燃料和維護成本。由於柴油發電機組擁有更完善的服務網路、更充足的零件供應和更熟悉的操作流程,可靠性問題仍佔據發電機組市場的核心地位。同時,對電能品質的擔憂促使企業引入數位化監控和預測性維護模組,以提高現有發電機組的運轉率。
全球資料中心的建設正在迅速成長。
超大規模平台、託管服務供應商和自主雲端專案正在大力投資建置100%運轉率的基礎設施。 ABB指出,即使幾分鐘的電網中斷也會對波動性較大的人工智慧工作負載產生負面影響,因此備用電源成為關鍵的設計要求。為此,工程、採購和施工(EPC)公司正在提供超過2000千伏安的多模組設計,這些設計可以無縫並行運行並快速調整輸出。賓州一個4.5吉瓦的天然氣項目,其輸出規模經過專門設計,以滿足面向未來的資料中心超大規模站點的需求。 Generac等供應商已於2025年初將專為這些園區設計的氫動力發電機組推向市場。這一趨勢正在加速採購週期,增加大容量機組的銷量,並推動對排放氣體後處理技術的新投資,以滿足永續性評估標準。
柴油價格波動與燃料供應風險
預計2024年美國柴油平均批發價格將在每加侖3.30美元至4.05美元之間波動,並在2025年穩定在每加侖3.61美元。對於工業主電源用戶而言,燃料成本佔生命週期成本的70%之多,因此價格和供應波動會直接影響營運成本(OPEX)。偏遠礦區和島嶼電網最為脆弱,因為運輸中斷和煉油廠停產可能導致持續數週的供不應求。因此,終端用戶正在加快天然氣管道、液化石油氣(LPG)改造或放電時間為一小時的固定式電池組的可行性研究。雖然柴油仍然具有物流優勢,但採購模式越來越傾向於能夠提供燃料期貨合約和雙燃料轉換套件的供應商,這些方案可以幫助用戶對沖價格波動風險。
細分市場分析
預計到2025年,75-375 kVA發電機組市場規模將達139.3億美元,佔全球整體銷售額的39.10%。該產品系列因其均衡的功率輸出和經濟實惠的價格,在商業辦公室、中小企業和邊緣資料中心等領域廣受歡迎。儘管市場仍在成長,但隨著現有設備的逐步老化,中國和巴西等國的成長速度有所放緩。
預計到2031年,375–750 kVA 機型的複合年成長率將達到8.95%,主要得益於中型工廠和高性能建築對高密度暖通空調(HVAC)和物聯網控制負荷的廣泛應用。製造商正積極響應這項需求,推出智慧並聯運作套件和符合Tier 4F排放標準的產品,以滿足城市空氣品質法規的要求。更大功率的發電機組具有優異的瞬態響應性能,適用於電梯集群和半導體製造設備。更高頻寬(750–2000 kVA 以上)的發電機組則應用於超大規模資料中心、液化天然氣(LNG)液化廠以及電力公司的尖峰用電調節設備。Caterpillar在印第安納州投資7.25億美元進行擴建,旨在提升其大型引擎的產能,從而在發電機組市場這一高價值細分領域佔有一席之地。
到2025年,柴油引擎將佔全球銷量的70.85%。這主要歸功於其無可比擬的能量密度、物流和服務網路優勢。在符合監管豁免條件的地區礦山和建築工地,仍將繼續指定使用Tier 2或Tier 3排放標準的引擎。
然而,隨著企業在努力實現ESG目標的同時又不犧牲信譽,雙燃料和混合動力系統的複合年成長率(CAGR)達到了10.2%,遠高於5.29%的基準。天然氣發電機組正受益於穩定的管道天然氣供應,而氫氣混合套件則為園區實現淨零排放承諾奠定了基礎。三菱、道依茨和Generac都已發布了氫能就緒藍圖,顯示發電機組市場燃料結構的轉變勢在必行。生物柴油和可再生合成燃料被歸類為“其他”,但正獲得歐洲ReFuelEU框架的政策支持。
區域分析
到2025年,亞太地區將佔全球銷售額的36.65%。中國沿海省份的工廠設備現代化進程正在加速,印度的生產連結獎勵計畫計畫(PLI)正在打造標配兩台250千伏安柴油發電機的生產叢集,以確保72小時的故障容錯能力。東南亞國協的建設熱潮推動了對租賃設備的需求,而韓國和日本的醫院園區正在測試氫燃料混合燃料。
中東和非洲地區以9.35%的複合年成長率呈現最高成長率。海灣合作理事會(GCC)國家向鋁業、資料中心和綠色氫能領域的多元化發展,推動了備用和主用發電設施的部署。該地區的電力需求在2020年至2030年間可能激增29%至37%。儘管奈及利亞電力行業的銷售額在2024年成長了70%,但由於供不應求,工廠仍依賴私人發電設施。
在北美,穩定的設備更新周期與維吉尼亞和德克薩斯州資料中心樞紐預計出現的尖峰時段需求成長相吻合。由於歐洲第五階段排放法規的推進,市場重點正轉向天然氣和氫氣混合燃料。同時,在南美,礦用卡車、港口擴建以及供不應求。因此,發電機組市場呈現出地域分佈均衡的格局,從而降低了經濟波動風險。
其他好處:
- Excel格式的市場預測(ME)表
- 3個月的分析師支持
目錄
第1章:引言
- 調查範圍
- 市場定義與研究假設
第2章:調查方法
第3章執行摘要
第4章 市場狀況
- 市場概覽
- 市場促進因素
- 對新興國家電網可靠性的擔憂
- 全球資料中心建設正在蓬勃發展。
- 快速的工業化和建設活動
- 離網通訊塔的電氣化缺口
- 對微電網和混合系統整合的需求
- 氫燃料相容型雙燃料發電機正變得越來越普及。
- 市場限制因素
- 柴油價格波動與燃料供應風險
- 對固定式引擎實施更嚴格的排放氣體法規
- 擴大儲能電池替代技術的應用
- 由於與脫碳相關的投資週期,資本投資停滯不前。
- 供應鏈分析
- 監理情勢
- 技術展望
- 波特五力分析
第5章 市場規模與成長預測
- 按產能
- 小於75千伏安
- 75~375 kVA
- 375~750 kVA
- 750~2,000 kVA
- 2000千伏安或以上
- 按燃料類型
- 柴油引擎
- 天然氣
- 雙燃料和混合動力
- 可再生能源/生質燃料
- 其他
- 透過使用
- 待機電源
- 主電源/持續電源
- 尖峰用電調節
- 租賃/臨時電源
- 支援微電網和混合電網
- 最終用戶
- 住宅
- 商業建築
- 工業和製造業
- 資料中心
- 醫療機構
- 石油和天然氣
- 公共產業與電力
- 採礦和建設業
- 按地區
- 北美洲
- 美國
- 加拿大
- 墨西哥
- 歐洲
- 德國
- 英國
- 法國
- 義大利
- 北歐國家
- 俄羅斯
- 其他歐洲國家
- 亞太地區
- 中國
- 印度
- 日本
- 韓國
- 東南亞國協
- 其他亞太國家
- 南美洲
- 巴西
- 阿根廷
- 其他南美國家
- 中東和非洲
- 沙烏地阿拉伯
- 阿拉伯聯合大公國
- 南非
- 埃及
- 其他中東和非洲國家
- 北美洲
第6章 競爭情勢
- 市場集中度
- 策略趨勢(併購、聯盟、購電協議)
- 市場佔有率分析(主要公司的市場排名和佔有率)
- 公司簡介
- Caterpillar Inc.
- Cummins Inc.
- Generac Power Systems
- Kohler Co.
- Rolls-Royce Power Systems(MTU)
- AKSA Power Generation
- Briggs & Stratton Corporation
- Doosan Corporation
- Mitsubishi Heavy Industries Ltd.
- Wartsila Corporation
- Perkins Engines Company Ltd.
- Atlas Copco AB
- FG Wilson(CAT)
- HIMOINSA SL
- Yanmar Holdings Co. Ltd.
- Honda India Power Products Ltd.
- Kirloskar Oil Engines Ltd.
- Mahindra Powerol
- JCB Power Products
- Siemens Energy AG
- Aggreko Plc
第7章 市場機會與未來展望
According to Mordor Intelligence, the generator sets market size was valued at USD 35.63 billion in 2025 and estimated to grow from USD 37.96 billion in 2026 to reach USD 52.11 billion by 2031, at a CAGR of 6.55% during the forecast period (2026-2031).
This report is Segmented by Capacity (Below 75 KVA, 75 To 375 KVA, 375 To 750 KVA, and More), Fuel Type (Diesel, Natural Gas, Dual-Fuel and Hybrid, and More), Application (Standby Power, Prime/Continuous Power, Micro-Grid and Hybrid Support, and More), End-User (Residential, Industrial and Manufacturing, Data Centers, and More), and Geography (North America, Asia-Pacific, Middle East and Africa, and More).
Global Generator Sets Market Trends and Insights
Grid-reliability concerns in emerging economies
Frequent outages in developing regions continue to compel businesses to treat generator sets as primary and standby assets. Nigeria's peak generation touched 6,003 MW in 2024, yet persistent supply gaps required most mid-size factories to keep 75-375 kVA diesels running for several hours each day. Similar instability pervades parts of Southeast Asia, Latin America, and Sub-Saharan Africa, where manufacturing losses during unplanned downtime outweigh fuel and maintenance outlays. The reliability driver keeps the generator sets market firmly anchored in diesel because service networks, parts availability, and operator familiarity remain strongest for that fuel class. At the same time, power-quality worries are prompting enterprises to embed digital monitoring and predictive-maintenance modules to squeeze higher uptime from installed fleets.
Surging data-center build-outs worldwide
Hyperscale platforms, colocation providers, and sovereign-cloud programs are spending aggressively on 100% uptime infrastructure. ABB notes that even single-digit-minute utility-grid outages jeopardize turbulent AI workloads, cementing backup generation as a design imperative. Engineering, Procurement & Construction firms have responded with multi-block, above-2000 kVA designs that can parallel seamlessly and ramp quickly. Pennsylvania's 4.5 GW natural-gas project specifically sized its output around future-proof data-center hypersites. Vendors such as Generac introduced purpose-built, hydrogen-capable gensets for these campuses in early 2025. The trend accelerates procurement cycles, lifting high-capacity unit volume and spurring fresh investment in emissions-aftertreatment to satisfy sustainability scorecards.
Volatile diesel prices and fuel supply risks
Average wholesale diesel in the United States is forecast at USD 3.61 per gallon in 2025 after swinging between USD 3.30 and USD 4.05 during 2024. Industrial prime-power users attribute up to 70% of lifecycle cost to fuel, so unreliability in price and delivery exerts direct pressure on OPEX. Remote mines and island grids are most exposed because shipping disruptions or refinery outages create multi-week shortages. End users are therefore accelerating feasibility studies on gas pipelines, LPG swaps, or stationary battery packs sized for one-hour discharge windows. While diesel retains logistical advantages, procurement patterns increasingly favor suppliers able to bundle forward-fuel contracts or dual-fuel conversion kits that hedge volatility.
Other drivers and restraints analyzed in the detailed report include:
- Rapid industrialisation and construction activities
- Electrification gaps in off-grid telecom towers
- Stricter emission norms for stationary engines
For complete list of drivers and restraints, kindly check the Table Of Contents.
Segment Analysis
The generator sets market size for 75-375 kVA reached USD 13.93 billion in 2025, equal to 39.10% of global revenue. Commercial offices, SMEs, and edge-data facilities prize this range for its balance of power and affordability. Growth continues but moderates as installed fleets mature in China and Brazil.
A sharper 8.95% CAGR through 2031 is predicted for 375-750 kVA units, driven by medium-scale factories and high-performance buildings adopting dense HVAC and IoT control loads. Manufacturers respond with smart paralleling kits and Tier 4F compliance to satisfy urban air-quality ordinances. Enlarged alternators offer transient response suitable for elevator banks and semiconductor tools. Larger bands-750-2000 kVA and above-2000 kVA-serve hyperscale data centers, LNG liquefaction, and utility peak-shaving islands. Caterpillar's USD 725 million Indiana expansion boosts large-engine throughput to capture that premium slice of the generator sets market.
Diesel commanded 70.85% of global revenue in 2025 because its energy density, logistics, and service footprint remain unmatched. Rural mining and construction sites continue to specify Tier 2 or Tier 3 engines where regulatory waivers exist.
Yet dual-fuel and hybrid systems log a 10.2% CAGR, far above the 5.29% base-line, as enterprises chase ESG targets without sacrificing reliability. Natural-gas sets exploit stable pipeline tariffs, while hydrogen-blend kits position campuses for net-zero pledges. Mitsubishi, DEUTZ, and Generac have public hydrogen-ready roadmaps, signaling an inevitable mix shift inside the generator sets market. Bio-diesel and renewable synthetic fuels appear under the "Others" banner but gain policy support in Europe's ReFuelEU framework.
Complete Report Scope:
- By Capacity
- Below 75 kVA
- 75 to 375 kVA
- 375 to 750 kVA
- 750 to 2,000 kVA
- Above 2,000 kVA
- By Fuel Type
- Diesel
- Natural Gas
- Dual-Fuel and Hybrid
- Renewable/Bio-fuel
- Others
- By Application
- Standby Power
- Prime/Continuous Power
- Peak-Shaving
- Rental/Temporary Power
- Micro-grid and Hybrid Support
- By End-User
- Residential
- Commercial Buildings
- Industrial and Manufacturing
- Data Centers
- Healthcare Facilities
- Oil and Gas
- Utilities and Power
- Mining and Construction
- By Geography
- North America
- United States
- Canada
- Mexico
- Europe
- Germany
- United Kingdom
- France
- Italy
- NORDIC Countries
- Russia
- Rest of Europe
- Asia-Pacific
- China
- India
- Japan
- South Korea
- ASEAN Countries
- Rest of Asia-Pacific
- South America
- Brazil
- Argentina
- Rest of South America
- Middle East and Africa
- Saudi Arabia
- United Arab Emirates
- South Africa
- Egypt
- Rest of Middle East and Africa
- North America
Geography Analysis
Asia-Pacific commanded 36.65% of global revenue in 2025. Chinese coastal provinces accelerate factory upgrades, and India's Production-Linked Incentives spawn clusters that standardize on twin 250 kVA diesel units for 72-hour resilience. ASEAN construction booms add rental fleet demand, while Korea and Japan test hydrogen blends in hospital campuses.
The Middle East and Africa deliver the fastest 9.35% CAGR. GCC diversification toward aluminum, data parks, and green hydrogen drives standby and prime installations. Regional electricity demand could jump 29-37% between 2020 and 2030. Nigerian power-sector revenue rose 70% in 2024, yet supply gaps keep factories on captive sets.
North America yields steady replacement cycles plus peak growth in data-center corridors of Virginia and Texas. Europe's Stage V landscape shifts focus to gas and H2 blends, while South America benefits from mining trucks, port expansion, and drought-driven hydro shortfalls triggering diesel rentals. The generator sets market therefore shows a balanced geographic portfolio, cushioning cyclical risk.
- Caterpillar Inc.
- Cummins Inc.
- Generac Power Systems
- Kohler Co.
- Rolls-Royce Power Systems (MTU)
- AKSA Power Generation
- Briggs & Stratton Corporation
- Doosan Corporation
- Mitsubishi Heavy Industries Ltd.
- Wartsila Corporation
- Perkins Engines Company Ltd.
- Atlas Copco AB
- FG Wilson (CAT)
- HIMOINSA S.L.
- Yanmar Holdings Co. Ltd.
- Honda India Power Products Ltd.
- Kirloskar Oil Engines Ltd.
- Mahindra Powerol
- JCB Power Products
- Siemens Energy AG
- Aggreko Plc
Additional Benefits:
- The market estimate (ME) sheet in Excel format
- 3 months of analyst support
TABLE OF CONTENTS
1 Introduction
- 1.1 Scope of the Study
- 1.2 Market Definition & Study Assumptions
2 Research Methodology
3 Executive Summary
4 Market Landscape
- 4.1 Market Overview
- 4.2 Market Drivers
- 4.2.1 Grid-reliability concerns in emerging economies
- 4.2.2 Surging data-center build-outs worldwide
- 4.2.3 Rapid industrialisation & construction activities
- 4.2.4 Electrification gaps in off-grid telecom towers
- 4.2.5 Micro-grid & hybrid system integration demand
- 4.2.6 Hydrogen-ready dual-fuel gensets gaining traction
- 4.3 Market Restraints
- 4.3.1 Volatile diesel prices & fuel supply risks
- 4.3.2 Stricter emission norms for stationary engines
- 4.3.3 Rising adoption of battery-storage alternatives
- 4.3.4 Cap-ex hesitation amid decarb-linked investment cycles
- 4.4 Supply-Chain Analysis
- 4.5 Regulatory Landscape
- 4.6 Technological Outlook
- 4.7 Porter's Five Forces Analysis
- 4.7.1 Bargaining Power of Suppliers
- 4.7.1.1 Bargaining Power of Consumers
- 4.7.1.2 Threat of New Entrants
- 4.7.1.3 Threat of Substitute Products & Services
- 4.7.1.4 Intensity of Competitive Rivalry
- 4.7.1 Bargaining Power of Suppliers
5 Market Size & Growth Forecasts
- 5.1 By Capacity
- 5.1.1 Below 75 kVA
- 5.1.2 75 to 375 kVA
- 5.1.3 375 to 750 kVA
- 5.1.4 750 to 2,000 kVA
- 5.1.5 Above 2,000 kVA
- 5.2 By Fuel Type
- 5.2.1 Diesel
- 5.2.2 Natural Gas
- 5.2.3 Dual-Fuel and Hybrid
- 5.2.4 Renewable/Bio-fuel
- 5.2.5 Others
- 5.3 By Application
- 5.3.1 Standby Power
- 5.3.2 Prime/Continuous Power
- 5.3.3 Peak-Shaving
- 5.3.4 Rental/Temporary Power
- 5.3.5 Micro-grid and Hybrid Support
- 5.4 By End-User
- 5.4.1 Residential
- 5.4.2 Commercial Buildings
- 5.4.3 Industrial and Manufacturing
- 5.4.4 Data Centers
- 5.4.5 Healthcare Facilities
- 5.4.6 Oil and Gas
- 5.4.7 Utilities and Power
- 5.4.8 Mining and Construction
- 5.5 By Geography
- 5.5.1 North America
- 5.5.1.1 United States
- 5.5.1.2 Canada
- 5.5.1.3 Mexico
- 5.5.2 Europe
- 5.5.2.1 Germany
- 5.5.2.2 United Kingdom
- 5.5.2.3 France
- 5.5.2.4 Italy
- 5.5.2.5 NORDIC Countries
- 5.5.2.6 Russia
- 5.5.2.7 Rest of Europe
- 5.5.3 Asia-Pacific
- 5.5.3.1 China
- 5.5.3.2 India
- 5.5.3.3 Japan
- 5.5.3.4 South Korea
- 5.5.3.5 ASEAN Countries
- 5.5.3.6 Rest of Asia-Pacific
- 5.5.4 South America
- 5.5.4.1 Brazil
- 5.5.4.2 Argentina
- 5.5.4.3 Rest of South America
- 5.5.5 Middle East and Africa
- 5.5.5.1 Saudi Arabia
- 5.5.5.2 United Arab Emirates
- 5.5.5.3 South Africa
- 5.5.5.4 Egypt
- 5.5.5.5 Rest of Middle East and Africa
- 5.5.1 North America
6 Competitive Landscape
- 6.1 Market Concentration
- 6.2 Strategic Moves (M&A, Partnerships, PPAs)
- 6.3 Market Share Analysis (Market Rank/Share for key companies)
- 6.4 Company Profiles (includes Global level Overview, Market level overview, Core Segments, Financials as available, Strategic Information, Products & Services, and Recent Developments)
- 6.4.1 Caterpillar Inc.
- 6.4.2 Cummins Inc.
- 6.4.3 Generac Power Systems
- 6.4.4 Kohler Co.
- 6.4.5 Rolls-Royce Power Systems (MTU)
- 6.4.6 AKSA Power Generation
- 6.4.7 Briggs & Stratton Corporation
- 6.4.8 Doosan Corporation
- 6.4.9 Mitsubishi Heavy Industries Ltd.
- 6.4.10 Wartsila Corporation
- 6.4.11 Perkins Engines Company Ltd.
- 6.4.12 Atlas Copco AB
- 6.4.13 FG Wilson (CAT)
- 6.4.14 HIMOINSA S.L.
- 6.4.15 Yanmar Holdings Co. Ltd.
- 6.4.16 Honda India Power Products Ltd.
- 6.4.17 Kirloskar Oil Engines Ltd.
- 6.4.18 Mahindra Powerol
- 6.4.19 JCB Power Products
- 6.4.20 Siemens Energy AG
- 6.4.21 Aggreko Plc
7 Market Opportunities & Future Outlook
- 7.1 White-space & Unmet-Need Assessment

 北美發電機組:市場佔有率分析、行業趨勢和統計數據、成長預測(2026-2031 年)
 發電機組市場:按燃料類型、輸出功率、應用領域、國家和地區分類-產業分析、市場規模、市場佔有率和預測(2026-2033 年)
 尖峰用電調節市場預測至2034年-按控制策略、技術、應用、最終用戶和地區分類的全球分析
 發電機組市場規模、佔有率和成長分析:額定功率、燃料類型、應用、最終用戶和地區分類-2026-2033年產業預測商用發電機:市場佔有率分析、產業趨勢與統計、成長預測(2026-2031 年)
 商用發電機市場 - 全球產業規模、佔有率、趨勢、機會、預測:按燃料、便攜性、功率輸出、應用、地區和競爭格局分類,2021-2031年
 全球發電機組市場
 發電機組市場:依燃料類型、型號、相數、額定輸出功率及最終用戶分類-2026-2032年全球市場預測防水發電機組市場:依燃料類型、額定功率、應用、便攜性、相數、冷卻方式和機殼類型分類,全球預測,2026-2032年
 尖峰用電調節發電機組市場:商業機會、成長要素、產業趨勢分析及2026-2035年預測