


 |
市場調查報告書
商品編碼
2097327
商用發電機:市場佔有率分析、產業趨勢與統計、成長預測(2026-2031 年)Commercial Genset - Market Share Analysis, Industry Trends & Statistics, Growth Forecasts (2026 - 2031) |
||||||

※ 本網頁內容可能與最新版本有所差異。詳細情況請與我們聯繫。
據 Mordor Intelligence 稱,商用發電機市場預計將從 2025 年的 132.6 億美元和 2026 年的 143.8 億美元成長到 2031 年的 212 億美元,2026 年至 2031 年的複合年成長率為 8.07%。
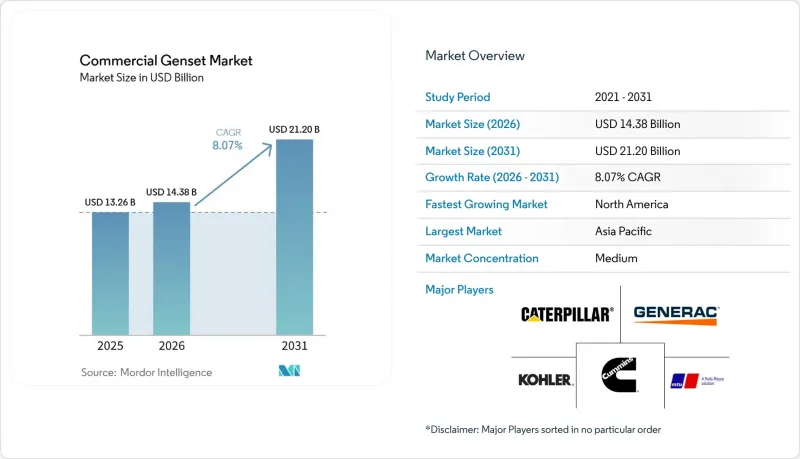
本報告按燃料類型(柴油、天然氣、雙燃料和混合動力、其他)、額定功率(小於 75 kVA、75 kVA 及以上)、應用(備用電源、主電源/持續電源、其他)、終端用戶行業(商業建築、資料中心、其他)和地區(北美、歐洲、亞太、南美、中東和非洲)細分。市場預測以美元計價。
全球商用發電機市場趨勢與洞察
超大規模和邊緣資料中心的激增
PJM和ERCOT併網的平均等待時間約為八年,這促使營運商選擇在本地部署約10-12吉瓦的電力,而不是等待新的輸電基礎設施建設。在印度,資料中心的裝置容量正從2025年第二季的1.4吉瓦成長,並計畫在2030年達到4-10吉瓦,這得益於對新建超大規模資料中心業者400億美元的投資。 Atlas Energy斥資8.4億美元訂購1.4吉瓦的CaterpillarCG260-16和G3520天然氣發電機組,這清楚地表明,印度正在進行大規模、兆瓦級的「表後」電力採購,旨在解決電網瓶頸問題。
美國陽光地帶和歐盟快速發展的商業房地產正面臨電網限制。
預計到2025年,ERCOT的併網申請等候名單將達到226吉瓦,其中資料中心約佔待處理申請的四分之三。電網升級預計需要7到10年才能完成。奧斯汀、達拉斯、鳳凰城和坦帕等城市的開發商正在新建項目中安裝主發電機,而德國的辦公大樓則正在安裝持續運作的發電機,以應對太陽能和風能發電量減少的時期(稱為「Dunkelfraute」)。
商用電池價格暴跌
預計到 2025 年,磷酸鋰鐵鋰電池組的平均價格將降至每千瓦時 98 美元,比前一年下降 31%,到 2028 年將進一步降至每千瓦時 72 美元。目前,資料中心在斷電後的前 30 分鐘使用電池供電,而將發電機用於更長的斷電,從而減少 15-25% 的柴油消耗。
細分市場分析
預計到2025年,天然氣將以11.4%的複合年成長率成長,而柴油則佔商業發電市場的63.1%。推動這一轉變的原因是因為營運商希望避免Tier 4-Final後後處理系統相關的成本。Caterpillar與Atlas Energy簽訂的1.4吉瓦合約凸顯了這項轉型,而氫燃料混合引擎則為長期脫碳提供了一條潛在途徑。然而,液化天然氣指數的波動以及預計2027年的價格上漲,使得買家的燃料避險策略變得複雜。
柴油在快速啟動備用電源應用中仍然發揮著至關重要的作用,尤其是在天然氣管道接入受限的醫院和其他生命安全設施中。供應商透過提供模組化選擇性催化還原(SCR)套件來降低合規成本,這些套件可確保與生物柴油相容。此外,針對印尼和奈及利亞等地區通訊基地台最佳化的柴油-電池混合動力系統整合了自動負載追蹤功能,從而提高了引擎效率,最大限度地減少了怠速排放氣體,並延長了維護週期。
預計容量超過 750 kVA 的發電機組將以 10.1% 的複合年成長率成長,這主要得益於需要 N+1 冗餘的多兆瓦資料中心設施的需求。 Atlas Energy 迄今為止最大的 4.5 MW訂單訂單表明,市場對可擴展至 100 MW 的貨櫃式模組的需求正在成長。
預計到2025年,75-750千伏安中等容量發電機組將佔據49.7%的市場佔有率,繼續保持其銷售領先地位。此細分市場主要面向辦公園區、飯店和診所等場所,這些場所越來越需要遵守類似最低能源效率標準(MEES)的更嚴格的能源效率標準。同時,75千伏安以下的可攜式發電機組面臨來自電池供電替代方案的競爭。然而,隨著5G網路在非洲農村地區的擴展,由於電網運轉率維持在65%左右,20-50千瓦的發電機組仍有需求。
區域分析
預計到2025年,亞太地區將佔據商用發電機市場45.2%的佔有率,成為最大市場。這項成長主要得益於印度伺服器叢集的擴張,而印度伺服器叢集的擴張又受到沿岸地區AWS服務中斷的影響,以及超大規模資料中心業者資料中心400億美元的資本投資。這推動了那格浦爾和齋浦爾等二線城市的需求。此外,中國原始設備製造商(OEM)正在擴大其在中端市場的佔有率。在東南亞,5G網路正在快速擴張,由於電網擴建成本有時高達每公里5萬美元,30千瓦至250千瓦功率範圍的發電機訂單持續成長。
預計北美將呈現最高成長率,到2031年複合年成長率將達到9.1%。陽光地帶的電網限制正在推動對主用發電機組的強勁需求。例如,ERCOT(德州電力可靠性委員會)226吉瓦的專案待建清單以及鳳凰城12%的年負載成長凸顯了結構性供不應求,促使人工智慧晶圓廠和半導體製造廠部署兆瓦級天然氣發電廠。在加拿大,聯邦政府的獎勵正在加速氫能發電的維修;而在墨西哥,一項200億美元的近岸外包舉措正在蒙特雷工業園區創造對1000千伏安發電機組的需求。
在歐洲,如何平衡可再生能源的高普及率與「日落電力短缺」(Dunkelfraute)的風險,是亟待解決的問題。在德國,辦公大樓正在將燃氣引擎整合到建築規模的微電網中。在英國,業主們正根據「最低能源效率標準(MEES)」進行維修,這些標準通常包括備用發電機,以支援暖通空調系統的電氣化,而無需對電網進行擴容。斯堪的納維亞半島的礦場正在試驗使用100%氫動力裝置,而巴黎和米蘭的噪音法規已將低噪音座艙罩列為標準配備。
其他好處:
- Excel格式的市場預測(ME)表
- 3個月的分析師支持
目錄
第1章:引言
- 研究假設和市場定義
- 調查範圍
第2章:調查方法
第3章執行摘要
第4章 市場狀況
- 市場概覽
- 市場促進因素
- 超大規模和邊緣資料中心的激增
- 美國陽光地帶和歐盟地區「電網約束型」商業房地產快速擴張
- 根據 Tier 4-Final 和 Euro Stage V 法規,從柴油過渡到汽油。
- 亞太地區和非洲的5G網路密度
- 引進氫能相容型和混合動力發電機(柴油、電池和太陽能)。
- 透過人工智慧驅動的預測性維護降低總體擁有成本 (TCO)。
- 市場限制因素
- 商用電池價格暴跌
- 加強城市待機設備噪音管制
- 自2024年起,液化天然氣和管道天然氣價格波動性將加劇。
- 綠色租賃條款的日益普及正在遏制場地內石化燃料的使用。
- 供應鏈分析
- 監理情勢
- 技術展望
- 波特五力分析
第5章 市場規模與成長預測
- 按燃料類型
- 柴油引擎
- 天然氣
- 雙燃料和混合動力
- 其他(可再生能源/生質燃料、液化石油氣、氫動力汽車等)
- 額定功率
- 小於75千伏安
- 75~750 kVA
- 750千伏安或以上
- 透過使用
- 待機電源
- 主電源/持續電源
- 尖峰用電調節
- 租賃/臨時電源
- 微電網和混合電網相容
- 按最終用戶行業分類
- 商業大樓(辦公大樓、零售商店、購物中心)
- 資料中心
- 醫療機構
- 飯店及度假村
- 教育機構
- 通訊(塔台、邊緣接入點)
- 機場和交通樞紐
- 其他
- 按地區
- 北美洲
- 美國
- 加拿大
- 墨西哥
- 歐洲
- 德國
- 英國
- 法國
- 義大利
- 北歐國家
- 俄羅斯
- 其他歐洲國家
- 亞太地區
- 中國
- 印度
- 日本
- 韓國
- 東南亞國協
- 其他亞太國家
- 南美洲
- 巴西
- 阿根廷
- 其他南美國家
- 中東和非洲
- 沙烏地阿拉伯
- 阿拉伯聯合大公國
- 南非
- 埃及
- 其他中東和非洲國家
- 北美洲
第6章 競爭情勢
- 市場集中度
- 策略趨勢(併購、聯盟、購電協議)
- 市場佔有率分析(主要公司的市場排名和佔有率)
- 公司簡介
- Aggreko plc
- Atlas Copco AB
- Blue Star Power Systems, Inc.
- Briggs & Stratton Corporation
- Caterpillar Inc.
- Cummins Inc.
- Deutz AG(Power Solutions Division)
- Doosan Portable Power
- FG Wilson
- Generac Holdings Inc.
- GE Vernova Inc.
- Honda Motor Co., Ltd.
- Himoinsa SL
- Kirloskar Oil Engines Limited
- Kohler Co.
- Mahindra & Mahindra Limited
- Mitsubishi Heavy Industries, Ltd.
- Perkins Engines Company Limited
- Rolls-Royce Holdings plc(Rolls-Royce Power Systems/MTU)
- Wartsila Corporation
第7章 市場機會與未來展望
According to Mordor Intelligence, the commercial genset market is expected to grow from USD 13.26 billion in 2025 and USD 14.38 billion in 2026 to USD 21.20 billion by 2031, with a CAGR of 8.07% during the period from 2026 to 2031.
This report is Segmented by Fuel Type (Diesel, Natural Gas, Dual-Fuel and Hybrid, and Others), Power Rating (Below 75 KVA, and More), Application (Standby Power, Prime/Continuous Power, and More), End-User Industry (Commercial Buildings, Data Centers, and More), Geography (North America, Europe, Asia-Pacific, South America, and Middle East and Africa). Market Forecasts are Provided in Value (USD).
Global Commercial Genset Market Trends and Insights
Surge in Hyperscale & Edge Data-Centers
Queue delays at PJM and ERCOT average around eight years, leading operators to secure an estimated 10-12 GW of onsite generation rather than waiting for new transmission infrastructure. In India, the installed data center power capacity increased from 1.4 GW in Q2 2025, with a target of reaching 4-10 GW by 2030, supported by USD 40 billion in new hyperscaler investments. Atlas Energy's USD 840 million order for 1.4 GW of Caterpillar CG260-16 and G3520 natural gas units underscores substantial multi-megawatt behind-the-meter procurement aimed at addressing grid constraints.
Fast-Rising Grid-Constrained Commercial Real-Estate in the US Sun Belt & EU
ERCOT's interconnection queue is projected to reach 226 GW by 2025, with data centers accounting for approximately three-quarters of the backlog. Transmission upgrades are expected to take seven to ten years to complete. Developers in cities such as Austin, Dallas, Phoenix, and Tampa are incorporating prime-power gensets into new constructions, while German offices are installing continuous-duty machines to manage periods of reduced solar and wind energy generation, referred to as Dunkelflaute.
Rapid Fall in Commercial-Scale Battery Prices
Average lithium-iron-phosphate pack pricing decreased by 31% year-over-year to USD 98 per kWh in 2025 and is projected to decline further to USD 72 per kWh by 2028. Data centers now utilize batteries for the initial 30 minutes of outages, reserving gensets for prolonged events and reducing diesel consumption by 15-25%.
Other drivers and restraints analyzed in the detailed report include:
- Diesel-to-Gas Switch Driven by Tier 4-Final & Euro Stage V Norms
- Telecom 5G Densification in APAC & Africa
- Stricter Urban Noise Ordinances on Standby Units
For complete list of drivers and restraints, kindly check the Table Of Contents.
Segment Analysis
Natural gas is expected to grow at a compound annual growth rate (CAGR) of 11.4% by 2025, in contrast to diesel's 63.1% share of the commercial genset market. This shift is driven by operators aiming to avoid the expenses associated with Tier 4-Final after-treatment systems. Caterpillar's 1.4 GW Atlas Energy agreement underscores this transition, while hydrogen-blending engines offer a potential route for long-term decarbonization. However, fluctuating LNG indices and the anticipated price tightening in 2027 complicate fuel-hedging strategies for buyers.
Diesel continues to play a critical role in rapid-start standby applications, particularly in hospitals and other life-safety facilities where gas pipeline access is limited. Vendors are addressing compliance costs by offering modular selective catalytic reduction (SCR) kits and ensuring compatibility with bio-diesel. Additionally, hybrid diesel-battery systems, tailored for telecom sites in regions such as Indonesia and Nigeria, incorporate automated load-tracking to enhance engine efficiency, minimize idle emissions, and extend maintenance intervals.
Generator sets above 750 kVA are projected to grow at a CAGR of 10.1%, driven by the demand from multimegawatt data center facilities requiring N+1 redundancy. Atlas Energy's record order for 4.5 MW modules highlights the increasing preference for containerized blocks that can scale up to 100 MW farms.
The mid-range segment of 75-750 kVA is expected to maintain its position as the volume leader, accounting for 49.7% of the market share by 2025. This segment primarily caters to office parks, hotels, and clinics, which are increasingly required to comply with stricter efficiency mandates similar to MEES. Meanwhile, portable units below 75 kVA face competition from battery alternatives. However, rural African 5G network expansions continue to specify 20-50 kW gensets due to grid uptime remaining at approximately 65%.
Complete Report Scope:
- By Fuel Type
- Diesel
- Natural Gas
- Dual-Fuel and Hybrid
- Others (Renewable/Bio-fuel, LPG, Hydrogen-ready, etc.)
- By Power Rating
- Below 75 kVA
- 75 to 750 kVA
- Above 750 kVA
- By Application
- Standby Power
- Prime/Continuous Power
- Peak-Shaving
- Rental/Temporary Power
- Micro-grid and Hybrid Support
- By End-user Industry
- Commercial Buildings (Offices, Retail, Malls)
- Data Centers
- Healthcare Facilities
- Hospitality (Hotels & Resorts)
- Education Institutions
- Telecom (Towers, Edge POPs)
- Airports & Transportation Hubs
- Others
- By Geography
- North America
- United States
- Canada
- Mexico
- Europe
- Germany
- United Kingdom
- France
- Italy
- NORDIC Countries
- Russia
- Rest of Europe
- Asia-Pacific
- China
- India
- Japan
- South Korea
- ASEAN Countries
- Rest of Asia-Pacific
- South America
- Brazil
- Argentina
- Rest of South America
- Middle East and Africa
- Saudi Arabia
- United Arab Emirates
- South Africa
- Egypt
- Rest of Middle East and Africa
- North America
Geography Analysis
Asia-Pacific is projected to hold the largest share of the commercial genset market, accounting for 45.2% in 2025. The growth is driven by India's server-farm expansion, influenced by AWS outages in the Gulf and a USD 40 billion hyperscaler capital expenditure, which is increasing demand in Tier-II cities such as Nagpur and Jaipur. Additionally, Chinese OEMs are gaining traction in mid-tier segments. In Southeast Asia, 5G network expansions, where grid extension costs can reach USD 50,000 per kilometer, are sustaining orders for gensets in the 30 kW-250 kW range.
North America is expected to record the fastest compound annual growth rate (CAGR) at 9.1% through 2031. Grid constraints in the Sun Belt region are driving high demand for prime-duty gensets. For instance, ERCOT's 226 GW project queue and Phoenix's 12% annual load growth highlight structural undersupply, fueling the deployment of multi-megawatt natural gas stations for AI fabs and chip manufacturing plants. In Canada, federal incentives are promoting hydrogen-ready retrofits, while Mexico's USD 20 billion nearshoring initiatives are channeling demand for 1,000 kVA gensets in Monterrey's industrial parks.
Europe is managing its high renewable energy adoption alongside Dunkelflaute risks. In Germany, office buildings are incorporating gas engines into building-scale microgrids. In the United Kingdom, landlords are addressing Minimum Energy Efficiency Standards (MEES) upgrades, which often include backup gensets to support HVAC electrification without requiring grid reinforcement. Nordic mines pilot 100% hydrogen units, and acoustic rules in Paris and Milan make low-noise canopies standard accessories.
- Aggreko plc
- Atlas Copco AB
- Blue Star Power Systems, Inc.
- Briggs & Stratton Corporation
- Caterpillar Inc.
- Cummins Inc.
- Deutz AG (Power Solutions Division)
- Doosan Portable Power
- FG Wilson
- Generac Holdings Inc.
- GE Vernova Inc.
- Honda Motor Co., Ltd.
- Himoinsa S.L.
- Kirloskar Oil Engines Limited
- Kohler Co.
- Mahindra & Mahindra Limited
- Mitsubishi Heavy Industries, Ltd.
- Perkins Engines Company Limited
- Rolls-Royce Holdings plc (Rolls-Royce Power Systems / MTU)
- Wartsila Corporation
Additional Benefits:
- The market estimate (ME) sheet in Excel format
- 3 months of analyst support
TABLE OF CONTENTS
1 Introduction
- 1.1 Study Assumptions & Market Definition
- 1.2 Scope of the Study
2 Research Methodology
3 Executive Summary
4 Market Landscape
- 4.1 Market Overview
- 4.2 Market Drivers
- 4.2.1 Surge in hyperscale & edge data-centers
- 4.2.2 Fast-rising "grid-constrained" commercial real-estate in US Sun Belt & EU
- 4.2.3 Diesel-to-gas switch driven by Tier 4-Final & Euro Stage V norms
- 4.2.4 Telecom 5G densification in APAC & Africa
- 4.2.5 Adoption of hydrogen-ready and hybrid gensets (diesel-battery-PV)
- 4.2.6 AI-enabled predictive maintenance reducing TCO
- 4.3 Market Restraints
- 4.3.1 Rapid fall in commercial-scale battery prices
- 4.3.2 Stricter urban noise ordinances on standby units
- 4.3.3 Rising LNG & pipeline gas price volatility post-2024
- 4.3.4 Accelerating green-lease clauses discouraging onsite fossils
- 4.4 Supply-Chain Analysis
- 4.5 Regulatory Landscape
- 4.6 Technological Outlook
- 4.7 Porters Five Forces Analysis
- 4.7.1 Threat of New Entrants
- 4.7.2 Bargaining Power of Buyers
- 4.7.3 Bargaining Power of Suppliers
- 4.7.4 Threat of Substitutes
- 4.7.5 Competitive Rivalry
5 Market Size & Growth Forecasts
- 5.1 By Fuel Type
- 5.1.1 Diesel
- 5.1.2 Natural Gas
- 5.1.3 Dual-Fuel and Hybrid
- 5.1.4 Others (Renewable/Bio-fuel, LPG, Hydrogen-ready, etc.)
- 5.2 By Power Rating
- 5.2.1 Below 75 kVA
- 5.2.2 75 to 750 kVA
- 5.2.3 Above 750 kVA
- 5.3 By Application
- 5.3.1 Standby Power
- 5.3.2 Prime/Continuous Power
- 5.3.3 Peak-Shaving
- 5.3.4 Rental/Temporary Power
- 5.3.5 Micro-grid and Hybrid Support
- 5.4 By End-user Industry
- 5.4.1 Commercial Buildings (Offices, Retail, Malls)
- 5.4.2 Data Centers
- 5.4.3 Healthcare Facilities
- 5.4.4 Hospitality (Hotels & Resorts)
- 5.4.5 Education Institutions
- 5.4.6 Telecom (Towers, Edge POPs)
- 5.4.7 Airports & Transportation Hubs
- 5.4.8 Others
- 5.5 By Geography
- 5.5.1 North America
- 5.5.1.1 United States
- 5.5.1.2 Canada
- 5.5.1.3 Mexico
- 5.5.2 Europe
- 5.5.2.1 Germany
- 5.5.2.2 United Kingdom
- 5.5.2.3 France
- 5.5.2.4 Italy
- 5.5.2.5 NORDIC Countries
- 5.5.2.6 Russia
- 5.5.2.7 Rest of Europe
- 5.5.3 Asia-Pacific
- 5.5.3.1 China
- 5.5.3.2 India
- 5.5.3.3 Japan
- 5.5.3.4 South Korea
- 5.5.3.5 ASEAN Countries
- 5.5.3.6 Rest of Asia-Pacific
- 5.5.4 South America
- 5.5.4.1 Brazil
- 5.5.4.2 Argentina
- 5.5.4.3 Rest of South America
- 5.5.5 Middle East and Africa
- 5.5.5.1 Saudi Arabia
- 5.5.5.2 United Arab Emirates
- 5.5.5.3 South Africa
- 5.5.5.4 Egypt
- 5.5.5.5 Rest of Middle East and Africa
- 5.5.1 North America
6 Competitive Landscape
- 6.1 Market Concentration
- 6.2 Strategic Moves (M&A, Partnerships, PPAs)
- 6.3 Market Share Analysis (Market Rank/Share for key companies)
- 6.4 Company Profiles (includes Global level Overview, Market level overview, Core Segments, Financials as available, Strategic Information, Products & Services, and Recent Developments)
- 6.4.1 Aggreko plc
- 6.4.2 Atlas Copco AB
- 6.4.3 Blue Star Power Systems, Inc.
- 6.4.4 Briggs & Stratton Corporation
- 6.4.5 Caterpillar Inc.
- 6.4.6 Cummins Inc.
- 6.4.7 Deutz AG (Power Solutions Division)
- 6.4.8 Doosan Portable Power
- 6.4.9 FG Wilson
- 6.4.10 Generac Holdings Inc.
- 6.4.11 GE Vernova Inc.
- 6.4.12 Honda Motor Co., Ltd.
- 6.4.13 Himoinsa S.L.
- 6.4.14 Kirloskar Oil Engines Limited
- 6.4.15 Kohler Co.
- 6.4.16 Mahindra & Mahindra Limited
- 6.4.17 Mitsubishi Heavy Industries, Ltd.
- 6.4.18 Perkins Engines Company Limited
- 6.4.19 Rolls-Royce Holdings plc (Rolls-Royce Power Systems / MTU)
- 6.4.20 Wartsila Corporation
7 Market Opportunities & Future Outlook
- 7.1 White-space & Unmet-need Assessment

 北美發電機組:市場佔有率分析、行業趨勢和統計數據、成長預測(2026-2031 年)
 發電機組市場:按燃料類型、輸出功率、應用領域、國家和地區分類-產業分析、市場規模、市場佔有率和預測(2026-2033 年)發電機組:市場佔有率分析、產業趨勢與統計、成長預測(2026-2031)
 尖峰用電調節市場預測至2034年-按控制策略、技術、應用、最終用戶和地區分類的全球分析
 發電機組市場規模、佔有率和成長分析:額定功率、燃料類型、應用、最終用戶和地區分類-2026-2033年產業預測
 商用發電機市場 - 全球產業規模、佔有率、趨勢、機會、預測:按燃料、便攜性、功率輸出、應用、地區和競爭格局分類,2021-2031年
 全球發電機組市場
 發電機組市場:依燃料類型、型號、相數、額定輸出功率及最終用戶分類-2026-2032年全球市場預測防水發電機組市場:依燃料類型、額定功率、應用、便攜性、相數、冷卻方式和機殼類型分類,全球預測,2026-2032年
 尖峰用電調節發電機組市場:商業機會、成長要素、產業趨勢分析及2026-2035年預測