


 |
市場調查報告書
商品編碼
2119881
綠建築:市場佔有率分析、產業趨勢與統計、成長預測(2026-2031)Green Buildings - Market Share Analysis, Industry Trends & Statistics, Growth Forecasts (2026 - 2031) |
||||||

※ 本網頁內容可能與最新版本有所差異。詳細情況請與我們聯繫。
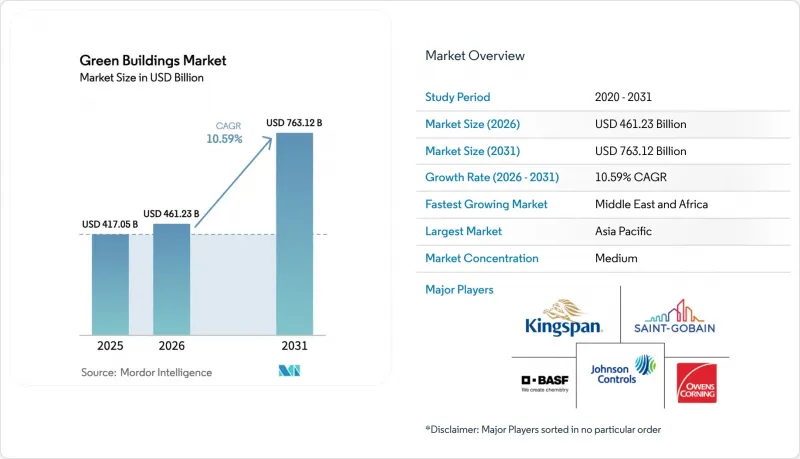
根據 Mordor Intelligence 預測,綠建築市場規模預計在 2025 年達到 4,170.5 億美元,2026 年達到 4,612.3 億美元,到 2031 年達到 7,631.2 億美元,2026 年至 2031 年的複合年成長率為 10.59%。
本報告按產品類型(外牆產品、內牆產品、建築系統及其他)、最終用戶(住宅、商業)、施工階段(新建、維修)和地區(北美、南美、歐洲、中東和非洲、亞太地區)進行細分。市場預測以美元計價。
全球綠建築市場趨勢與洞察
嚴格的綠建築法規和認證要求
目前,零排放建築法規正在影響專案融資決策。歐盟2024年修訂的指令規定,所有2030年後竣工的新建築必須實現營運碳中和,並要求現有非住宅資產在2027年前達到最低標準。加州第24號法規強制要求在基本設計中納入太陽能相容屋頂和電池線路,這使得採用可再生能源勢在必行。 LEED和BREEAM等認證機構已成為綠色金融的“安全隔離網閘”,因為貸款機構現在要求在簽訂合約之前獲得性能認證。這些政策雖然將遵循成本前期轉移,但卻能降低資金籌措成本,並加速綠建築在市場上的普及。未能達到標準的開發商將面臨「擱淺資產」的風險,這無疑將推動法規的持續發展。
能源價格上漲推動了對高性能建築圍護結構的需求。
自2023年以來,由於燃料價格持續波動,能源效率已成為租戶最關心的問題之一。如今,商業租戶願意為配備三層玻璃窗、隔熱幕牆和反射屋頂的建築支付更高的租金,因為這些設施可以將暖通空調負荷降低高達40%。與寒冷地區的辦公大樓類似,氣候溫暖地區的資料中心和物流中心也需要高度氣密的建築圍護結構,因為冷氣成本通常高於暖氣成本。由於投資回收期縮短至不到七年,業主現在可以證明採用高階覆材和窗戶組件的合理性,即使在二次性市場也是如此。因此,高性能建築圍護結構正在為綠色建築市場維修投資的成長奠定基礎。
前期投資和認證成本高。
獲得 LEED 金級認證仍需額外花費建築預算的 8% 至 12%,而中型專案的建模和檢驗諮詢費用可能超過 5 萬美元。經濟適用住宅開發商難以收回這些額外成本,導致綠建築市場在低收入群體中的普及速度放緩。雖然一些公用事業公司正在為節能維修提供聯合融資,但這些專案仍然不足,存在資金籌措缺口,並限制了短期成長。
細分市場分析
預計到2025年,建築系統將佔銷售額的42.3%,成為綠建築市場中最大的佔有率。暖通空調系統維修、變冷劑流量(VRF)熱泵和先進冷卻器是該領域的關鍵組成部分,它們能夠減少對石化燃料的依賴,並符合新的冷媒法規。智慧建築管理平台提供整合的暖通空調、照明和門禁控制面板,業主可以利用面板向貸款機構展示更高的能源效率。隨著建築圍護維修接近其物理極限,系統性能數據能夠提供最清晰的投資回報率(ROI)路徑,從而實現兩位數的成長。
外牆產品(保溫板、高性能玻璃、反射屋頂)仍然至關重要,但隨著建築規範的普及,其成長速度正在放緩。室內產品,例如低VOC塗料和再生地板材料,正受益於健康認證,尤其是在高階辦公空間。新興產品線(相變石膏板、電致變色玻璃)仍有成長空間,但需要降低成本。值得注意的是,能夠確保與物聯網中心「即插即用」互通性的供應商可以設定溢價,而傳統的獨立產品則面臨商品化的風險。因此,預計到2031年,外牆產品將以11.21%的複合年成長率超越其他類別,縮小其與綠色建築系統在綠色建築市場的差距。
區域分析
預計到2025年,亞太地區將佔全球綠色建築市場收入的37.6%,這主要得益於中國「碳排放達峰和碳中和」政策以及印度迅速採用綠色債券進行城市基礎設施資金籌措。中國綠占地面積將於2024年突破100億平方米,而印度綠建築委員會(IGBC)的註冊量預計在2025年將成長25%。日本和韓國正在維修90年代建造的辦公大樓,以符合嚴格的新規;而在澳大利亞,州政府的補貼正在加速郊區住宅屋頂太陽能發電和儲能系統的普及。這些趨勢表明,儘管隨著法規的完善,市場成長速度將會放緩,但亞太地區預計仍將保持其市場規模的領先地位。
中東和非洲地區正經歷最快的成長,預計到2031年將維持12.23%的複合年成長率,這主要得益於沙烏地阿拉伯耗資5000億美元的「2030願景」計畫和阿拉伯聯合大公國的淨零排放城市計畫。 NEOM的超大規模採購從一開始就採用了可再生能源、區域冷卻和再生水系統,為建築圍護結構和系統供應商帶來了巨額訂單。在阿拉伯聯合大公國,到2030年,75%的建築必須獲得綠色認證,這將引發現有建築的大規模翻維修。南非正在投資建造現場太陽能發電和電池儲能系統以應對電網不穩定問題,而拉各斯正在試行公共住宅建築規範,這表明這些規範預計將在非洲大陸廣泛應用。
北美和歐洲是成熟的市場,但它們仍然發揮著至關重要的作用。美國在2024年發行了450億美元的房地產綠色債券,用於資助主要都會區旨在獲得LEED認證的維修。加拿大已強制要求聯邦政府建築在2030年前實現淨零能耗,指南各省的政策。在歐洲,「Fit-for-55」計畫推動了維修,德國和法國為徹底的節能維修提供補貼。在英國,能源效率指標與建築安全標準掛鉤,以促進外牆覆層更換和新型暖通空調系統的安裝。拉丁美洲的綠色建築市場呈現選擇性成長,巴西在聖保羅擁有大量LEED認證房產,發揮主導作用,而墨西哥正在採用綠色標準,以滿足在美國近岸外包的租戶的需求。在全部區域,維修規模仍然強勁,為全球綠建築市場提供了支撐。
其他好處:
- Excel格式的市場預測(ME)表
- 3個月的分析師支持
目錄
第1章:引言
- 研究假設和市場定義
- 調查範圍
第2章:調查方法
第3章執行摘要
第4章 市場趨勢與分析
- 市場概覽
- 市場促進因素
- 嚴格的綠建築法規和認證要求
- 能源價格上漲推動了對高性能建築材料的需求。
- 企業ESG目標正在推動綠色債券和永續發展相關資金籌措的發展。
- 亞太地區快速都市化規劃融入綠建築標準
- 公共採購中強制揭露碳排放數據。
- 市場限制因素
- 與傳統建築相比,初始投資和認證成本較高。
- 低碳材料區域供應鏈的碎片化
- 先進永續建築方法熟練勞動力短缺
- 價值供應鏈分析
- 監理情勢
- 技術展望
- 波特五力模型
第5章 市場規模與成長預測
- 依產品類型
- 外用產品
- 室內產品
- 建築系統
- 其他
- 最終用戶
- 住宅
- 公寓和住宅
- 獨立式住宅和有土地的住宅
- 商業的
- 辦公室
- 零售
- 物流
- 對機構而言
- 其他(工業地產、飯店地產等)
- 住宅
- 施工階段
- 新建工程
- 維修
- 按地區
- 北美洲
- 美國
- 加拿大
- 墨西哥
- 南美洲
- 巴西
- 阿根廷
- 智利
- 其他南美國家
- 歐洲
- 英國
- 德國
- 法國
- 義大利
- 西班牙
- 荷蘭
- 其他歐洲國家
- 中東和非洲
- 沙烏地阿拉伯
- 阿拉伯聯合大公國
- 南非
- 奈及利亞
- 其他中東和非洲國家
- 亞太地區
- 中國
- 印度
- 日本
- 韓國
- 澳洲
- 印尼
- 其他亞太國家
- 北美洲
第6章 競爭情勢
- 市場集中度
- 策略趨勢
- 市佔率分析
- 公司簡介
- Kingspan Group PLC
- Saint-Gobain SA
- BASF SE
- Johnson Controls International plc
- Owens Corning
- Schneider Electric SE
- Holcim Ltd(LafargeHolcim)
- Skanska AB
- CEMEX SAB de CV
- Interface Inc.
- Alumasc Group PLC
- Amvik Systems
- Binderholz GmbH
- Bauder Limited
- Kingspan Insulation LLC
- Armstrong World Industries
- RedBuilt LLC
- Homasote Company
- Carrier Global Corporation
- Panasonic Corporation(BIPV)
第7章 市場機會與未來展望
According to Mordor Intelligence, the green buildings market size is projected to be USD 417.05 billion in 2025, USD 461.23 billion in 2026, and reach USD 763.12 billion by 2031, growing at a CAGR of 10.59% from 2026 to 2031.
This report is Segmented by Product Type (Exterior Products, Interior Products, Building Systems, Others), by End User (Residential, Commercial), by Construction Stage (New Construction, Renovation), and by Geography (North America, South America, Europe, Middle East and Africa, Asia-Pacific). The Market Forecasts are Provided in Terms of Value (USD).
Global Green Buildings Market Trends and Insights
Stringent Green-Construction Regulations & Certification Mandates
Zero-emission building rules now dictate project underwriting. The EU directive, revised in 2024, compels all new structures delivered after 2030 to achieve zero-operational carbon and forces existing non-residential assets to meet minimum ratings by 2027. California's Title 24 adds solar-ready roofs and battery-storage wiring to baseline design, eliminating the ability to defer renewable integration. Certification bodies such as LEED and BREEAM have become gatekeepers to green finance because lenders demand proof of performance before closing. These policies front-load compliance expenses but simultaneously unlock cheaper debt, accelerating uptake across the green building market. Developers unable to meet benchmarks face stranded-asset risk, ensuring regulations continue to steer demand.
Rising Energy Prices Boosting Demand for High-Performance Envelopes
Persistent fuel-price volatility since 2023 has moved energy efficiency to the top of tenant wish lists. Commercial occupiers are now willing to pay higher rents for buildings with triple glazing, thermally broken facades, and reflective roofs that cut HVAC loads by up to 40%. Warm-climate data centers and logistics hubs join cold-weather offices in specifying airtight envelopes because cooling costs often eclipse heating bills. With payback periods narrowing to seven years or less, owners can justify premium claddings and window packages even in secondary markets. High-performing envelopes, therefore, anchor growth in retrofit spending across the wider green building market.
High Upfront Capital & Certification Costs
LEED Gold still adds 8-12% to construction budgets, with consultant fees for modeling and verification topping USD 50,000 on mid-size projects. Affordable-housing developers struggle to monetize that premium, slowing adoption in lower-income segments of the green building market. Some utilities co-finance efficiency upgrades, but programs remain patchy, leaving a financing gap that constrains near-term growth.
Other drivers and restraints analyzed in the detailed report include:
- Corporate ESG Targets Opening Green-Bond & Sustainability-Linked Financing
- Rapid Urbanization Programs with Green-Building Codes in APAC
- Fragmented Supply Chains for Low-Carbon Materials
For complete list of drivers and restraints, kindly check the Table Of Contents.
Segment Analysis
Building systems accounted for 42.3% of 2025 revenue, making them the largest slice of the green building market. HVAC retrofits, variable-refrigerant-flow heat pumps, and advanced chillers anchor this category by reducing fossil-fuel dependence and complying with new refrigerant rules. Smart building-management platforms integrate HVAC, lighting, and access controls into a unified dashboard that owners use to prove efficiency gains to lenders. With envelope upgrades nearing physical limits, performance data from systems provides the clearest ROI pathway to sustain double-digit growth.
Exterior products-insulated panels, high-performance glazing, reflective roofs-remain essential but grow more modestly as code-driven adoption saturates. Interior items such as low-VOC paint and recycled flooring ride the wellness-certification tailwind, especially in premium offices. Emerging lines-phase-change drywall, electrochromic glass offer upside but await cost reductions. Crucially, suppliers that ensure plug-and-play interoperability with IoT hubs can price at a premium, while legacy stand-alone products risk commoditization. As a result, exterior products are forecast to outpace other categories at an 11.21% CAGR through 2031, narrowing the gap with building systems in the green building market.
Complete Report Scope:
- By Product Type
- Exterior Products
- Interior Products
- Building Systems
- Others
- By End User
- Residential
- Apartments & Condominiums
- Villas & Landed Houses
- Commercial
- Office
- Retail
- Logistics
- Institutional
- Others (industrial real estate, hospitality real estate, etc.)
- Residential
- By Construction Stage
- New Construction
- Renovation
- By Geography
- North America
- United States
- Canada
- Mexico
- South America
- Brazil
- Argentina
- Chile
- Rest of South America
- Europe
- United Kingdom
- Germany
- France
- Italy
- Spain
- Netherlands
- Rest of Europe
- Middle East and Africa
- Saudi Arabia
- United Arab Emirates
- South Africa
- Nigeria
- Rest of Middle East and Africa
- Asia-Pacific
- China
- India
- Japan
- South Korea
- Australia
- Indonesia
- Rest of Asia-Pacific
- North America
Geography Analysis
Asia-Pacific accounted for 37.6% of the 2025 green building market revenue, underpinned by China's dual-carbon policy and India's quick uptake of green bonds funding urban infrastructure. China surpassed 10 billion m2 of certified floor area in 2024, and India's IGBC listings grew 25% in 2025. Japan and South Korea retrofit 1990-era offices to stringent new codes, while Australia's state subsidies accelerate rooftop solar-plus-storage in suburban housing. These dynamics ensure Asia-Pacific remains the volume leader, although growth moderates as regulations mature.
The Middle East & Africa region is the fastest climber, expected to record a 12.23% CAGR through 2031 on the back of Saudi Arabia's USD 500 billion Vision 2030 projects and the UAE's net-zero-city mandates. NEOM's giga-scale procurement embeds renewable power, district cooling, and recycled-water systems from the outset, creating mega-orders for envelope and system suppliers. The UAE requires 75% of buildings to hold green certification by 2030, spawning a retrofit wave across existing stock. South Africa invests in on-site solar and batteries to escape grid instability, and Lagos pilots codes for public housing, hinting at broader continental adoption.
North America and Europe, though mature, remain pivotal. The United States issued USD 45 billion in real-estate green bonds in 2024, funding LEED upgrades in major metros. Canada mandates net-zero federal buildings by 2030, anchoring provincial policy. European renovation accelerates under the Fit-for-55 package, with Germany and France channeling subsidies toward deep-energy retrofits. The UK ties energy-efficiency metrics to building-safety rules, driving facade recladding and new HVAC. Latin America grows selectively; Brazil leads with LEED stock in Sao Paulo, while Mexico adopts green standards to satisfy U.S. nearshoring tenants. Collectively, these regions keep renovation volumes strong, sustaining the global green building market.
- Kingspan Group PLC
- Saint-Gobain SA
- BASF SE
- Johnson Controls International plc
- Owens Corning
- Schneider Electric SE
- Holcim Ltd (LafargeHolcim)
- Skanska AB
- CEMEX S.A.B. de C.V.
- Interface Inc.
- Alumasc Group PLC
- Amvik Systems
- Binderholz GmbH
- Bauder Limited
- Kingspan Insulation LLC
- Armstrong World Industries
- RedBuilt LLC
- Homasote Company
- Carrier Global Corporation
- Panasonic Corporation (BIPV)
Additional Benefits:
- The market estimate (ME) sheet in Excel format
- 3 months of analyst support
TABLE OF CONTENTS
1 Introduction
- 1.1 Study Assumptions & Market Definition
- 1.2 Scope of the Study
2 Research Methodology
3 Executive Summary
4 Market Insights and Dynamics
- 4.1 Market Overview
- 4.2 Market Drivers
- 4.2.1 Stringent green-construction regulations & certification mandates
- 4.2.2 Rising energy prices driving demand for high-performance envelopes
- 4.2.3 Corporate ESG targets unlocking green-bond & sustainability-linked financing
- 4.2.4 Rapid urbanisation programs with green-building codes in APAC
- 4.2.5 Mandatory embodied-carbon disclosure in public procurement
- 4.3 Market Restraints
- 4.3.1 High upfront capital & certification costs vs. conventional builds
- 4.3.2 Fragmented regional supply chains for low-carbon materials
- 4.3.3 Skilled-labour shortage in advanced sustainable-construction methods
- 4.4 Value / Supply-Chain Analysis
- 4.5 Regulatory Landscape
- 4.6 Technological Outlook
- 4.7 Porter's Five Forces
- 4.7.1 Bargaining Power of Suppliers
- 4.7.2 Bargaining Power of Buyers
- 4.7.3 Threat of New Entrants
- 4.7.4 Threat of Substitutes
- 4.7.5 Competitive Rivalry
5 Market Size & Growth Forecasts
- 5.1 By Product Type
- 5.1.1 Exterior Products
- 5.1.2 Interior Products
- 5.1.3 Building Systems
- 5.1.4 Others
- 5.2 By End User
- 5.2.1 Residential
- 5.2.1.1 Apartments & Condominiums
- 5.2.1.2 Villas & Landed Houses
- 5.2.2 Commercial
- 5.2.2.1 Office
- 5.2.2.2 Retail
- 5.2.2.3 Logistics
- 5.2.2.4 Institutional
- 5.2.2.5 Others (industrial real estate, hospitality real estate, etc.)
- 5.2.1 Residential
- 5.3 By Construction Stage
- 5.3.1 New Construction
- 5.3.2 Renovation
- 5.4 By Geography
- 5.4.1 North America
- 5.4.1.1 United States
- 5.4.1.2 Canada
- 5.4.1.3 Mexico
- 5.4.2 South America
- 5.4.2.1 Brazil
- 5.4.2.2 Argentina
- 5.4.2.3 Chile
- 5.4.2.4 Rest of South America
- 5.4.3 Europe
- 5.4.3.1 United Kingdom
- 5.4.3.2 Germany
- 5.4.3.3 France
- 5.4.3.4 Italy
- 5.4.3.5 Spain
- 5.4.3.6 Netherlands
- 5.4.3.7 Rest of Europe
- 5.4.4 Middle East and Africa
- 5.4.4.1 Saudi Arabia
- 5.4.4.2 United Arab Emirates
- 5.4.4.3 South Africa
- 5.4.4.4 Nigeria
- 5.4.4.5 Rest of Middle East and Africa
- 5.4.5 Asia-Pacific
- 5.4.5.1 China
- 5.4.5.2 India
- 5.4.5.3 Japan
- 5.4.5.4 South Korea
- 5.4.5.5 Australia
- 5.4.5.6 Indonesia
- 5.4.5.7 Rest of Asia-Pacific
- 5.4.1 North America
6 Competitive Landscape
- 6.1 Market Concentration
- 6.2 Strategic Moves
- 6.3 Market Share Analysis
- 6.4 Company Profiles (includes Global level Overview, Market level overview, Core Segments, Financials as available, Strategic Information, Products & Services, and Recent Developments)
- 6.4.1 Kingspan Group PLC
- 6.4.2 Saint-Gobain SA
- 6.4.3 BASF SE
- 6.4.4 Johnson Controls International plc
- 6.4.5 Owens Corning
- 6.4.6 Schneider Electric SE
- 6.4.7 Holcim Ltd (LafargeHolcim)
- 6.4.8 Skanska AB
- 6.4.9 CEMEX S.A.B. de C.V.
- 6.4.10 Interface Inc.
- 6.4.11 Alumasc Group PLC
- 6.4.12 Amvik Systems
- 6.4.13 Binderholz GmbH
- 6.4.14 Bauder Limited
- 6.4.15 Kingspan Insulation LLC
- 6.4.16 Armstrong World Industries
- 6.4.17 RedBuilt LLC
- 6.4.18 Homasote Company
- 6.4.19 Carrier Global Corporation
- 6.4.20 Panasonic Corporation (BIPV)
7 Market Opportunities & Future Outlook

 綠色外牆市場:按類型、植被類型、應用和區域分類
 2026年全球單戶住宅綠建築市場報告2026年全球多戶住宅綠建築市場報告2026年全球綠建築市場報告2026年全球非住宅綠建築市場報告2026年全球綠建築LEED諮詢市場報告
 簡易包裝市場規模、佔有率、成長及全球產業分析:按類型、應用和地區分類的洞察,2026-2034 年預測
 亞太地區綠建築:市場佔有率分析、產業趨勢與統計、成長預測(2026-2031年)
 綠色建築市場-全球產業規模、佔有率、趨勢、機會和預測:按產品類型、應用、地區和競爭格局分類,2021-2031年
 綠建築市場機會、成長促進因素、產業趨勢分析及預測(2025-2034年)