


 |
市場調查報告書
商品編碼
2119788
澳新定位服務:市場佔有率分析、行業趨勢和統計數據、成長預測(2026-2031 年)ANZ Location-based Services - Market Share Analysis, Industry Trends & Statistics, Growth Forecasts (2026 - 2031) |
||||||

※ 本網頁內容可能與最新版本有所差異。詳細情況請與我們聯繫。
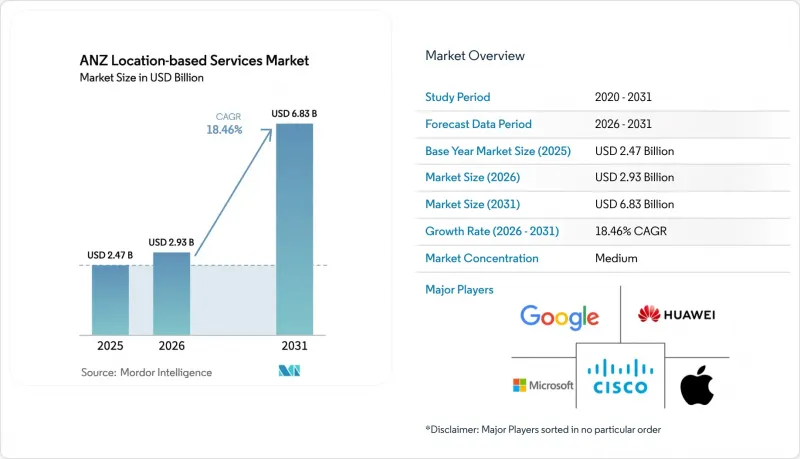
據 Mordor Intelligence 稱,2025 年澳洲和紐西蘭地區定位服務市場價值為 24.7 億美元,預計到 2031 年將從 2026 年的 29.3 億美元成長至 68.3 億美元,預測期(2026-2031 年)的複合年成長率為 18.46%。
本報告按組件(硬體、軟體、服務)、位置(室內、室外)、應用(地圖和導航、商業智慧和分析、定位性廣告、社交網路和娛樂以及其他應用)和最終用戶(運輸和物流、IT 和電信、醫療保健、政府機構等)進行分類。
澳新定位服務市場趨勢與洞察
5G 的普及和專用 LTE 的部署正在提高室內定位精度。
紐西蘭決定為每家電信業者分配 80 MHz 的 3.5 GHz 頻段,以確保倉庫和航站樓實現厘米級定位所需的網路密度。在奧克蘭機場,Spark 的私人 5G 網路已用於夜間無人機庫存盤點,取代了以往每季的人工盤點。在澳大利亞,6 GHz 頻段已被分配給室內 Wi-Fi,進一步完善了 UWB 標籤,為工廠提供融合頻寬和精度的射頻工具包。系統整合商報告稱,與單獨使用傳統 Wi-Fi 相比,UWB 和 5G 的結合可以將室內定位誤差降低 70%。供應商目前正在將 5G小型基地台和即時定位系統 (RTLS) 中介軟體打包,將部署時間從數月縮短至數天。隨著越來越多的公司從概念驗證(PoC) 階段過渡到生產部署階段,資本投資也正從先導計畫預算轉向主流 IT 規劃。
紐澳地區物流產業車隊遠端資訊處理技術的擴展
燃油價格波動和長期存在的駕駛短缺問題正促使車主將路線規劃、維護和合規流程數位化。 EROAD 2025 年中期營收成長 8% 至 9,590 萬紐西蘭元,主要得益於其輕型車輛道路使用收費模組的需求,可自動收取稅金。 Transurban 在墨爾本 CityLink 進行的一項關於自動駕駛卡車的研究表明,即時道路形狀數據可將車道保持錯誤減少 42%,凸顯了基於位置的技術在安全性方面的優勢。目前,紐西蘭 91% 的輕型車輛道路使用收費(RUC) 仍採用人工處理,因此遠端資訊處理的潛在市場依然龐大,這推動了紐澳地區定位服務市場實現兩位數成長的前景。
加強隱私相關法律(《消費者資料權法》、《紐西蘭個人資料保護法》)
對於新創公司而言,明確的同意流程、資料擁有者識別和強制刪除程序會使專案週期延長多達 12 週,從而加劇資金消耗。根據澳洲競爭與消費者委員會 (ACCC) 2024 年的一項調查,84% 的澳洲人希望對位置共用擁有精細的控制權,這迫使企業實施新的用戶體驗流程,從而延緩了用戶註冊速度。目前,合規相關成本平均佔中型位置服務 SaaS 提供者年收入的 4%。雖然大型成熟公司能夠應對這些成本,但小規模的新參與企業可能被迫退出或重組,這可能會減緩新進入者在紐澳地區定位服務市場的發展勢頭。
細分市場分析
隨著企業加速部署支援 5G 的小型基地台、UWB 錨點和高密度 BLE 信標(這些對於實現亞米精度至關重要),硬體在 2025 年的銷售額佔比達到 45.10%。工業買家傾向於選擇能夠跨 Wi-Fi RTT、UWB 和到達角 (AoA) BLE 進行三角定位的多模閘道器,從而在不斷發展的標準中延長資產的使用壽命。對低功耗、定位最佳化半導體(例如 Qorvo 的通道探測晶片)的需求,使得無晶圓廠供應商能夠在醫療和倉儲行業獲得長期設計訂單。相較之下,Mapbox、Esri 和 GapMaps 等雲端原生軟體堆疊降低了分析功能的進入門檻,使非 GIS 專家也能使用高級地理圍欄和等時線 API,而無需承擔高昂的前期授權費用。
隨著企業將設計、校準和生命週期管理外包,服務業正以23.55%的複合年成長率快速成長。包含硬體更換、韌體更新和機器學習模型重新訓練的託管式即時定位系統(RTLS)訂閱服務,正在將一次性資本支出(Capex)轉化為可預測的營運支出(OpEx)。 Movement公司的太陽能牲畜標籤就是這種轉變的例證。牧場主只需支付包含連接、分析和電池更換的軟體即服務(SaaS)費用,即可將大規模牧場的總擁有成本(TCO)降低30%。隨著合規框架日益複雜,消費者資料權利審計和頻譜排放合規諮詢服務正在擴大專業整合商的潛在客戶群。因此,預計到預測期中期,服務支出將超過硬體支出,進一步加速澳洲和紐西蘭(ANZ)定位服務市場價值鏈的轉變。
戶外定位仍然是一個關鍵領域,預計到2025年將佔總支出的59.85%,這得益於農業、採礦和貨運遠端資訊處理等領域的成熟應用案例。 SouthPAN擴展層承諾在1000萬平方公里的陸地和海洋範圍內實現厘米級精度,從而擴大其在變量施肥農業和自動化運輸路線中的應用。然而,發展勢頭正在轉向室內。受醫院資產追蹤和揀貨燈光倉儲系統的推動,2024年澳洲和紐西蘭地區的UWB標籤出貨量加倍。
預計到2031年,室內項目將以19.45%的複合年成長率成長,這反映了私有5G網路的成長以及監管機構為統一免許可6GHz頻段所做的努力。在雪梨皇家阿爾弗雷德醫院投入營運的第一年,藍牙到達角(Bluetooth-AOA)即時定位系統(RTLS)將資產定位的平均時間縮短了18分鐘,為患者照護節省了1500小時的臨床時間。 Spark New Zealand的端到端室內解決方案將5G核心網切片與位置中間件仲介結合,實現了信標、攝影機和RFID設備座標的標準化。這種多方面的方法減少了基礎設施冗餘,即使對於中型設施也能帶來可觀的投資回報率,並正在重振澳洲和紐西蘭(ANZ)的定位服務市場。
其他好處:
- Excel格式的市場預測(ME)表
- 3個月的分析師支持
目錄
第1章:引言
- 研究假設和市場定義
- 調查範圍
第2章:調查方法
第3章執行摘要
第4章 市場狀況
- 市場概覽
- 市場促進因素
- 5G 的普及和專用 LTE 的部署正在提高室內定位精度。
- 紐澳地區物流產業車隊遠端資訊處理技術的擴展
- 零售業超在地化客戶參與措施/地理行銷
- 政府關於開放資料和地理空間資訊的舉措
- 採礦和農業領域的數位孿生技術需要達到亞米級精度(已通報案例較少)
- 智慧醫院路線引導與資產追蹤試點計畫(媒體通報不足)
- 市場限制因素
- 加強隱私相關法律(《消費者資料權法》、《紐西蘭隱私法》)
- 人口密集都市區峽谷中的GNSS多路徑誤差
- 室內超寬頻/低功耗藍牙的頻率策略分散(報告不足)
- 地理人工智慧模型開發中人員短缺(以及報告不足)。
- 重要法規結構的評估
- 價值鏈分析
- 技術展望
- 波特五力模型
- 主要用例和案例研究
- 宏觀經濟因素對市場的影響
- 投資分析
第5章 市場區隔
- 按組件
- 硬體
- 軟體
- 服務
- 按位置類型
- 室內的
- 戶外的
- 透過使用
- 地圖和導航
- 商業智慧與分析
- 基於位置的廣告
- 社群網路和娛樂
- 其他用途
- 按最終用戶行業分類
- 運輸/物流
- 資訊科技/通訊
- 衛生保健
- 政府
- BFSI
- 飯店業
- 製造業
- 其他最終用戶
第6章 競爭情勢
- 市場集中度
- 策略趨勢
- 市佔率分析
- 公司簡介
- Google LLC
- Microsoft Corporation
- Apple Inc.
- HERE Technologies(HERE Global BV)
- Cisco Systems, Inc.
- Uber Technologies, Inc.
- GapMaps Pty Ltd
- Esri Australia Pty Ltd
- TomTom International BV
- Telstra Group Limited
- Spark New Zealand Limited
- Singtel Optus Pty Limited
- TPG Telecom Limited
- EROAD Limited
- Trimble Inc.
- Nearmap Ltd
- Mapbox Inc.
- Ubisense Ltd
- BlueCats Pty Ltd
- Hexagon AB(HxGN)
第7章 市場機會與未來展望
According to Mordor Intelligence, the ANZ location-based services market size was valued at USD 2.47 billion in 2025 and estimated to grow from USD 2.93 billion in 2026 to reach USD 6.83 billion by 2031, at a CAGR of 18.46% during the forecast period (2026-2031).
This report is Segmented by Component (Hardware, Software, and Services), Location (Indoor, and Outdoor), Application (Mapping and Navigation, Business Intelligence and Analytics, Location-Based Advertising, Social Networking and Entertainment, and Other Applications), and End-User (Transportation and Logistics, IT and Telecom, Healthcare, Government, and More).
ANZ Location-based Services Market Trends and Insights
Pervasive 5G and private-LTE roll-outs boosting indoor precision
New Zealand's decision to grant each operator 80 MHz of 3.5 GHz spectrum creates the density needed for centimeter-level positioning in warehouses and terminals; Spark's private 5G at Auckland Airport already supports drone-based inventory audits every night instead of quarterly manual counts . Australia's allocation of 6 GHz for indoor Wi-Fi further complements UWB tags, giving factories an RF toolkit that fuses bandwidth and accuracy. Integrators report that combining UWB with 5G reduces indoor location error by 70% compared with legacy Wi-Fi alone. Vendors now package 5G small-cells with RTLS middleware, shrinking deployment time from months to days. As more enterprises shift from proof-of-concept to production roll-outs, capital outlays move from pilot budgets into mainstream IT planning.
Expansion of fleet-telematics across ANZ logistics
Fuel-price volatility and a chronic driver shortage are persuading fleet owners to digitize route planning, maintenance and compliance. EROAD's FY25 interim revenue climbed to NZD 95.9 million, up 8%, driven by demand for light-vehicle road-user-charging modules that automate tax collection. Transurban's automated-truck study on Melbourne's CityLink showed that real-time road geometry reduces lane-keeping errors by 42%, illustrating location data's safety dividend. With 91% of New Zealand's light-vehicle RUC still processed manually, the addressable pool for telematics remains sizeable, reinforcing double-digit growth prospects for the ANZ Location-based Services market.
Heightened privacy legislation (Consumer Data Right, NZ Privacy Act)
Explicit consent, data-holder accreditation and mandatory deletion protocols are adding as much as 12 weeks to project timelines for start-ups, raising cash-burn rates. The ACCC's 2024 inquiry found that 84% of Australians want granular control over location sharing, prompting firms to embed new UX flows that slow onboarding . Compliance spending now averages 4% of annual revenue among mid-size location SaaS providers. Larger incumbents are weathering the cost, but smaller entrants may exit or pivot, trimming new-entrant momentum within the ANZ Location-based Services market.
Other drivers and restraints analyzed in the detailed report include:
- Retail push for hyper-local customer engagement / geomarketing
- Government open-data geospatial initiatives
- GNSS multipath errors in dense urban canyons
For complete list of drivers and restraints, kindly check the Table Of Contents.
Segment Analysis
Hardware accounted for 45.10% of 2025 revenue as enterprises raced to install 5G-ready small cells, UWB anchors and dense BLE beacons essential for sub-meter precision. Industrial buyers gravitated toward multimode gateways able to triangulate across Wi-Fi RTT, UWB and angle-of-arrival BLE, thereby prolonging asset lifecycles amid evolving standards. Demand for semiconductors optimized for low-power positioning-such as Qorvo's channel-sounding chips-helped fabless suppliers secure long-term design wins in healthcare and warehousing. In contrast, cloud-native software stacks delivered by Mapbox, Esri and GapMaps lowered entry barriers for analytic functions, letting non-GIS specialists consume advanced geofencing and isochrone APIs without heavy upfront licensing.
The services line is accelerating at a 23.55% CAGR as enterprises outsource design, calibration and life-cycle management. Managed-RTLS subscriptions include hardware swaps, firmware updates and machine-learning model retraining, converting one-off capex into predictable opex. movement's solar-powered livestock tags exemplify this pivot: ranchers pay a software-as-a-service fee that bundles connectivity, analytics and battery replacement, reducing total cost of ownership by 30% in large cattle stations. As compliance frameworks grow more intricate, consulting around Consumer Data Right audits and Spectrum-Emissions compliance is inflating the addressable pool for specialist integrators. The resulting mix positions services to overtake hardware spending midway through the forecast period, reinforcing a value-chain shift inside the ANZ Location-based Services market.
Outdoor positioning remained the mainstay with 59.85% of spending in 2025, buoyed by well-entrenched agriculture, mining and freight telematics use cases. SouthPAN's augmentation layer promises centimeter-grade accuracy across 10 million km2 of land and sea, widening adoption in variable-rate agriculture and haul-road automation. Yet the momentum is tilting indoors; UWB tag shipments into ANZ doubled during 2024, driven by hospital asset tracking and pick-to-light warehouse systems.
Indoor projects are projected to log a 19.45% CAGR through 2031, reflecting private-5G network growth and regulators' moves to harmonize 6 GHz unlicensed spectrum. In the first operational year at Sydney's Royal Prince Alfred Hospital, a Bluetooth-Angle-of-Arrival RTLS shaved 18 minutes off average asset location time, releasing 1,500 clinical hours back to patient care. Spark New Zealand's end-to-end indoor stack pairs 5G core slicing with a location middleware broker that standardizes coordinates across beacons, cameras and RFID. This multifactor approach is reducing infrastructure duplication, making ROIs attractive even in mid-sized facilities and bolstering the ANZ Location-based Services market.
Complete Report Scope:
- By Component
- Hardware
- Software
- Services
- By Location Type
- Indoor
- Outdoor
- By Application
- Mapping and Navigation
- Business Intelligence and Analytics
- Location-based Advertising
- Social Networking and Entertainment
- Other Applications
- By End-user Vertical
- Transportation and Logistics
- IT and Telecom
- Healthcare
- Government
- BFSI
- Hospitality
- Manufacturing
- Other End-users
List of Companies Covered in this Report:
- Google LLC
- Microsoft Corporation
- Apple Inc.
- HERE Technologies (HERE Global B.V.)
- Cisco Systems, Inc.
- Uber Technologies, Inc.
- GapMaps Pty Ltd
- Esri Australia Pty Ltd
- TomTom International B.V.
- Telstra Group Limited
- Spark New Zealand Limited
- Singtel Optus Pty Limited
- TPG Telecom Limited
- EROAD Limited
- Trimble Inc.
- Nearmap Ltd
- Mapbox Inc.
- Ubisense Ltd
- BlueCats Pty Ltd
- Hexagon AB (HxGN)
Additional Benefits:
- The market estimate (ME) sheet in Excel format
- 3 months of analyst support
TABLE OF CONTENTS
1 INTRODUCTION
- 1.1 Study Assumptions and Market Definition
- 1.2 Scope of the Study
2 RESEARCH METHODOLOGY
3 EXECUTIVE SUMMARY
4 MARKET LANDSCAPE
- 4.1 Market Overview
- 4.2 Market Drivers
- 4.2.1 Pervasive 5G and private-LTE roll-outs boosting indoor precision
- 4.2.2 Expansion of fleet-telematics across ANZ logistics
- 4.2.3 Retail push for hyper-local customer engagement/geomarketing
- 4.2.4 Government open-data geospatial initiatives
- 4.2.5 Mining and agri-digital twins requiring sub-meter accuracy (under-reported)
- 4.2.6 Smart-hospital way-finding and asset tracking pilots (under-reported)
- 4.3 Market Restraints
- 4.3.1 Heightened privacy legislation (Consumer Data Right, NZ Privacy Act)
- 4.3.2 GNSS multipath errors in dense urban canyons
- 4.3.3 Fragmented spectrum policy for indoor UWB/BLE (under-reported)
- 4.3.4 Skills shortage in geo-AI model development (under-reported)
- 4.4 Evaluation of Critical Regulatory Framework
- 4.5 Value Chain Analysis
- 4.6 Technological Outlook
- 4.7 Porter's Five Forces
- 4.7.1 Bargaining Power of Suppliers
- 4.7.2 Bargaining Power of Buyers
- 4.7.3 Threat of New Entrants
- 4.7.4 Threat of Substitutes
- 4.7.5 Competitive Rivalry
- 4.8 Key Use Cases and Case Studies
- 4.9 Impact on Macroeconomic Factors of the Market
- 4.10 Investment Analysis
5 MARKET SEGMENTATION
- 5.1 By Component
- 5.1.1 Hardware
- 5.1.2 Software
- 5.1.3 Services
- 5.2 By Location Type
- 5.2.1 Indoor
- 5.2.2 Outdoor
- 5.3 By Application
- 5.3.1 Mapping and Navigation
- 5.3.2 Business Intelligence and Analytics
- 5.3.3 Location-based Advertising
- 5.3.4 Social Networking and Entertainment
- 5.3.5 Other Applications
- 5.4 By End-user Vertical
- 5.4.1 Transportation and Logistics
- 5.4.2 IT and Telecom
- 5.4.3 Healthcare
- 5.4.4 Government
- 5.4.5 BFSI
- 5.4.6 Hospitality
- 5.4.7 Manufacturing
- 5.4.8 Other End-users
6 COMPETITIVE LANDSCAPE
- 6.1 Market Concentration
- 6.2 Strategic Moves
- 6.3 Market Share Analysis
- 6.4 Company Profiles {(includes Global level Overview, Market level overview, Core Segments, Financials as available, Strategic Information, Market Rank/Share for key companies, Products and Services, and Recent Developments)}
- 6.4.1 Google LLC
- 6.4.2 Microsoft Corporation
- 6.4.3 Apple Inc.
- 6.4.4 HERE Technologies (HERE Global B.V.)
- 6.4.5 Cisco Systems, Inc.
- 6.4.6 Uber Technologies, Inc.
- 6.4.7 GapMaps Pty Ltd
- 6.4.8 Esri Australia Pty Ltd
- 6.4.9 TomTom International B.V.
- 6.4.10 Telstra Group Limited
- 6.4.11 Spark New Zealand Limited
- 6.4.12 Singtel Optus Pty Limited
- 6.4.13 TPG Telecom Limited
- 6.4.14 EROAD Limited
- 6.4.15 Trimble Inc.
- 6.4.16 Nearmap Ltd
- 6.4.17 Mapbox Inc.
- 6.4.18 Ubisense Ltd
- 6.4.19 BlueCats Pty Ltd
- 6.4.20 Hexagon AB (HxGN)
7 MARKET OPPORTUNITIES AND FUTURE OUTLOOK
- 7.1 White-space and Unmet-Need Assessment

 美國定位服務:市場佔有率分析、行業趨勢和統計數據以及成長預測(2026-2031 年)義大利定位服務:市場佔有率分析、行業趨勢和統計數據以及成長預測(2026-2031 年)
 定位服務市場商機、成長要素、產業趨勢分析及 2026-2035 年預測。定位服務:市場佔有率分析、行業趨勢和統計數據、成長預測(2026-2031 年)
 定位服務市場:全球市場預測(2026-2032年)
 全球微定位技術市場
 定位服務市場規模、佔有率和趨勢分析報告:按組件、位置類型、技術、應用、最終用途、地區和細分市場預測(2026-2033 年)
 定位服務市場報告:按組件、技術、位置類型、應用、最終用戶和地區分類(2026-2034 年)
 全球定位服務市場規模、佔有率、趨勢和成長分析報告(2026-2034年)
 定位服務市場:按位置、最終用戶行業和地區分類。