


 |
市場調查報告書
商品編碼
2119230
社區發展服務:市場佔有率分析、產業趨勢與統計、成長預測(2026-2031 年)Community Growth Services - Market Share Analysis, Industry Trends & Statistics, Growth Forecasts (2026 - 2031) |
||||||

※ 本網頁內容可能與最新版本有所差異。詳細情況請與我們聯繫。
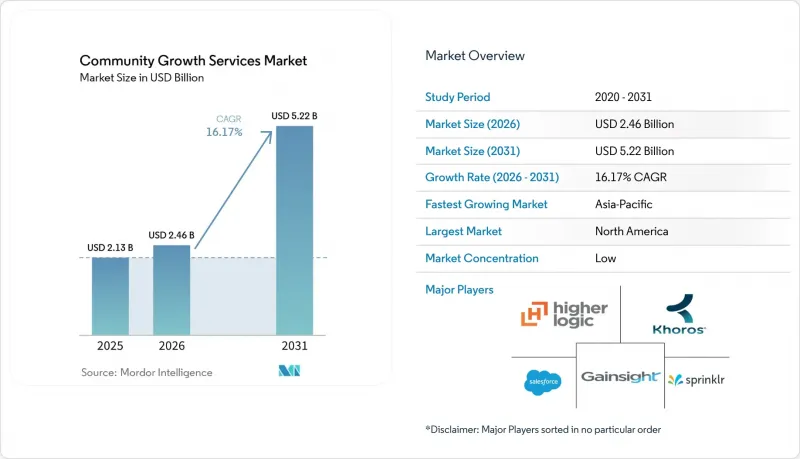
根據 Mordor Intelligence 預測,社區發展服務市場規模將從 2025 年的 21.3 億美元成長到 2026 年的 24.6 億美元,到 2031 年達到 52.2 億美元,2026 年至 2031 年的年複合成長率(CAGR)為 16.17%。
本報告依服務類型(社群拓展服務、互動專案服務、內容審核與信任保障服務及其他)、最終使用者(軟體與科技、媒體與出版、專業協會與會員組織、消費品牌與零售、金融服務及其他)及地區進行細分。市場預測以美元計價。
全球社區發展服務市場趨勢與洞察
企業對客戶維繫主導成長的興趣日益濃厚
客戶維繫成為眾多軟體和科技公司的核心成長指標,這使得能夠將專案活動與客戶成果連結起來的社群專家需求持續成長。社群為客戶提供了一個平台,讓他們可以向同儕學習、解決問題,並加深與供應商產品的互動,而無需完全依賴官方支援管道。 Gainsight 的報告顯示,積極參與並提供P2P解決方案的成員比不參與的客戶流失率更低。這種趨勢使得社群難以被取代,因為在供應商主導的環境中,客戶關係、實踐知識和使用者信任會隨著時間的推移而累積。 Zoom 和 Cognite 利用 Gainsight Customer Communities 和 Skilljar 將同儕互動與系統學習結合,並增強了在合約續約決策中教育和支持的作用。因此,在社區成長服務市場中,那些將客戶維繫策略融入專案設計、與客戶成功團隊合作、對成員活動的意義達成通用並在年度合約審查前匯報結果的服務提供者將備受青睞。這使得社區計畫更容易被定位為客戶關係不可或缺的一部分,而不是孤立的溝通活動。
越來越重視同儕支持和案件轉移
同儕互助可以透過減少提交給正式支援團隊的案例數量來保護社區預算,從而更容易在與財務領導的討論中解釋由此帶來的成本節約。 Salesforce 指出,一定規模的同儕互助論壇可以避免 20% 到 28% 的支援工單。 Higher Logic 的方法論透過採用的答案和平均工單成本來衡量直接成本節約,同時也考慮了內容頁面瀏覽量的價值,因為這些瀏覽量有可能預防未來的案例。這種方法使財務團隊能夠更清晰地評估那些能夠為支援、客戶成功和產品團隊(而不僅僅是單一部門)帶來價值的專案。 FeverBee 報告稱,實施系統化的審核和減少摩擦的方案,使組織內部 AI 系統對社群內容的搜尋率提高了 55%。社區成長服務市場需要能夠將降低支援成本與經驗數據結合的供應商,這些數據可以提高管理良好的知識、清晰的內容結構和內部 AI 的產出。它的價值在於保持答案的準確性,使有用的內容易於發現,並應用審核措施來限制低品質內容,防止其影響知識庫,同時透過會員參與和正式的內容審查不斷完善知識庫。
在行銷預算不變的情況下,如何證明社區投資報酬率
社群專案在爭奪資金和管道方面面臨激烈的競爭,尤其是在行銷預算停滯不前的情況下,這些管道需要提供直接且易於理解的績效指標。由於社群專案的價值體現在諸多方面——例如減少支援諮詢、提高客戶維繫、增強客戶擁護度、收集產品回饋、提升搜尋可見度等等——因此,對許多組織而言,建立單一的歸因模型是一項挑戰。 Higher Logic 指出,雖然可以透過「已解答問題數量」和「平均工單成本」來衡量直接工單成本的降低,但間接成本的降低則需要針對特定項目做出活動假設。社群網路往往在達到一定的規模(包括成員數量和內容)後才能發揮最佳效果,但這可能與預算週期短、按季度規劃的預期相衝突。服務提供者可以透過在邀請成員加入專案之前,明確定義指標、基準、問責機制和歸因邏輯來緩解這個問題。如果服務提供者將績效衡量視為事後報告任務,而不是指導營運決策的核心服務要素,那麼社區成長服務市場仍然十分脆弱。這是因為,如果沒有一個共同的起點和定期的報告流程,團隊可能很難解釋參與度、支持活動或留存率的變化是否與服務計劃相關,以及報告的結果是否可以用於指導未來的預算決策。
細分市場分析
至2025年,社區獲取服務將佔社區成長服務市場收入的38.27%。這一主導地位反映出,在進行互動、內容管理和計劃服務之前,必須先建立起一定的會員基礎。獲取計劃包括新會員註冊流程、會員價值提案以及初始啟動機制。這些活動需要專業的社區規劃,而普通行銷機構無法提供此類服務,因此企業通常會尋求外部專家的協助。
預計從2026年到2031年,員工倡導專案在員工敬業度專案服務領域的複合年成長率將達到17.28%。根據DSMN8的報告,到2026年,68%的計劃者每週發佈內容將達到三次或以上,年增13個百分點。 Sprinklr報告稱,歐萊雅的倡導項目擁有超過900名大使,在18個月內獲得了超過3300萬次的自然曝光,實現了4倍的投資回報率(ROI)。由於需要對合成內容和大規模社群進行更專業的監控,「審核和信任保障服務」的重要性日益凸顯。此外,「社區活動和體驗服務」的範圍也從年度股東大會擴展到支援包括活動策劃、平台管理和物流在內的持續性工作。整體這些服務都表明,社區成長服務業正在向持續管理交付模式轉型,這種模式能夠支持更長期的契約,並在社區成長服務市場中提供更高的服務價值。
區域分析
到2025年,北美將佔據社區成長服務市場48.04%的佔有率。該地區聚集了許多SaaS公司、企業買家和社區平台供應商。這種接近性促進了專業實踐、工具和採購方法的共用。美國仍是主要貢獻者,Gainsight、Higher Logic、Bevy、Khoros和Influitive等公司為從成長型SaaS公司到財富500強企業的各類買家提供服務。同時,加拿大正透過其金融科技和SaaS產業不斷擴大需求。
歐洲是第二大區域市場,主要由英國、德國、法國和北歐國家推動。 《數位服務法案》正在影響整個歐洲的社區管治、內容審核和資料處理要求。在德國和北歐國家,對支持知識交流和同儕檢驗的專業組織和B2B計畫有著迫切的需求。在法國軟體生態系統中,隨著各組織將社區管理視為社區成長服務市場中的獨立業務職能,對社區的投資正在增加。南美洲的需求主要集中在巴西,其次是阿根廷和哥倫比亞。在這些國家,數位轉型正在推動社區成長服務市場早期企業專案的啟動。
預計亞太地區在2026年至2031年間將以17.04%的複合年成長率成長,成為成長最快的地區。 SaaS在印度和東南亞的普及率正在上升,專業人脈網路在該地區的社區成長服務市場中蓬勃發展。該地區的SaaS公司正在建立服務於本地用戶和全球基本客群的社區計畫。客戶期望和專案成熟度的區域差異,催生了對能夠適應當地市場環境的服務模式的需求。在印度,服務全球客戶的SaaS新創公司和IT服務公司蓬勃發展,而韓國和新加坡則是企業平台的早期採用者。中東和非洲仍處於起步階段,但阿拉伯聯合大公國、沙烏地阿拉伯和南非在其各自的數位轉型計畫下,正成為重要的需求中心。
其他好處
- Excel格式的市場預測(ME)表
- 3個月的分析師支持
目錄
第1章:引言
- 研究假設和市場定義
- 調查範圍
第2章:調查方法
第3章執行摘要
第4章 市場狀況
- 市場概覽
- 市場促進因素
- 企業對客戶維繫主導成長的興趣日益濃厚
- 越來越重視同儕支持和案件轉移
- 人工智慧驅動的個人化與社群管理
- 拓展混合社區活動,並提供隨時可用的會員體驗。
- 將我們自己的社群轉變為零點擊發現工具和抵禦演算法變化的對沖機制。
- 在人工智慧主導的上市時間系統中,對第一方互動資料進行策略學習資料轉換。
- 市場限制因素
- 在行銷預算不變的情況下,如何證明社區投資報酬率
- 資料隱私、合規性和品牌安全負擔
- 由於網路安全法規和合成內容被濫用的風險,內容審核成本增加。
- 工具堆疊碎片化以及社群、CRM 和事件資料中的歸因盲點。
- 產業價值鏈分析
- 宏觀經濟因素對市場的影響
- 監理情勢
- 技術展望
- 波特五力分析
第5章 市場規模與成長預測
- 按服務類型
- 社區收購服務
- 參與計劃服務
- 審核和可靠性保證服務
- 社區活動及體驗式服務
- 最終用戶
- 軟體與技術
- 媒體與出版
- 專業組織和會員組織
- 消費品牌和零售商
- 金融服務
- 醫療保健和生命科學
- 教育
- 其他最終用戶
- 按地區
- 北美洲
- 美國
- 加拿大
- 墨西哥
- 南美洲
- 巴西
- 阿根廷
- 哥倫比亞
- 智利
- 其他南美國家
- 歐洲
- 德國
- 英國
- 法國
- 義大利
- 西班牙
- 俄羅斯
- 荷蘭
- 北歐的
- 其他歐洲國家
- 亞太地區
- 中國
- 日本
- 印度
- 韓國
- 澳洲
- 新加坡
- 印尼
- 其他亞太國家
- 中東
- 沙烏地阿拉伯
- 阿拉伯聯合大公國
- 土耳其
- 以色列
- 其他中東國家
- 非洲
- 南非
- 奈及利亞
- 肯亞
- 埃及
- 其他非洲國家
- 北美洲
第6章 競爭情勢
- 市場集中度
- 策略趨勢
- 市佔率分析
- 公司簡介
- FeverBee Limited
- Bevy Labs, Inc.
- CMX Media, Inc.
- Commsor, Inc.
- Orbit Marketing Inc.
- Common Room, Inc.
- Higher Logic, LLC
- Khoros, LLC
- Hivebrite SAS
- Gainsight, Inc.
- Discourse Hosting, Inc.
- Bettermode Inc.
- Mighty Networks, Inc.
- Mobilize Networks, Inc.
- Influitive Corporation
- Zapnito Ltd.
- Disciple Media Ltd.
- Standing On Giants Ltd
- The Community Roundtable LLC
- Clocktower Advisors LLC
第7章 市場機會與未來展望
According to Mordor Intelligence, the community growth services market size is projected to expand from USD 2.13 billion in 2025 to USD 2.46 billion in 2026, and to USD 5.22 billion by 2031, registering a CAGR of 16.17% between 2026 and 2031.
This report is Segmented by Service Type (Community Acquisition Services, Engagement Program Services, Moderation and Trust Services, and More), End User (Software and Technology, Media and Publishing, Professional Associations and Membership Organizations, Consumer Brands and Retail, Financial Services, and More), and Geography. The Market Forecasts are Provided in Terms of Value (USD).
Global Community Growth Services Market Trends and Insights
Rising Enterprise Focus on Retention-Led Growth
Retention has become a central growth metric for many software and technology companies, creating sustained demand for community specialists who can connect program activity to customer outcomes. A community gives customers a place to learn from peers, resolve issues, and build closer ties to a vendor's products without relying solely on formal support channels. Gainsight reported that highly active members who contributed peer-to-peer solutions were less likely to churn than customers who did not participate. This pattern can make a community harder to replace because customer relationships, practical knowledge, and user confidence accumulate over time within a vendor-led environment. Zoom and Cognite used Gainsight Customer Communities and Skilljar to link peer access with structured learning, which strengthened the use of education and support during renewal decisions. The community growth services market, therefore, rewards providers that build retention measures into program design, align them with customer success teams, establish a common account of what member activity means, and report results before annual contract reviews, making the community program easier to position as part of the customer relationship instead of a separate communications activity.
Growing Preference for Peer Support and Case Deflection
Peer support can protect community budgets by reducing the volume of cases sent to formal support teams and making the resulting savings easier to discuss with finance leaders. Salesforce stated that peer-to-peer forums can deflect 20%-28% of support tickets when they operate at scale. Higher Logic's method measures direct savings through accepted answers and average ticket cost, while also considering the value of content page views that may prevent future cases. This approach gives finance teams a clearer way to assess a program that creates value across support, customer success, and product teams, rather than within a single department. FeverBee reported that a structured moderation and friction program increased the retrieval of community content by organizational AI systems by 55%. The community growth services market has room for providers that combine support savings with well-governed knowledge, clearer content structures, and evidence that can improve internal AI outputs, because the value depends on maintaining accurate answers, making useful content easy to find, and applying moderation practices that limit low-quality material before it affects the knowledge base as it develops through member participation and formal content review.
Proving Community ROI Under Flat Marketing Budgets
Community programs compete for funding with channels that offer direct and familiar performance measures, particularly when marketing budgets are flat. Their value can appear across support deflection, retention, advocacy, product feedback, and search visibility, which makes a single attribution model difficult for many organizations to establish. Higher Logic explains that direct ticket savings can be measured by accepted answers and the average ticket cost, while indirect savings require program-specific activity assumptions. Community networks often produce their strongest results after members and content reach sufficient scale, which can conflict with short budget cycles and quarterly planning expectations. Providers can reduce this issue by defining metrics, baselines, ownership, and attribution logic before inviting members into a program. The community growth services market remains exposed when providers present measurement as a later reporting task instead of a core service component that guides operational decisions, since without an agreed starting point and regular reporting process, teams can struggle to explain whether changes in participation, support activity, or retention are linked to the service program and whether reported results can be used in future budget decisions.
Other drivers and restraints analyzed in the detailed report include:
- AI-Enabled Personalization and Community Operations
- Expansion of Hybrid Events and Always-On Member Experiences
- Data Privacy, Compliance, and Brand Safety Burdens
For complete list of drivers and restraints, kindly check the Table Of Contents.
Segment Analysis
Community Acquisition Services accounted for 38.27% of revenue in 2025 within the community growth services market. The leading position reflects the need to establish a member base before engagement, moderation, and advocacy services can deliver results. Acquisition programs cover onboarding journeys, member value propositions, and early activation triggers. Enterprises often seek external specialists because these activities require dedicated community planning that general marketing agencies may not provide.
Employee Advocacy Programs are projected to expand at a 17.28% CAGR within Engagement Program Services between 2026 and 2031. DSMN8 reported that 68% of advocates shared 3 or more times each week in 2026, an increase of 13 percentage points from the prior year. Sprinklr stated that L'Oreal's advocacy program generated more than 33 million organic impressions and a 4x return on investment across 18 months with more than 900 ambassadors. Moderation and Trust Services are gaining relevance as synthetic content and larger communities require more specialized oversight. Community Events and Experience Services are also extending beyond annual meetings, which supports ongoing work across event design, platform administration, and logistics. Across these services, the community growth services industry is moving toward continuous managed delivery that can support longer contracts and higher service value in the community growth services market.
Complete Report Scope:
- By Service Type
- Community Acquisition Services
- Engagement Program Services
- Moderation and Trust Services
- Community Events and Experience Services
- By End User
- Software and Technology
- Media and Publishing
- Professional Associations and Membership Organizations
- Consumer Brands and Retail
- Financial Services
- Healthcare and Life Sciences
- Education
- Other End Users
- By Geography
- North America
- United States
- Canada
- Mexico
- South America
- Brazil
- Argentina
- Colombia
- Chile
- Rest of South America
- Europe
- Germany
- United Kingdom
- France
- Italy
- Spain
- Russia
- Netherlands
- Nordics
- Rest of Europe
- Asia-Pacific
- China
- Japan
- India
- South Korea
- Australia
- Singapore
- Indonesia
- Rest of Asia-Pacific
- Middle East
- Saudi Arabia
- United Arab Emirates
- Turkey
- Israel
- Rest of Middle East
- Africa
- South Africa
- Nigeria
- Kenya
- Egypt
- Rest of Africa
- North America
Geography Analysis
North America held 48.04% of the community growth services market share in 2025. The region has a large concentration of SaaS businesses, enterprise buyers, and community platform vendors. Their proximity has supported shared professional practices, tools, and procurement approaches. The United States remains the main contributor, with Gainsight, Higher Logic, Bevy, Khoros, and Influitive serving buyers from growth-stage SaaS companies to Fortune 500 enterprises, while Canada is adding demand through its financial technology and SaaS sectors.
Europe is the second-largest regional market, led by the United Kingdom, Germany, France, and the Nordic countries. The Digital Services Act has affected community governance, moderation, and data handling requirements across Europe. Germany and the Nordic countries show demand for professional associations and B2B programs that support knowledge exchange and peer validation. France's software ecosystem is increasing community investment as organizations recognize community operations as a distinct business function within the community growth services market. South American demand is centered on Brazil, followed by Argentina and Colombia, where digital transformation is creating early enterprise programs in the community growth services market.
Asia-Pacific is projected to expand at a CAGR of 17.04% between 2026 and 2031, making it the fastest-growing region. India and Southeast Asia are increasing SaaS adoption, while professional association networks are expanding across the community growth services market in the region. SaaS companies in the region are building community programs that serve both local users and global customer bases. Regional differences in customer expectations and program maturity create demand for service models that can adapt to local market operating conditions. India benefits from SaaS startups and IT services firms serving global customers, while South Korea and Singapore are early adopters of enterprise platforms. The Middle East and Africa remain at earlier stages, with the UAE, Saudi Arabia, and South Africa acting as key demand centers under national digital transformation programs.
- FeverBee Limited
- Bevy Labs, Inc.
- CMX Media, Inc.
- Commsor, Inc.
- Orbit Marketing Inc.
- Common Room, Inc.
- Higher Logic, LLC
- Khoros, LLC
- Hivebrite SAS
- Gainsight, Inc.
- Discourse Hosting, Inc.
- Bettermode Inc.
- Mighty Networks, Inc.
- Mobilize Networks, Inc.
- Influitive Corporation
- Zapnito Ltd.
- Disciple Media Ltd.
- Standing On Giants Ltd
- The Community Roundtable LLC
- Clocktower Advisors LLC
Additional Benefits:
- The market estimate (ME) sheet in Excel format
- 3 months of analyst support
TABLE OF CONTENTS
1 INTRODUCTION
- 1.1 Study Assumptions and Market Definition
- 1.2 Scope of the Study
2 RESEARCH METHODOLOGY
3 EXECUTIVE SUMMARY
4 MARKET LANDSCAPE
- 4.1 Market Overview
- 4.2 Market Drivers
- 4.2.1 Rising Enterprise Focus on Retention-Led Growth
- 4.2.2 Growing Preference for Peer Support and Case Deflection
- 4.2.3 AI-Enabled Personalization and Community Operations
- 4.2.4 Expansion of Hybrid Community Events and Always-On Member Experiences
- 4.2.5 Owned Communities Becoming a Hedge Against Zero-Click Discovery and Algorithm Volatility
- 4.2.6 First-Party Interaction Data Becoming Strategic Training Fuel for AI-Led Go-to-Market Systems
- 4.3 Market Restraints
- 4.3.1 Proving Community ROI Under Flat Marketing Budgets
- 4.3.2 Data Privacy, Compliance, and Brand Safety Burdens
- 4.3.3 Higher Moderation Cost from Online Safety Rules and Synthetic Abuse Risk
- 4.3.4 Fragmented Tool Stacks and Attribution Blind Spots Across Community, CRM, and Event Data
- 4.4 Industry Value Chain Analysis
- 4.5 Impact of Macroeconomic Factors on the Market
- 4.6 Regulatory Landscape
- 4.7 Technological Outlook
- 4.8 Porter's Five Forces Analysis
- 4.8.1 Threat of New Entrants
- 4.8.2 Bargaining Power of Buyers
- 4.8.3 Bargaining Power of Suppliers
- 4.8.4 Threat of Substitutes
- 4.8.5 Intensity of Competitive Rivalry
5 MARKET SIZE AND GROWTH FORECASTS (VALUE)
- 5.1 By Service Type
- 5.1.1 Community Acquisition Services
- 5.1.2 Engagement Program Services
- 5.1.3 Moderation and Trust Services
- 5.1.4 Community Events and Experience Services
- 5.2 By End User
- 5.2.1 Software and Technology
- 5.2.2 Media and Publishing
- 5.2.3 Professional Associations and Membership Organizations
- 5.2.4 Consumer Brands and Retail
- 5.2.5 Financial Services
- 5.2.6 Healthcare and Life Sciences
- 5.2.7 Education
- 5.2.8 Other End Users
- 5.3 By Geography
- 5.3.1 North America
- 5.3.1.1 United States
- 5.3.1.2 Canada
- 5.3.1.3 Mexico
- 5.3.2 South America
- 5.3.2.1 Brazil
- 5.3.2.2 Argentina
- 5.3.2.3 Colombia
- 5.3.2.4 Chile
- 5.3.2.5 Rest of South America
- 5.3.3 Europe
- 5.3.3.1 Germany
- 5.3.3.2 United Kingdom
- 5.3.3.3 France
- 5.3.3.4 Italy
- 5.3.3.5 Spain
- 5.3.3.6 Russia
- 5.3.3.7 Netherlands
- 5.3.3.8 Nordics
- 5.3.3.9 Rest of Europe
- 5.3.4 Asia-Pacific
- 5.3.4.1 China
- 5.3.4.2 Japan
- 5.3.4.3 India
- 5.3.4.4 South Korea
- 5.3.4.5 Australia
- 5.3.4.6 Singapore
- 5.3.4.7 Indonesia
- 5.3.4.8 Rest of Asia-Pacific
- 5.3.5 Middle East
- 5.3.5.1 Saudi Arabia
- 5.3.5.2 United Arab Emirates
- 5.3.5.3 Turkey
- 5.3.5.4 Israel
- 5.3.5.5 Rest of Middle East
- 5.3.6 Africa
- 5.3.6.1 South Africa
- 5.3.6.2 Nigeria
- 5.3.6.3 Kenya
- 5.3.6.4 Egypt
- 5.3.6.5 Rest of Africa
- 5.3.1 North America
6 COMPETITIVE LANDSCAPE
- 6.1 Market Concentration
- 6.2 Strategic Moves
- 6.3 Market Share Analysis
- 6.4 Company Profiles (includes Global Level Overview, Market Level Overview, Core Segments, Financials as available, Strategic Information, Market Rank/Share, Products and Services, Recent Developments)
- 6.4.1 FeverBee Limited
- 6.4.2 Bevy Labs, Inc.
- 6.4.3 CMX Media, Inc.
- 6.4.4 Commsor, Inc.
- 6.4.5 Orbit Marketing Inc.
- 6.4.6 Common Room, Inc.
- 6.4.7 Higher Logic, LLC
- 6.4.8 Khoros, LLC
- 6.4.9 Hivebrite SAS
- 6.4.10 Gainsight, Inc.
- 6.4.11 Discourse Hosting, Inc.
- 6.4.12 Bettermode Inc.
- 6.4.13 Mighty Networks, Inc.
- 6.4.14 Mobilize Networks, Inc.
- 6.4.15 Influitive Corporation
- 6.4.16 Zapnito Ltd.
- 6.4.17 Disciple Media Ltd.
- 6.4.18 Standing On Giants Ltd
- 6.4.19 The Community Roundtable LLC
- 6.4.20 Clocktower Advisors LLC
7 MARKET OPPORTUNITIES AND FUTURE OUTLOOK
- 7.1 White-Space and Unmet-Need Assessment

 全球商務社交應用市場規模、佔有率、趨勢和成長分析報告(2026-2034)
 社群網路應用市場規模、佔有率和成長分析:按應用程式類型、獲利模式、平台和地區分類-2026-2033年產業預測
 企業社交網路市場:按組件、部署類型、組織規模和最終用戶分類-2026年至2032年全球預測
 2026年全球企業社交網路市場報告2026年全球創作者空間市場報告
 專業人脈網路:市場佔有率分析、產業趨勢與統計、成長預測(2026-2031)
 企業社交網路市場分析及預測(至2035年):依類型、產品類型、服務、技術、組件、應用、部署類型、最終用戶及功能分類社交網路應用市場分析及預測(至2035年):按類型、產品類型、服務、技術、組件、應用、設備、部署類型和最終用戶分類
 全球 Mighty Networks 和 Circle 市場:未來預測(至 2032 年)—按產品類型、功能集、用例、技術、最終用戶和地區進行分析
 全球社交網路應用市場