


 |
市場調查報告書
商品編碼
2118948
OTT內容傳遞網路:市場佔有率分析、產業趨勢與統計及成長預測(2026-2031年)CDN For OTT - Market Share Analysis, Industry Trends & Statistics, Growth Forecasts (2026 - 2031) |
||||||

※ 本網頁內容可能與最新版本有所差異。詳細情況請與我們聯繫。
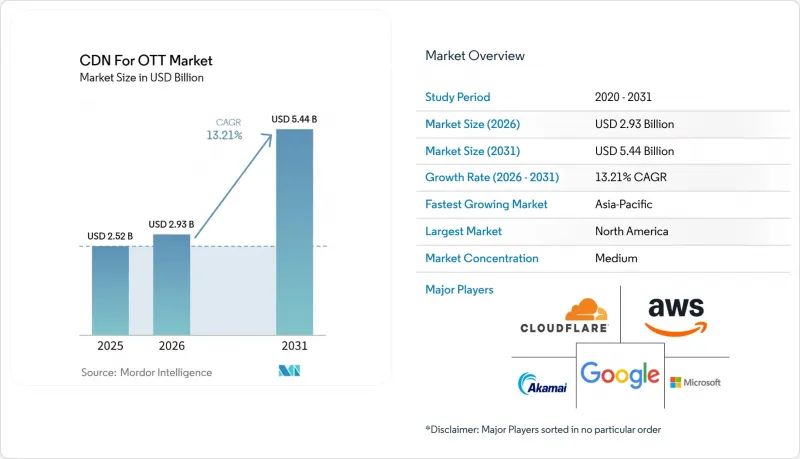
根據 Mordor Intelligence 預測,OTT 市場的 CDN 市場規模預計將從 2025 年的 25.2 億美元和 2026 年的 29.3 億美元成長到 2031 年的 54.4 億美元,2026 年至 2031 年的年複合成長率(CAGR)為 13.3%。
本報告按產品/服務(解決方案和服務)、串流媒體類型(視訊點播、直播影片串流、線性及快速頻道串流媒體等)、最終用戶(OTT影片串流平台、廣播公司和付費電視提供商、數位媒體、社交影片和創作平台、音樂和音訊串流平台等)以及地區進行細分。市場預測以美元計價。
全球OTT CDN市場趨勢與洞察
OTT影片流量以及4K和8K的普及。
串流媒體傳輸在解析度和會話數量方面都在不斷發展,這直接影響CDN快取架構。到2025年,1080p HDR將成為許多實況活動的標準,OTT市場的CDN正在做出相應調整,服務提供者也在為更廣泛地使用高級轉碼器做好準備。 Netflix宣布,到2025年,其近30%的串流媒體將使用AV1格式。 AV1格式可以降低每個串流媒體的頻寬,但這需要重新設計快取配置、裝置認證和多層打包機制。在2022年至2024年的成本削減期間推遲4K升級的服務供應商,由於其邊緣快取必須支援多種轉碼器器,因此現代化改造的寬限期更短。這種需求使得能夠協調不同設備之間的格式、快取放置和效能監控的軟體功能至關重要,尤其是在需要將同一節目傳輸到智慧電視、行動電話、瀏覽器和舊款消費級硬體時。此外,尤其當一個平台必須同時支援舊設備和新設備時,這意味著僅僅增加傳輸容量並不能保證交付品質。
對低延遲直播和互動媒體的需求
與視訊點播相比,直播的傳輸要求有所不同,因為直播內容需要在需求高峰到來之前更接近觀眾。要在 5 秒內實現端對端直播傳輸,邊緣節點必須位於距離觀眾 200 公里以內,而視訊點播可以容忍 500 毫秒的冷快取載入。這項限制意味著,實況活動的合約正在轉向那些在邊緣網路中擁有密集且可靠的本地容量的供應商,因為觀眾需要對體育賽事直播、內容創作者驅動的內容以及其他對時間要求較高的節目的延遲做出即時反應。體育賽事版權所有擁有者越來越需要亞秒傳輸速度,以滿足賽中投注和互動疊加的需求,這帶來了獨特的採購需求。 OTT(Over-The-Top)市場的 CDN 可以透過將直播視為一個獨立的工作負載,擁有自己的路由、快取鍵和災難復原需求,而不是將其視為點播目錄內容分發模式的延伸,從而最大限度地發揮其優勢。
主要OTT平台的CDN內部資源
主流OTT平台正在減少對商業CDN的依賴,這給第三方分發提供者帶來了結構性限制。到2025年,Netflix的Open Connect網路將透過其位於6000多個地點的18,000多台自有伺服器處理其全球95%的流量。亞馬遜也計劃在2025年將其Prime Video流量的更大比例遷移到AWS CloudFront。同時,蘋果也規劃了一個混合私有骨幹網,該網將結合其自有基礎設施和精心挑選的第三方容量。此外,到2025年,主流平台也將多CDN堆疊中的供應商數量從4-6家減少到2-3家。這給剩餘的供應商帶來了流量和價格方面的雙重壓力,使得服務可靠性成為維持資源分配的關鍵因素。對於流量管理量低於1Tbps的OTT發行商而言,CDN在OTT市場仍有需求空間。對於這些出版商而言,建立自己的配送網路在經濟上不切實際,而且可能會分散經營團隊對內容獲取、用戶成長和服務營運的注意力。能夠有效服務這一中端市場的供應商可以降低失去與大型平台合約的風險。
細分市場分析
到2025年,該解決方案將佔據OTT CDN市場72.38%的佔有率,涵蓋媒體分發和邊緣快取、多CDN管理和流量控制、串流媒體安全和存取控制,以及分發分析和效能最佳化。這反映出平台不僅需要提供傳輸容量,還需要管理分發邏輯,因為效能取決於路由選擇、串流保護、容錯能力以及對觀看體驗的即時測量。由於平台在多個地區運營,並且必須快速響應不斷變化的用戶行為,因此這種協調對於OTT市場的CDN變得越來越重要。隨著中型OTT業者在國家和單一網際服務供應商(ISP)層級分配流量,對多CDN管理和流量控制的需求也不斷成長。在ACM IMC 2025上發表的研究表明,基於強化學習的CDN選擇將視訊點播觀看體驗品質提高了48%,並將直播串流的緩衝次數減少了十倍。此外,由於盜版和撞人員編制攻擊可能會擾亂實況活動的盈利,串流媒體安全和存取控制已經不僅僅是許可的問題了。
預計到2031年,服務業的複合年成長率將達到13.91%,成為成長最快的服務子產業。隨著營運商對多CDN管理、源站狀態監控以及實況活動期間的即時容錯移轉等功能的需求不斷成長,OTT服務的CDN市場規模預計將持續擴大。對於擁有廣播技術經驗但缺乏雲端原生CDN配置DevOps能力的廣播公司和付費電視供應商而言,這種轉變尤其重要。這些客戶通常需要針對數位版權管理、區域限制、效能保障和事件回應等方面的託管支持,尤其是在大規模活動需要快速調整容量、路由和存取策略時。他們的需求往往傾向於那些能夠將營運支援與交付平台結合的提供者。因此,在OTT產業的CDN領域,服務團隊不僅可以透過建構複雜的交付環境來創造更大、更永續的價值,還可以透過幫助客戶運作這些環境來創造價值。
區域分析
到2025年,北美將佔據OTT CDN市場佔有率的37.74%。這主要得益於北美大規模超大規模資料中心業者深厚的資源儲備。北美主要平台設定的合約條款會影響國際分配和交付定價,因為這些帳戶的規模會影響其他地區的容量規劃、供應商選擇和商業性基準測試。到2025年,美國光纖普及率將達到27%,主要都會大都會圈的5G部署率將超過60%,從而支援更穩定的4K HDR內容交付。包括CCPA在內的安全和隱私要求正在推動整合交付和保護功能的邊緣平台的普及,這種環境不僅支援核心內容傳送,也支援區域營運需求。因此,大規模買家的需求以及雲端和接取網路基礎設施的廣泛可用性正在重塑北美OTT市場的CDN格局。
預計到2031年,亞太地區將以13.96%的複合年成長率成長,成為成長最快的區域市場。該地區OTT(Over-The-Top)CDN市場的規模成長主要得益於5G部署、直播電商以及部分國家/地區末端基礎設施的低度開發。儘管中國擁有眾多本土供應商,但區域營運商可受惠於本地資料處理需求和多樣化的網路結構。這種情況凸顯了能夠適應各國特定網路和合規要求的交付模式的重要性。在東南亞,直播電商和社交視訊活動蓬勃發展,即使在用戶需求激增的情況下,也需要強大的本地交付能力和可靠的效能。
在歐洲,英國、德國、法國和北歐國家對GDPR資料在地化的解讀,以及從廣播到網際網路協定(IP)傳輸的轉變,正在重塑市場格局。第44條對跨國資料傳輸的限制,可能需要在歐盟管轄範圍內設立本地存取點(PoP)來處理觀看資料。在南美洲,由於當地基礎設施較為有限,CDN定價高於北美,但對區域網際網路交換中心的投資可以縮小這一差距。隨著CDNetworks在北非實現全面網路覆蓋,並在2026年1月於衣索比亞、蘇丹、加納和多哥開設接入點,中東和非洲地區的重要性日益凸顯。在這些地區,本地容量、合規性和網路夥伴關係關係與全球同等重要,因為本地接入點可以提升效能,並幫助服務提供者滿足特定國家的要求。
其他好處:
- Excel格式的市場預測(ME)表
- 3個月的分析師支持
目錄
第1章:引言
- 研究假設和市場定義
- 調查範圍
第2章:調查方法
第3章執行摘要
第4章 市場狀況
- 市場概覽
- 市場促進因素
- OTT影片流量的爆炸性成長和4K/8K的普及
- 對低延遲直播和互動媒體的需求日益成長
- 5G、光纖和邊緣基礎設施的擴展
- CDN、零信任安全與網路應用程式保護整合
- 面向影片工作負載的AI最佳化路由和語義快取
- 開放網路API和邊緣容量規劃,並考慮能源效率。
- 市場限制因素
- 主流OTT平台正在開發自己的CDN能力。
- 產品價格承壓,利潤率受擠壓
- 新興市場的最後一公里頻寬瓶頸
- 資料中心能源上限和永續性法規
- 產業價值鏈分析
- 宏觀經濟因素對市場的影響
- 監理情勢
- 技術展望
- 波特五力分析
第5章 市場規模與成長預測
- 報價
- 解決方案
- 媒體分發和邊緣快取
- 多CDN管理和流量控制
- 串流媒體安全和存取控制
- 配送分析和效能最佳化
- 服務
- 解決方案
- 按串流媒體類型
- 視訊點播
- 即時影片串流
- 線性及快速頻道串流媒體
- 音訊串流
- 最終用戶
- OTT影片串流平台
- 廣播公司及付費電視業者
- 數位媒體、社群影片、創作者平台
- 音樂和音訊串流平台
- 企業和教育機構
- 按地區
- 北美洲
- 美國
- 加拿大
- 墨西哥
- 南美洲
- 巴西
- 阿根廷
- 其他南美國家
- 歐洲
- 德國
- 英國
- 法國
- 義大利
- 西班牙
- 俄羅斯
- 其他歐洲國家
- 亞太地區
- 中國
- 日本
- 印度
- 韓國
- 印尼
- 澳洲
- 其他亞太國家
- 中東
- 土耳其
- 沙烏地阿拉伯
- 阿拉伯聯合大公國
- 其他中東國家
- 非洲
- 南非
- 奈及利亞
- 埃及
- 其他非洲國家
- 北美洲
第6章 競爭情勢
- 市場集中度
- 策略趨勢
- Market Positioning Analysis
- 公司簡介
- Akamai Technologies, Inc.
- Cloudflare, Inc.
- Amazon Web Services, Inc.
- Google LLC
- Microsoft Corporation
- Fastly, Inc.
- Wangsu Science and Technology Co., Ltd.
- CDNetworks Co., Ltd.
- Tata Communications Limited
- Verizon Communications Inc.
- AT&T Inc.
- Alibaba Cloud(Singapore)Private Limited
- Tencent Cloud Computing(Beijing)Co., Ltd.
- Gcore SA
- Broadpeak
- Imperva, Inc.
- Mux, Inc.
- Quantil, Inc.
- BunnyWay doo
- Qwilt, Inc.
第7章 市場機會與未來展望
According to Mordor Intelligence, the CDN for the OTT market size is projected to expand from USD 2.52 billion in 2025 and USD 2.93 billion in 2026 to USD 5.44 billion by 2031, registering a CAGR of 13.21% between 2026 and 2031.
This report is Segmented by Offering (Solutions, and Services), Streaming Type (Video On Demand, Live Video Streaming, Linear and FAST Channel Streaming, and More), End User (OTT Video Streaming Platforms, Broadcasters and Pay-TV Providers, Digital Media, Social Video and Creator Platforms, Music and Audio Streaming Platforms, and More), and Geography. The Market Forecasts are Provided in Terms of Value (USD).
Global CDN For OTT Market Trends and Insights
OTT Video Traffic and 4K and 8K Adoption
Streaming delivery is changing at the resolution and session-count layers, with direct implications for CDN cache architecture. The CDN for the OTT market is adapting as 1080p HDR became the baseline for many live events in 2025, while providers also prepare for wider use of advanced codecs. Netflix stated that nearly 30% of its streams used AV1 by 2025, a format that can reduce bandwidth per stream but requires revised cache configurations, device certification, and multiple packaging tiers. Providers that postponed 4K upgrades during the 2022-2024 cost-control period now face a shorter modernization window because edge caches must serve multiple codec variants. This need favors software capabilities that coordinate formats, cache placement, and performance monitoring across different devices, especially when the same program must reach connected televisions, mobile phones, browsers, and older consumer hardware. It also means that delivery quality depends on more than adding transport capacity, especially when platforms must support both legacy and newer devices.
Low-Latency Live Streaming and Interactive Media Demand
Live streaming creates a delivery requirement that differs from video on demand, as content must move closer to viewers before demand peaks. Achieving end-to-end live delivery below 5 seconds requires an edge node within 200 km of the viewer, while video on demand can tolerate a 500 ms cold-cache fetch. This constraint directs live-event contracts toward operators with dense edge footprints and dependable local capacity, since viewers respond immediately to delay during sports, creator broadcasts, and other time-sensitive programming. Sports rights holders increasingly need sub-second delivery to support in-play betting and interactive overlays, which creates a specialized procurement need. The CDN for the over-the-top (OTT) market benefits when live delivery is treated as a distinct workload with its own routing, cache keys, and failure-recovery requirements, rather than as an extension of the delivery model for on-demand catalog content.
Large OTT Platform CDN In-Sourcing
Large OTT platforms are reducing their reliance on commercial CDNs, creating a structural constraint for third-party delivery providers. Netflix's Open Connect network handled 95% of its global traffic through more than 18,000 proprietary servers in more than 6,000 locations by 2025. Amazon moved a larger share of Prime Video traffic to AWS CloudFront during 2025, while Apple described a hybrid private backbone that uses selective third-party capacity alongside its own infrastructure. Large platforms also reduced vendor counts in multi-CDN stacks from 4-6 to 2-3 providers in 2025, placing retained suppliers under both volume and price pressure and making service reliability a central condition for retaining an allocation. The CDN for the OTT market still has room among publishers managing under 1 Tbps, where building a proprietary delivery network remains economically impractical and would divert management attention away from content acquisition, audience growth, and service operations. Vendors that serve this mid-market well can reduce their exposure to the loss of the largest platform accounts.
Other drivers and restraints analyzed in the detailed report include:
- 5G, Fiber, and Edge Infrastructure Expansion
- CDN, Zero-Trust Security, and Web Application Protection Bundling
- Commodity Pricing Pressure and Margin Squeeze
For complete list of drivers and restraints, kindly check the Table Of Contents.
Segment Analysis
Solutions commanded 72.38% of the CDN for OTT market share in 2025 and covered media delivery and edge caching, multi-CDN management and traffic steering, streaming security and access control, and delivery analytics and performance optimization. This position reflects the need for platforms to manage delivery logic rather than simply acquire transport capacity, because performance depends on selecting routes, protecting streams, handling failures, and measuring viewer experience in real time, and the CDN for the OTT market increasingly values this coordination when platforms operate across several regions and must respond quickly to changes in audience behavior. Multi-CDN management and traffic steering are gaining in demand as mid-sized OTT operators allocate traffic at the country or individual internet service provider level. Research published at ACM IMC 2025 found that reinforcement-learning-based CDN selection improved video-on-demand quality of experience by 48% and reduced live-streaming rebuffering events by 10x. Streaming security and access control have also moved beyond a licensing function because piracy and credential-stuffing attacks can disrupt monetization during live events.
Services are projected to record a CAGR of 13.91% through 2031, making them the fastest-growing offering subsegment. The CDN market size for OTT services is projected to expand as operators need support for multi-CDN management, origin health monitoring, and real-time failover during live events. The shift is especially relevant to broadcasters and pay-TV providers that have broadcast engineering experience but limited DevOps capacity for cloud-native CDN configurations. These customers often need managed support for digital rights management, geographic restrictions, performance assurance, and incident response, particularly when a major event requires rapid changes to capacity, routing, and access policy. Their requirements can favor providers that pair operational support with a delivery platform. The CDN for the OTT industry can therefore derive greater recurring value when service teams help customers operate complex delivery environments rather than just deploy them.
Complete Report Scope:
- By Offering
- Solutions
- Media Delivery and Edge Caching
- Multi-CDN Management and Traffic Steering
- Streaming Security and Access Control
- Delivery Analytics and Performance Optimization
- Services
- Solutions
- By Streaming Type
- Video on Demand
- Live Video Streaming
- Linear and FAST Channel Streaming
- Audio Streaming
- By End User
- OTT Video Streaming Platforms
- Broadcasters and Pay-TV Providers
- Digital Media, Social Video and Creator Platforms
- Music and Audio Streaming Platforms
- Enterprises and Education Providers
- By Geography
- North America
- United States
- Canada
- Mexico
- South America
- Brazil
- Argentina
- Rest of South America
- Europe
- Germany
- United Kingdom
- France
- Italy
- Spain
- Russia
- Rest of Europe
- Asia-Pacific
- China
- Japan
- India
- South Korea
- Indonesia
- Australia
- Rest of Asia-Pacific
- Middle East
- Turkey
- Saudi Arabia
- United Arab Emirates
- Rest of Middle East
- Africa
- South Africa
- Nigeria
- Egypt
- Rest of Africa
- North America
Geography Analysis
North America held 37.74% of the OTT CDN market share in 2025, supported by the presence of large OTT platforms and a deep base of hyperscaler-affiliated capacity. Contract terms set by major North American platforms can influence international allocations and delivery pricing, since the scale of these accounts affects capacity planning, vendor selection, and the commercial benchmarks used in other regions. US fiber penetration reached 27% of households in 2025, while 5G deployment exceeded 60% of major metropolitan areas, supporting more consistent 4K HDR delivery. Security and privacy requirements, including CCPA-related expectations, are driving unified edge platforms that combine delivery and protection, and this environment supports regional operational needs alongside core content delivery. Large buyer requirements and the broad availability of cloud and access-network infrastructure, therefore, shape the CDN for the OTT market in North America.
Asia-Pacific is projected to expand at a CAGR of 13.96% through 2031, making it the fastest-growing regional market. The CDN for the over-the-top (OTT) market size in the region is supported by 5G deployment, live-commerce streaming, and underdeveloped last-mile infrastructure in several countries. China has a large domestic provider base, while regional operators can benefit from local data-processing requirements and varied network structures. These conditions increase the need for delivery models that can adapt to country-level network and compliance requirements. Southeast Asian platforms are managing more live commerce and social video activity, which requires resilient local delivery and dependable performance during sudden increases in viewer demand.
Europe is shaped by interpretations of the GDPR on data localization and the migration from broadcast to internet protocol delivery in the UK, Germany, France, and the Nordic countries. Article 44 restrictions on cross-border transfers can require localized points of presence that process viewing data within the EU jurisdiction. South America faces higher CDN prices than North America because local infrastructure is more limited, though regional internet exchange investment can narrow this gap. The Middle East and Africa are gaining importance as CDNetworks achieved full network coverage in North Africa and launched points of presence in Ethiopia, Sudan, Ghana, and Togo in January 2026. These regions offer opportunities where local capacity, compliance, and network partnerships matter as much as global scale, since local points of presence can improve performance and help providers address requirements that differ from one country to another.
- Akamai Technologies, Inc.
- Cloudflare, Inc.
- Amazon Web Services, Inc.
- Google LLC
- Microsoft Corporation
- Fastly, Inc.
- Wangsu Science and Technology Co., Ltd.
- CDNetworks Co., Ltd.
- Tata Communications Limited
- Verizon Communications Inc.
- AT&T Inc.
- Alibaba Cloud (Singapore) Private Limited
- Tencent Cloud Computing (Beijing) Co., Ltd.
- Gcore S.A.
- Broadpeak
- Imperva, Inc.
- Mux, Inc.
- Quantil, Inc.
- BunnyWay d.o.o.
- Qwilt, Inc.
Additional Benefits:
- The market estimate (ME) sheet in Excel format
- 3 months of analyst support
TABLE OF CONTENTS
1 INTRODUCTION
- 1.1 Study Assumptions and Market Definition
- 1.2 Scope of the Study
2 RESEARCH METHODOLOGY
3 EXECUTIVE SUMMARY
4 MARKET LANDSCAPE
- 4.1 Market Overview
- 4.2 Market Drivers
- 4.2.1 Explosion of OTT Video Traffic and 4K/8K Adoption
- 4.2.2 Rising Demand for Low-Latency Live Streaming and Interactive Media
- 4.2.3 Expansion of 5G, Fiber, and Edge Infrastructure
- 4.2.4 Bundling of CDN, Zero-Trust Security, and Web Application Protection
- 4.2.5 AI-Optimized Routing and Semantic Caching for Video Workloads
- 4.2.6 Network-API Exposure and Energy-Aware Edge Capacity Planning
- 4.3 Market Restraints
- 4.3.1 Large OTT Platforms In-Sourcing CDN Capacity
- 4.3.2 Commodity Pricing Pressure and Margin Squeeze
- 4.3.3 Last-Mile Bandwidth Bottlenecks in Emerging Economies
- 4.3.4 Data-Center Energy Caps and Sustainability Mandates
- 4.4 Industry Value Chain Analysis
- 4.5 Impact of Macroeconomic Factors on the Market
- 4.6 Regulatory Landscape
- 4.7 Technological Outlook
- 4.8 Porter's Five Forces Analysis
- 4.8.1 Threat of New Entrants
- 4.8.2 Bargaining Power of Suppliers
- 4.8.3 Bargaining Power of Buyers
- 4.8.4 Threat of Substitutes
- 4.8.5 Intensity of Competitive Rivalry
5 MARKET SIZE AND GROWTH FORECASTS (VALUE)
- 5.1 By Offering
- 5.1.1 Solutions
- 5.1.1.1 Media Delivery and Edge Caching
- 5.1.1.2 Multi-CDN Management and Traffic Steering
- 5.1.1.3 Streaming Security and Access Control
- 5.1.1.4 Delivery Analytics and Performance Optimization
- 5.1.2 Services
- 5.1.1 Solutions
- 5.2 By Streaming Type
- 5.2.1 Video on Demand
- 5.2.2 Live Video Streaming
- 5.2.3 Linear and FAST Channel Streaming
- 5.2.4 Audio Streaming
- 5.3 By End User
- 5.3.1 OTT Video Streaming Platforms
- 5.3.2 Broadcasters and Pay-TV Providers
- 5.3.3 Digital Media, Social Video and Creator Platforms
- 5.3.4 Music and Audio Streaming Platforms
- 5.3.5 Enterprises and Education Providers
- 5.4 By Geography
- 5.4.1 North America
- 5.4.1.1 United States
- 5.4.1.2 Canada
- 5.4.1.3 Mexico
- 5.4.2 South America
- 5.4.2.1 Brazil
- 5.4.2.2 Argentina
- 5.4.2.3 Rest of South America
- 5.4.3 Europe
- 5.4.3.1 Germany
- 5.4.3.2 United Kingdom
- 5.4.3.3 France
- 5.4.3.4 Italy
- 5.4.3.5 Spain
- 5.4.3.6 Russia
- 5.4.3.7 Rest of Europe
- 5.4.4 Asia-Pacific
- 5.4.4.1 China
- 5.4.4.2 Japan
- 5.4.4.3 India
- 5.4.4.4 South Korea
- 5.4.4.5 Indonesia
- 5.4.4.6 Australia
- 5.4.4.7 Rest of Asia-Pacific
- 5.4.5 Middle East
- 5.4.5.1 Turkey
- 5.4.5.2 Saudi Arabia
- 5.4.5.3 United Arab Emirates
- 5.4.5.4 Rest of Middle East
- 5.4.6 Africa
- 5.4.6.1 South Africa
- 5.4.6.2 Nigeria
- 5.4.6.3 Egypt
- 5.4.6.4 Rest of Africa
- 5.4.1 North America
6 COMPETITIVE LANDSCAPE
- 6.1 Market Concentration
- 6.2 Strategic Moves
- 6.3 Market Positioning Analysis
- 6.4 Company Profiles (includes Global Level Overview, Market Level Overview, Core Segments, Financials as available, Strategic Information, Market Rank/Share, Products and Services, Recent Developments)
- 6.4.1 Akamai Technologies, Inc.
- 6.4.2 Cloudflare, Inc.
- 6.4.3 Amazon Web Services, Inc.
- 6.4.4 Google LLC
- 6.4.5 Microsoft Corporation
- 6.4.6 Fastly, Inc.
- 6.4.7 Wangsu Science and Technology Co., Ltd.
- 6.4.8 CDNetworks Co., Ltd.
- 6.4.9 Tata Communications Limited
- 6.4.10 Verizon Communications Inc.
- 6.4.11 AT&T Inc.
- 6.4.12 Alibaba Cloud (Singapore) Private Limited
- 6.4.13 Tencent Cloud Computing (Beijing) Co., Ltd.
- 6.4.14 Gcore S.A.
- 6.4.15 Broadpeak
- 6.4.16 Imperva, Inc.
- 6.4.17 Mux, Inc.
- 6.4.18 Quantil, Inc.
- 6.4.19 BunnyWay d.o.o.
- 6.4.20 Qwilt, Inc.
7 MARKET OPPORTUNITIES AND FUTURE OUTLOOK
- 7.1 White-Space and Unmet-Need Assessment

 全球內容傳遞網路(CDN) 市場規模、佔有率、趨勢和成長分析報告,2026-2034 年
 2026-2030年全球內容傳遞網路(CDN)市場
 內容傳遞網路(CDN) 安全性:市場佔有率分析、產業趨勢與統計資料以及成長預測 (2026-2031)內容傳送:市場佔有率分析、產業趨勢與統計、成長預測(2026-2031 年)
 商業P2P CDN市場-2026-2032年全球市場預測雲端內容傳遞網路市場:按元件、內容類型、部署模式、組織規模和最終用戶分類-2026-2032年全球市場預測內容傳遞網路(CDN) 市場:2026-2032 年全球市場預測(按服務類型、內容類型、部署模式、組織規模和最終用戶分類)
 2026年全球固定內容及應用市場報告全球商業P2P CDN市場規模、佔有率、趨勢和成長分析報告(2026-2034年)
 內容傳遞網路市場 - 全球產業規模、佔有率、趨勢、機會、預測:按組件、類型、服務供應商類型、最終用戶、內容類型、地區和競爭格局分類,2021-2031年