


 |
市場調查報告書
商品編碼
2117523
內容傳送:市場佔有率分析、產業趨勢與統計、成長預測(2026-2031 年)Content Distribution - Market Share Analysis, Industry Trends & Statistics, Growth Forecasts (2026 - 2031) |
||||||

※ 本網頁內容可能與最新版本有所差異。詳細情況請與我們聯繫。
根據 Mordor Intelligence 預測,內容傳送市場規模預計在 2025 年達到 1,132.5 億美元,2026 年達到 1,223.8 億美元,2031 年達到 1,694.1 億美元,2026 年至 2031 年的複合年成長率為 6.72%。
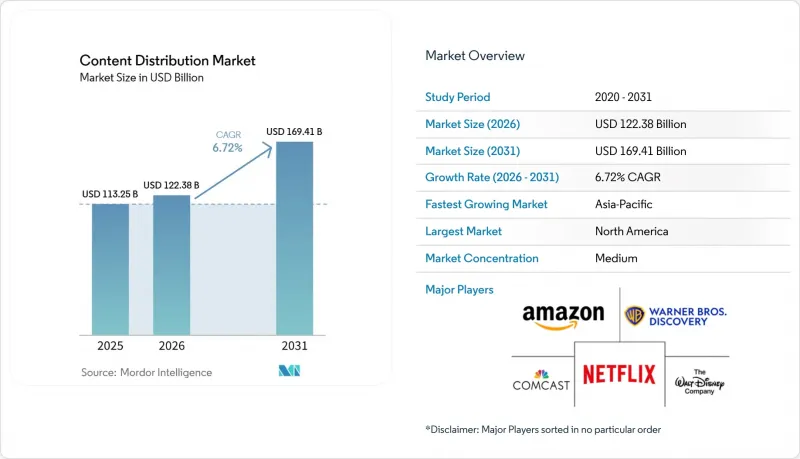
本報告按內容類型(影片內容、音訊內容、文字和圖像內容等)、分發管道(串流平台、電信業者、社群媒體和數位平台等)、授權模式(獨家授權、非獨家授權、夥伴關係授權、收益分成授權等)以及地區進行細分。市場預測以美元計價。
全球內容傳送市場趨勢與洞察
擴大OTT和CTV的內容獲利規模
廣告支援的串流媒體和聯網電視正在改變內容傳送市場的投資重點。這是因為分發商在評估內容時,如今對受眾盈利和表面覆蓋率給予了同等重視。 CW電視網與Roku於2026年4月簽署的合作協議清晰地體現了這一轉變。透過讓CW娛樂節目在第二天即可透過Roku頻道觀看,Roku頻道將把CW的覆蓋範圍擴大到美國超過一半的寬頻家庭。 Amagi報告稱,2026年FAST(廣告支援的串流媒體)的觀看量將增加21%,這支持了目錄影片和定時播放串流環境中廣告位可重複投放的獲利能力提升。這種轉變提高了優質直播內容、片庫資源和龐大片庫的價值,因為同一內容可以透過訂閱、AVOD和FAST三種方式產生收入。因此,在內容傳送市場,能夠將廣告位、平台覆蓋範圍和受眾數據整合到商業平台的企業備受青睞。
加快跨多個平台的版權打包
隨著版權被打包到電影、電視和數位發行管道,內容傳送市場傳統的順序視窗模式正在縮短。 Netflix 於 2026 年 1 月與SONY影視娛樂達成的全球「一次性付費」協議表明,擁有全球影響力的發行可以獲得多年優質的院線發行進入許可權,並擴大其在不同市場發行時間上的控制權。由於版權同時涵蓋串流媒體、廣播和廣告支援管道,發行在地理、格式和時間方面面臨更大的重疊。 Vubiquity 於 2025 年 9 月發布的「目錄智慧」更新透過將版權資料、資產可用性和標題元元資料整合到一個介面中,滿足了這一需求,使製片公司和內容擁有者能夠更快地確認發行準備。內容傳送市場正受益於此轉變,因為能夠快速取得版權的業者可以延長商業性發行週期,並更有效地實現目錄資產的貨幣化。
訂閱疲勞和平台碎片化
用戶疲勞正在削弱內容傳送市場的定價權,因為如今家庭用戶面臨著種類繁多的付費和廣告支援的觀看選擇。 Netflix 於 2025 年 12 月達成收購華納兄弟探索頻道的協議,顯示隨著獨立服務商努力長期留住用戶,規模、豐富的片庫和優質智慧財產權的重要性日益凸顯。 Netflix 與SONY影視娛樂於 2026 年 1 月達成的協議也反映了類似的壓力,雙方仍然利用獨家電影發行窗口來提高用戶留存率並鞏固平台地位。福斯在 2026 年 6 月達成收購 Roku 的協議也表明,發行商越來越依賴平台覆蓋範圍和用戶數據,而不僅僅是增加用戶數量,以確保收入。這些趨勢將繼續推動內容傳送市場從單一的獨立服務轉向捆綁套餐、廣告支援套餐和更廣泛的平台生態系統。
細分市場分析
到2025年,影片內容將佔據內容傳送市場佔有率的65.54%,並繼續在獲利、版權談判和優質庫存規劃中佔據核心地位。實況活動、優質劇集和龐大的內容庫,憑藉其高可重複利用性以及透過訂閱和廣告支援的播出窗口實現盈利的能力,將繼續成為眾多發行商最具吸引力的內容形式。根據Amagi預測,2026年FAST(免費廣告支援串流)的觀看量將成長21%,進而改善定時播出環境下內容庫影片的獲利前景。這意味著,在原創內容製作成本持續高企的情況下,平台需要從現有資產中獲得更穩定的收入,因此,舊內容庫仍將具有商業性價值。
與影片不同,音訊在內容傳送市場中擁有獨特的機遇,因為人們可以在通勤、運動和其他休閒活動中收聽音訊。根據 Luminate 的報告,預計到 2026 年上半年,全球音訊點播串流媒體播放量將增加 9.8%,而美國以外地區的音樂點播串流媒體播放量預計將增加 11.8%。這一成長率表明,在內容內容傳送行業的音訊領域,透過音樂、播客和旁白等形式,仍有進一步盈利的空間。文字和圖像格式在新聞分發、體育數據和電子書分發方面也保持其價值,而且與付費影片的競標週期相比,這些領域的授權結構通常更為穩定。
區域分析
到2025年,北美將佔全球內容傳送市場38.61%的佔有率,成為收入基礎最大的地區。該地區之所以保持核心地位,是因為擁有許多大型製片公司、串流媒體滲透率高,以及最強大的聯網電視廣告生態系統。 2025年12月,Netflix同意以827億美元收購華納兄弟探索頻道,顯示規模、優質IP和直接分發管道正日益集中在少數幾家公司手中。美國也持續成為雲端原生廣播分發的重要試驗場,例如路透社和AWS在2025年展示的屢獲殊榮的基於TAMS的分發管道。加拿大和墨西哥也為該地區的整體情況增添了深度,語言要求、對本地內容的需求以及不斷改善的寬頻基礎設施持續推動整個內容傳送市場的投資。
預計到2031年,亞太地區將以8.12%的複合年成長率成長,成為內容傳送市場中成長最快的區域板塊。這一成長主要得益於印度直接面對消費者(DTC)串流媒體的擴張、中國本土平台的投資以及韓國以出口主導的內容供應體系。據印度資訊與廣播部稱,一項2025年的聯合調查估計,影片盜版造成的收入損失將高達12億美元,佔合法影片市場收入的10%,這表明儘管基於授權的盈利模式不足,但市場需求仍在成長。亞洲影像產業協會(AVIA)指出,內容保護如今已成為平台經濟結構的核心,因為盜版會損害用於製作本地語言節目的收入。韓國的網路漫畫和電視劇出口也在擴大該地區的版權框架,為整個內容傳送市場提供獨家合約和收益分成模式的支持。
歐洲內容傳送市場正呈現成熟跡象,傳統付費電視的壓力部分被廣告支援的串流媒體和全球平台授權所抵消。 2026年5月,VAUNET報告稱,2025年德國非法直播電視造成的經濟損失總計達24億歐元(26億美元)。其中包括媒體公司15億歐元(16.3億美元)的直接損失,顯示盜版仍在扭曲發行的經濟效益。在南美,由於巴西和阿根廷「行動優先」串流媒體的普及,市場正在擴張,但盜版仍然阻礙該地區部分地區獲得足夠的收入。中東和非洲仍處於起步階段,但沙烏地阿拉伯放寬媒體監管、阿拉伯聯合大公國先進的數位基礎設施以及奈及利亞創作者經濟的擴張,都為內容傳送市場帶來了未來的機會。
其他好處:
- Excel格式的市場預測(ME)表
- 3個月的分析師支持
目錄
第1章:引言
- 研究假設和市場定義
- 調查範圍
第2章:調查方法
第3章執行摘要
第4章 市場狀況
- 市場概覽
- 市場促進因素
- OTT和CTV內容貨幣化的擴展
- 加速多平台版權打包進程
- 引進雲端原生分發工作流程。
- 人工智慧驅動的本地化和版本控制
- 廣告商對第一方受眾數據的需求
- 擴大直播和準直播內容
- 市場限制因素
- 訂閱疲勞和平台碎片化
- 不同地區許可權的複雜性
- 因盜版和未經授權的再分發而導致的洩露
- 內容傳送和雲端對外通訊成本不斷上漲。
- 產業價值鏈分析
- 監理情勢
- 技術展望
- 波特五力分析
- 宏觀經濟因素對市場的影響
第5章 市場規模與成長預測
- 按內容類型
- 影片內容
- 音訊內容
- 文字和圖像內容
- 其他內容類型
- 透過分銷管道
- 串流媒體平台
- 廣播公司及有線電視網路
- 電信營運商
- 社群媒體和數位平台
- 其他分銷管道
- 透過許可
- 獨家授權
- 非獨家許可
- 夥伴關係許可
- 收益分成許可
- 其他許可
- 按地區
- 北美洲
- 美國
- 加拿大
- 墨西哥
- 南美洲
- 巴西
- 阿根廷
- 智利
- 其他南美國家
- 歐洲
- 德國
- 英國
- 法國
- 義大利
- 西班牙
- 其他歐洲國家
- 亞太地區
- 中國
- 日本
- 印度
- 韓國
- 澳洲
- 其他亞太國家
- 中東
- 沙烏地阿拉伯
- 阿拉伯聯合大公國
- 卡達
- 其他中東國家
- 非洲
- 南非
- 埃及
- 奈及利亞
- 其他非洲國家
- 北美洲
第6章 競爭情勢
- 市場集中度
- 策略趨勢
- Vendor Positioning Analysis
- 公司簡介
- Amazon.com, Inc.
- The Walt Disney Company
- Netflix, Inc.
- Warner Bros. Discovery, Inc.
- Comcast Corporation
- Paramount Global
- Roku, Inc.
- Apple Inc.
- Alphabet Inc.
- Akamai Technologies, Inc.
- Kaltura, Inc.
- Brightcove Inc.
- Vimeo, Inc.
- Bitmovin Inc.
- Muvi LLC
- Amagi Media Labs Pvt. Ltd.
第7章 市場機會與未來展望
According to Mordor Intelligence, the content distribution market size is projected to be USD 113.25 billion in 2025, USD 122.38 billion in 2026, and reach USD 169.41 billion by 2031, growing at a CAGR of 6.72% from 2026 to 2031.
This report is Segmented by Content Type (Video Content, Audio Content, Text and Image Content, and More), Distribution Channel (Streaming Platforms, Telecom Operators, Social Media and Digital Platforms, and More), Licensing (Exclusive Licensing, Non-Exclusive Licensing, Partnership Licensing, Revenue-Sharing Licensing, and More), and Geography. The Market Forecasts are Provided in Terms of Value (USD).
Global Content Distribution Market Trends and Insights
Rising OTT and CTV Content Monetization
Ad-supported streaming and connected TV are changing investment priorities in the content distribution market because distributors now evaluate content by audience yield as much as by headline reach. The April 2026 partnership between The CW Network and Roku clearly showed this shift, as next-day streaming access to CW entertainment programming will extend the network's reach to more than half of U.S. broadband households through The Roku Channel. Amagi reported in 2026 that FAST viewing rose 21%, which supports stronger monetization for catalog video and scheduled streaming environments that can carry repeatable ad inventory. This shift is increasing the value of premium live content, library assets, and broad catalog access, as the same title can now earn across subscription, AVOD, and FAST windows. The content distribution market is, therefore, rewarding operators that can connect inventory scale, platform reach, and audience data into a single commercial stack.
Accelerating Multi-Platform Rights Packaging
Rights packaging across film, television, and digital outlets is shortening the older sequential windowing model in the content distribution market. Netflix's January 2026 global Pay-1 agreement with Sony Pictures Entertainment demonstrated how distributors with worldwide reach can secure premium, multi-year access to theatrical titles and expand control over release timing across markets. As rights move across streaming, broadcast, and ad-supported channels simultaneously, distributors face greater overlap in territorial, format, and timing conditions. Vubiquity's September 2025 Catalog Intelligence update addressed this need by linking rights data, asset availability, and title metadata in a single interface, enabling studios and content owners to validate distribution readiness more quickly. The content distribution market benefits from this shift because operators that clear rights more quickly can expand commercial windows and monetize catalog assets more efficiently.
Subscription Fatigue and Platform Fragmentation
Subscriber fatigue is reducing pricing power in the content distribution market because households now face a wide set of paid and ad-supported viewing options. Netflix's December 2025 agreement to acquire Warner Bros. Discovery showed how scale, library depth, and premium intellectual property are becoming more important as standalone services work harder to retain viewers over longer periods. The January 2026 Netflix and Sony Pictures Entertainment agreement reflected the same pressure, as exclusive film windows are still being used to improve retention and support stronger platform positioning. Fox's June 2026 agreement to acquire Roku also showed that distributors are increasingly relying on platform reach and audience data, rather than subscription growth alone, to protect monetization. This restraint is likely to keep pushing the content distribution market toward bundles, ad-supported tiers, and broader platform ecosystems rather than narrow, standalone offers.
Other drivers and restraints analyzed in the detailed report include:
- Cloud-Native Distribution Workflow Adoption
- AI-Assisted Localization and Versioning
- Rights Clearance Complexity Across Territories
For complete list of drivers and restraints, kindly check the Table Of Contents.
Segment Analysis
Video held 65.54% of the content distribution market share in 2025, which kept it at the center of monetization, rights negotiation, and premium inventory planning. Video remains the most attractive format for many distributors because live events, premium series, and broad catalog libraries can be monetized across subscription and ad-supported windows with strong reuse value. Amagi said FAST viewing rose 21% in 2026, improving the monetization outlook for catalog video across scheduled streaming environments. This keeps older libraries commercially relevant at a time when original production costs remain high, and platforms need steadier returns from existing assets.
Audio presents a different opportunity in the content distribution market because listening fits commuting, exercise, and other background moments that video does not. Luminate reported that global on-demand audio streams grew 9.8% in the first half of 2026, while ex-U.S. on-demand audio song streams increased 11.8%. That pace suggests the audio layer of the content distribution industry still has room for broader monetization through music, podcasts, and spoken-word formats. Text-and-image formats also retain durable value in news syndication, sports data, and e-book delivery, where licensing structures are usually more stable than premium video bidding cycles.
Complete Report Scope:
- By Content Type
- Video Content
- Audio Content
- Text and Image Content
- Other Content Types
- By Distribution Channel
- Streaming Platforms
- Broadcaster and Cable Networks
- Telecom Operators
- Social Media and Digital Platforms
- Other Distribution Channels
- By Licensing
- Exclusive Licensing
- Non-Exclusive Licensing
- Partnership Licensing
- Revenue-Sharing Licensing
- Other Licensings
- By Geography
- North America
- United States
- Canada
- Mexico
- South America
- Brazil
- Argentina
- Chile
- Rest of South America
- Europe
- Germany
- United Kingdom
- France
- Italy
- Spain
- Rest of Europe
- Asia-Pacific
- China
- Japan
- India
- South Korea
- Australia
- Rest of Asia-Pacific
- Middle East
- Saudi Arabia
- United Arab Emirates
- Qatar
- Rest of Middle East
- Africa
- South Africa
- Egypt
- Nigeria
- Rest of Africa
- North America
Geography Analysis
North America accounted for 38.61% of the global content distribution market in 2025, making it the region with the largest revenue base. The region remains central because it combines major studio ownership, high streaming penetration, and the deepest connected TV advertising ecosystem. Netflix's December 2025 agreement to acquire Warner Bros. Discovery at an enterprise value of USD 82.7 billion showed how scale, premium IP, and direct distribution are being drawn into fewer hands. The United States also remains a major testing ground for cloud-native broadcast delivery, as Reuters and AWS demonstrated with their award-winning TAMS-based pipeline in 2025. Canada and Mexico add depth to the regional picture, as language requirements, local content needs, and improvements in broadband continue to support investment across the content distribution market.
Asia-Pacific is projected to grow at an 8.12% CAGR through 2031, making it the fastest-expanding regional segment in the content distribution market. Growth is being supported by India's expansion of direct-to-consumer streaming, China's domestic platform investment, and South Korea's export-led content pipeline. India's Ministry of Information and Broadcasting said a 2025 joint study estimated current-year revenue losses of USD 1.2 billion from video piracy, or 10% of the legal video sector, which showed that demand is rising even where licensed monetization still leaks. The Asia Video Industry Association said content protection is now central to platform economics because piracy weakens the revenue needed to fund local-language programming. South Korea's webtoon and drama exports are also widening the regional rights universe, which supports both exclusive and revenue-sharing structures across the content distribution market.
Europe presents a more mature profile in the content distribution market, with legacy pay-TV pressure partly offset by ad-supported streaming and licensing to global platforms. VAUNET reported in May 2026 that illegal live TV streaming caused total economic losses of EUR 2.4 billion (USD 2.6 billion) in Germany in 2025, including direct media company losses of EUR 1.5 billion (USD 1.63 billion), which shows how piracy still distorts licensed distribution economics. South America is expanding through mobile-first streaming adoption in Brazil and Argentina, although piracy still limits full revenue capture across parts of the region. Middle East and Africa remain earlier-stage markets, yet media liberalization in Saudi Arabia, advanced digital infrastructure in the United Arab Emirates, and a larger creator economy in Nigeria are widening future opportunities in the content distribution market.
- Amazon.com, Inc.
- The Walt Disney Company
- Netflix, Inc.
- Warner Bros. Discovery, Inc.
- Comcast Corporation
- Paramount Global
- Roku, Inc.
- Apple Inc.
- Alphabet Inc.
- Akamai Technologies, Inc.
- Kaltura, Inc.
- Brightcove Inc.
- Vimeo, Inc.
- Bitmovin Inc.
- Muvi LLC
- Amagi Media Labs Pvt. Ltd.
Additional Benefits:
- The market estimate (ME) sheet in Excel format
- 3 months of analyst support
TABLE OF CONTENTS
1 INTRODUCTION
- 1.1 Study Assumptions and Market Definition
- 1.2 Scope of The Study
2 RESEARCH METHODOLOGY
3 EXECUTIVE SUMMARY
4 MARKET LANDSCAPE
- 4.1 Market Overview
- 4.2 Market Drivers
- 4.2.1 Rising OTT and CTV Content Monetization
- 4.2.2 Accelerating Multi-Platform Rights Packaging
- 4.2.3 Cloud-Native Distribution Workflow Adoption
- 4.2.4 AI-Assisted Localization and Versioning
- 4.2.5 First-Party Audience Data Demand from Advertisers
- 4.2.6 Live and Near-Live Content Expansion
- 4.3 Market Restraints
- 4.3.1 Subscription Fatigue and Platform Fragmentation
- 4.3.2 Rights Clearance Complexity Across Territories
- 4.3.3 Piracy and Unauthorized Re-Distribution Leakage
- 4.3.4 Rising Content Delivery and Cloud Egress Costs
- 4.4 Industry Value Chain Analysis
- 4.5 Regulatory Landscape
- 4.6 Technological Outlook
- 4.7 Porter's Five Forces Analysis
- 4.7.1 Bargaining Power of Buyers
- 4.7.2 Bargaining Power of Suppliers
- 4.7.3 Threat of New Entrants
- 4.7.4 Threat of Substitutes
- 4.7.5 Intensity of Competitive Rivalry
- 4.8 Impact of Macroeconomic Factors on the Market
5 MARKET SIZE AND GROWTH FORECASTS (VALUE)
- 5.1 By Content Type
- 5.1.1 Video Content
- 5.1.2 Audio Content
- 5.1.3 Text and Image Content
- 5.1.4 Other Content Types
- 5.2 By Distribution Channel
- 5.2.1 Streaming Platforms
- 5.2.2 Broadcaster and Cable Networks
- 5.2.3 Telecom Operators
- 5.2.4 Social Media and Digital Platforms
- 5.2.5 Other Distribution Channels
- 5.3 By Licensing
- 5.3.1 Exclusive Licensing
- 5.3.2 Non-Exclusive Licensing
- 5.3.3 Partnership Licensing
- 5.3.4 Revenue-Sharing Licensing
- 5.3.5 Other Licensings
- 5.4 By Geography
- 5.4.1 North America
- 5.4.1.1 United States
- 5.4.1.2 Canada
- 5.4.1.3 Mexico
- 5.4.2 South America
- 5.4.2.1 Brazil
- 5.4.2.2 Argentina
- 5.4.2.3 Chile
- 5.4.2.4 Rest of South America
- 5.4.3 Europe
- 5.4.3.1 Germany
- 5.4.3.2 United Kingdom
- 5.4.3.3 France
- 5.4.3.4 Italy
- 5.4.3.5 Spain
- 5.4.3.6 Rest of Europe
- 5.4.4 Asia-Pacific
- 5.4.4.1 China
- 5.4.4.2 Japan
- 5.4.4.3 India
- 5.4.4.4 South Korea
- 5.4.4.5 Australia
- 5.4.4.6 Rest of Asia-Pacific
- 5.4.5 Middle East
- 5.4.5.1 Saudi Arabia
- 5.4.5.2 United Arab Emirates
- 5.4.5.3 Qatar
- 5.4.5.4 Rest of Middle East
- 5.4.6 Africa
- 5.4.6.1 South Africa
- 5.4.6.2 Egypt
- 5.4.6.3 Nigeria
- 5.4.6.4 Rest of Africa
- 5.4.1 North America
6 COMPETITIVE LANDSCAPE
- 6.1 Market Concentration
- 6.2 Strategic Moves
- 6.3 Vendor Positioning Analysis
- 6.4 Company Profiles (includes Global Level Overview, Market Level Overview, Core Segments, Financials as available, Strategic Information, Market Rank/Share, Products and Services, Recent Developments)
- 6.4.1 Amazon.com, Inc.
- 6.4.2 The Walt Disney Company
- 6.4.3 Netflix, Inc.
- 6.4.4 Warner Bros. Discovery, Inc.
- 6.4.5 Comcast Corporation
- 6.4.6 Paramount Global
- 6.4.7 Roku, Inc.
- 6.4.8 Apple Inc.
- 6.4.9 Alphabet Inc.
- 6.4.10 Akamai Technologies, Inc.
- 6.4.11 Kaltura, Inc.
- 6.4.12 Brightcove Inc.
- 6.4.13 Vimeo, Inc.
- 6.4.14 Bitmovin Inc.
- 6.4.15 Muvi LLC
- 6.4.16 Amagi Media Labs Pvt. Ltd.
7 MARKET OPPORTUNITIES AND FUTURE OUTLOOK
- 7.1 White-Space and Unmet-Need Assessment

 全球內容傳遞網路(CDN) 市場規模、佔有率、趨勢和成長分析報告,2026-2034 年
 2026-2030年全球內容傳遞網路(CDN)市場
 OTT內容傳遞網路:市場佔有率分析、產業趨勢與統計及成長預測(2026-2031年)內容傳遞網路(CDN) 安全性:市場佔有率分析、產業趨勢與統計資料以及成長預測 (2026-2031)
 商業P2P CDN市場-2026-2032年全球市場預測雲端內容傳遞網路市場:按元件、內容類型、部署模式、組織規模和最終用戶分類-2026-2032年全球市場預測內容傳遞網路(CDN) 市場:2026-2032 年全球市場預測(按服務類型、內容類型、部署模式、組織規模和最終用戶分類)
 2026年全球固定內容及應用市場報告全球商業P2P CDN市場規模、佔有率、趨勢和成長分析報告(2026-2034年)
 內容傳遞網路市場 - 全球產業規模、佔有率、趨勢、機會、預測:按組件、類型、服務供應商類型、最終用戶、內容類型、地區和競爭格局分類,2021-2031年