


 |
市場調查報告書
商品編碼
2118189
OTT雲端基礎設施:市場佔有率分析、產業趨勢與統計、成長預測(2026-2031年)OTT Cloud Infrastructure - Market Share Analysis, Industry Trends & Statistics, Growth Forecasts (2026 - 2031) |
||||||

※ 本網頁內容可能與最新版本有所差異。詳細情況請與我們聯繫。
據 Mordor Intelligence 稱,2025 年 OTT 雲端基礎設施市場價值為 125.3 億美元,預計到 2031 年將達到 285.7 億美元,而 2026 年為 145.2 億美元,預測期內(2026-2031 年)的複合年成長率為 14.49%。
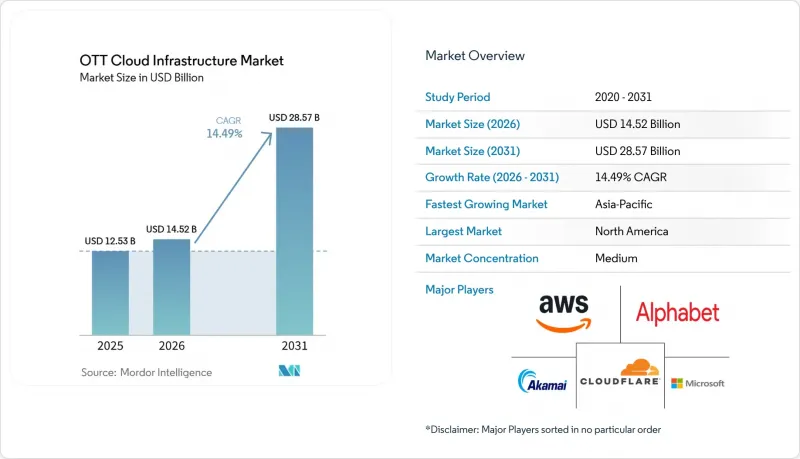
本報告按基礎設施層(雲端運算基礎設施、雲端儲存和來源站基礎設施、雲端網路和CDN基礎設施等)、部署模式(公共雲端、私有雲端、混合雲端)、串流媒體格式(直播、點播、混合串流媒體)和地區進行細分。市場預測以美元(USD)為單位。
全球OTT雲端基礎設施市場趨勢與洞察
雲端原生可擴充性,可處理事件驅動型流的峰值。
在實況活動中,平均觀眾需求與尖峰時段觀眾需求之間的顯著差異正在推動OTT雲端基礎設施市場的發展,使得雲端自動擴展成為關鍵促進因素。營運商可以採用多重雲端架構,將核心運算、機器學習工作負載和最後一公里交付分配給不同的雲端服務供應商。這種方法對於全國性活動至關重要,因為必須在流量高峰到來之前確保容量。預測性自動擴展利用歷史流量模式,在擁塞發生之前為大規模觀眾配置資源,而不是在堵塞發生後才做出反應。主要雲端服務供應商不斷擴展其底層容量,以支援需要低延遲和高可用性的工作負載。長期使用合約使大型廣播公司能夠在重大活動之前獲得優惠價格,而小規模業者可能仍受制於按需定價。
對低延遲體育賽事直播和互動串流媒體的需求日益成長。
由於體育賽事直播的興起,對超低延遲串流媒體系統的需求日益成長。低延遲HLS和低延遲CMAF能夠減少實況活動與觀眾接收的串流媒體之間的延遲。串流延遲會降低互動功能和即時投注服務的價值,因為觀眾可能要等到賽事實際發生後才能看到畫面。不斷上漲的體育賽事轉播權成本也促使營運商提高編碼效率、最佳化串流路由並提升資源利用率。 2026年4月,Harmonic Drive Systems推出了AI編配服務,旨在幫助廣播公司將AI應用整合到直播工作流程中,同時確保冗餘性和廣播級可靠性。 OTT(Over-The-Top)雲端基礎設施市場正受益於體育賽事、新聞和互動活動直播所需的持續處理和傳輸能力。
與頻寬、出口流量和轉碼相關的成本不斷增加。
在OTT雲端基礎設施市場中,出口定價仍是限制經濟效益的阻礙因素因素。由於雲端服務供應商按GB收費,支援跨區域數億同時線上用戶的服務可能會產生巨額的持續性費用。各大平台正投資建置自有配送網路,以減少對按GB計費的雲端出口合約的依賴。轉碼會增加成本,因為它需要根據語言、解析度和觀看權限對每種流變體進行額外的處理。 Akamai在2026年投資者資料中指出,硬體、電力和基礎設施成本的上漲可能會對CDN定價造成壓力。按標題編碼可以透過根據單一資源的複雜程度調整位元率來減少分發量,但這需要小規模廣播公司通常缺乏的工程資源。
細分市場分析
截至2025年,雲端運算基礎設施將佔據38.49%的市場佔有率,為下游媒體功能提供核心虛擬機器和容器層。 「媒體處理和工作流程基礎設施」預計將在2026年至2031年間以14.91%的複合年成長率成長。自動化編碼、在地化、伺服器端廣告插入和人工智慧驅動的處理是推動這項需求的主要因素。訂閱制和廣告支援型服務計劃的普及可能需要為相同資源提供獨立的無廣告串流和廣告支援流。這將增加目錄中每個標題的處理需求,從而推動OTT雲端基礎設施市場的發展。
雲端網路和內容分發網路 (CDN) 基礎架構為內容來源與受眾之間的連線提供了路徑,而雲端儲存和來源基礎架構則儲存來源資源並支援直播服務的持續資訊流攝取。壓縮技術和按標題編碼的改進正在抑制這些成長,因為它們可以降低每小時受眾所需的頻寬和儲存空間。隨著營運商即時監控服務質量,可觀測性、分析和測量基礎設施的重要性日益凸顯。 Akamai 和 MediaMelon 於 2026 年 4 月合作,將 SmartSight 的體驗品質 (QoE) 分析功能部署到超過 4,400 個 Akamai 邊緣節點。這項服務反映了市場對將網路健康狀況、播放器效能和受眾體驗整合到單一營運視圖中的系統日益成長的需求。
區域分析
到2025年,北美將佔據OTT雲端基礎設施市場43.61%的佔有率。該地區內容版權持有者、OTT平台、雲端服務和CDN中心高度集中,其成長主要由直播體育賽事、廣告支援套餐和目錄處理的技術升級所驅動,而非新平台的推出。 2026年4月,福斯指定AWS為其首選AI雲端供應商,利用AWS Elemental的媒體服務和AI功能重新製作精彩影像和社群影片。 2026年2月,挪威電信推出了由AWS和Scalstrm提供支援的全國性北歐電視平台,該平台利用了Direct Connect、海量儲存和雲端原生源站功能。
預計亞太地區在2026年至2031年間將以15.22%的複合年成長率成長,成為OTT雲端基礎設施市場成長最快的地區。印度、韓國和日本正憑藉以行動裝置為中心的消費模式、體育服務以及高人均消費水準推動這一成長。印度的板球賽事需要能夠處理高峰期同時在線觀看量的大規模部署。印度的《2025年數位個人資料保護條例》要求營運商在設計雲端基礎設施時考慮在本地處理用戶的個人資訊。中國的YD/T 7033-2026標準規定了5G核心網中增強多播和廣播能力的技術要求,這有望在大型觀看活動期間降低CDN需求。
在南美洲,預計到2026年第二季度,FAST觀看時間將成長190%,這將推動OTT(Over-The-Top)雲端基礎設施市場對廣告相關處理和分發能力的需求。該地區FAST服務的採用率正在不斷提高,從而產生了對處理能力和內容分發網路(CDN)的需求,儘管其訂閱收入尚未達到北美地區的水平。在歐洲,優先使用本地雲端中心的資料主權要求可能會減緩廣播製作工作負載採用公共超大規模資料中心業者的速度。歐盟委員會提案一項2026年主權雲端運算服務框架,其中包含符合《一般資料保護規則》 (GDPR)的保障措施。在中東,特別是沙烏地阿拉伯和阿拉伯聯合大公國(阿拉伯聯合大公國),對優質串流媒體的需求與國內資料保存要求密切相關,而非洲的發展則取決於行動寬頻的普及率和更經濟實惠設備的可用性。
其他好處:
- Excel格式的市場預測(ME)表
- 3個月的分析師支持
目錄
第1章:引言
- 研究假設和市場定義
- 調查範圍
第2章:調查方法
第3章執行摘要
第4章 市場狀況
- 市場概覽
- 市場促進因素
- 在事件驅動型串流尖峰時段實現雲端原生可擴充性
- 對低延遲體育賽事直播和互動串流媒體的需求日益成長。
- 人工智慧驅動的影片工作流程自動化和本地化
- 擴展邊緣運算、開放快取和多 CDN 交付。
- 由於廣告獲利模式和混合獲利模式的出現,處理量正在增加。
- 5G、多播和廣播串流媒體的融合。
- 市場限制因素
- 頻寬、對外通訊和轉碼成本不斷增加。
- 設備、轉碼器、DRM 和播放器相容性碎片化
- 關於隱私、內容權利和資料儲存位置的限制
- 新興網路尖峰時段服務品質不穩定
- 產業價值鏈分析
- 宏觀經濟因素對市場的影響
- 監理情勢
- 技術展望
- 波特五力分析
第5章 市場規模與成長預測
- 基礎設施層
- 雲端運算基礎設施
- 雲端儲存和來源基礎設施
- 雲端網路和CDN基礎設施
- 媒體處理與工作流程基礎設施
- 可觀測性、分析和測量基礎設施
- 按部署模式
- 公共雲端
- 私有雲端
- 混合雲端
- 透過串流媒體格式
- 直播
- 點播串流媒體
- 混合串流媒體
- 按地區
- 北美洲
- 美國
- 加拿大
- 墨西哥
- 南美洲
- 巴西
- 阿根廷
- 其他南美國家
- 歐洲
- 英國
- 德國
- 法國
- 義大利
- 西班牙
- 俄羅斯
- 其他歐洲國家
- 亞太地區
- 中國
- 印度
- 日本
- 韓國
- 澳洲
- 東南亞
- 其他亞太國家
- 中東
- 阿拉伯聯合大公國
- 沙烏地阿拉伯
- 土耳其
- 其他中東國家
- 非洲
- 南非
- 奈及利亞
- 埃及
- 其他非洲國家
- 北美洲
第6章 競爭情勢
- 市場集中度
- 策略趨勢
- 市佔率分析
- 公司簡介
- Amazon Web Services, Inc.
- Microsoft Corporation
- Alphabet Inc.
- Akamai Technologies, Inc.
- Cloudflare, Inc.
- Fastly, Inc.
- International Business Machines Corporation
- Oracle Corporation
- Cisco Systems, Inc.
- Alibaba Cloud Intelligence Pte. Ltd.
- Tencent Cloud Computing(Beijing)Co., Ltd.
- Comcast Technology Solutions, LLC
- Tata Communications Limited
- NTT Data Corporation
- MediaKind Group Limited
- Ateme SA
- Synamedia Limited
- Brightcove Inc.
- Kaltura, Inc.
- Bitmovin Inc.
- Wowza Media Systems, LLC
- Broadpeak SA
第7章 市場機會與未來展望
According to Mordor Intelligence, the OTT cloud infrastructure market size was valued at USD 12.53 billion in 2025 and estimated to grow from USD 14.52 billion in 2026 to reach USD 28.57 billion by 2031, at a CAGR of 14.49% during the forecast period (2026-2031).
This report is Segmented by Infrastructure Layer (Cloud Compute Infrastructure, Cloud Storage and Origin Infrastructure, Cloud Networking and CDN Infrastructure, and More), Deployment Model (Public Cloud, Private Cloud, and Hybrid Cloud), Streaming Format (Live Streaming, On-Demand Streaming, and Hybrid Streaming), and Geography. The Market Forecasts are Provided in Terms of Value (USD).
Global OTT Cloud Infrastructure Market Trends and Insights
Cloud-Native Elasticity for Event-Driven Streaming Peaks
Cloud auto-scaling supports the OTT cloud infrastructure market because live events create a wide gap between average and peak viewer demand. Operators can use multi-cloud designs that assign core compute, machine-learning workloads, and last-mile delivery to different providers. This approach has become important for national-scale events, where capacity must be ready before traffic rises. Predictive autoscaling uses historical traffic patterns to provision resources for large audiences before congestion occurs, rather than responding after congestion begins. Large cloud providers are continuing to expand their underlying capacity, supporting workloads that require low latency and high availability. Long-term volume commitments can give larger broadcasters better pricing before major events, while smaller operators may remain exposed to on-demand rates.
Rising Low-Latency Live Sports and Interactive Streaming Demand
Live sports are increasing the demand for delivery systems with very low delay. Low-Latency HLS and Low-Latency CMAF are narrowing the gap between a live event and the stream viewers receive. Delayed feeds can weaken the value of interactive features and live wagering services when viewers see action after it has occurred. Rising sports rights costs are also encouraging operators to improve encoding efficiency, delivery routing, and resource use. Harmonic launched an AI Orchestration Service in April 2026 to help broadcasters integrate AI applications into live workflows with redundancy and broadcast-grade reliability. The over-the-top (OTT) cloud infrastructure market benefits from the need for continuous processing and delivery capacity during each live session for sports, news, and interactive events.
Escalating Bandwidth, Egress, and Transcoding Cost Burden
Egress pricing remains a central constraint on the economics of the OTT cloud infrastructure market. Cloud providers charge for internet delivery by data volume, which can result in large recurring bills for services supporting hundreds of millions of concurrent viewers across regions. Large platforms are investing in their own delivery networks to reduce reliance on per-gigabyte cloud egress contracts. Transcoding increases costs because each language, resolution ladder, and entitlement-aware stream variant requires more processing. Akamai cited higher hardware, power, and infrastructure costs in its 2026 investor materials, which may place pressure on CDN pricing. Per-title encoding can reduce delivery volume by matching bitrate ladders to the complexity of individual assets, but it requires engineering resources that smaller broadcasters may not have.
Other drivers and restraints analyzed in the detailed report include:
- AI-Based Video Workflow Automation and Localization
- Expansion of Edge Compute, Open Caching, and Multi-CDN Delivery
- Fragmented Device, Codec, DRM, and Player Compatibility
For complete list of drivers and restraints, kindly check the Table Of Contents.
Segment Analysis
Cloud Compute Infrastructure held 38.49% in 2025 and provided the core virtual machine and container layer for downstream media functions. Media Processing and Workflow Infrastructure is projected to expand at a 14.91% CAGR from 2026 to 2031. Automated encoding, localization, server-side ad insertion, and AI-supported processing are increasing its demand. The wider use of subscription and ad-supported tiers means that a single asset may need separate clean and ad-supported stream variants. This raises processing requirements for each title in the catalog and supports the OTT cloud infrastructure market.
Cloud Networking and CDN Infrastructure provide the path between content origins and audiences, while Cloud Storage and Origin Infrastructure retain source assets and support continuous feed ingest for live services. Their growth is moderated by improved compression and per-title encoding, which can reduce the bandwidth and storage required per viewer-hour. Observability, Analytics, and Measurement Infrastructure is gaining importance as operators monitor service quality in real time. Akamai and MediaMelon partnered in April 2026 to bring SmartSight quality-of-experience analytics to more than 4,400 Akamai edge locations. The service reflects growing demand for systems that connect network health, player performance, and viewer experience into a single operating view.
Complete Report Scope:
- By Infrastructure Layer
- Cloud Compute Infrastructure
- Cloud Storage and Origin Infrastructure
- Cloud Networking and CDN Infrastructure
- Media Processing and Workflow Infrastructure
- Observability, Analytics, and Measurement Infrastructure
- By Deployment Model
- Public Cloud
- Private Cloud
- Hybrid Cloud
- By Streaming Format
- Live Streaming
- On-Demand Streaming
- Hybrid Streaming
- By Geography
- North America
- United States
- Canada
- Mexico
- South America
- Brazil
- Argentina
- Rest of South America
- Europe
- United Kingdom
- Germany
- France
- Italy
- Spain
- Russia
- Rest of Europe
- Asia-Pacific
- China
- India
- Japan
- South Korea
- Australia
- Southeast Asia
- Rest of Asia-Pacific
- Middle East
- United Arab Emirates
- Saudi Arabia
- Turkey
- Rest of Middle East
- Africa
- South Africa
- Nigeria
- Egypt
- Rest of Africa
- North America
Geography Analysis
North America held 43.61% of the OTT cloud infrastructure market in 2025. The region has a dense concentration of content rights owners, OTT platforms, cloud services, and CDN locations, and growth is driven more by technical upgrades for live sports, advertising-supported tiers, and catalog processing than by first-time platform launches. Fox named AWS its preferred AI cloud provider in April 2026, combining AWS Elemental media services with AI functions for highlights and social video reformatting. Telenor went live with a pan-Nordic TV platform enabled by AWS and Scalstrm in February 2026, using Direct Connect, large-scale storage, and cloud-native origin capabilities.
Asia-Pacific is projected to expand at a 15.22% CAGR from 2026 to 2031, making it the fastest-growing geographic area in the OTT cloud infrastructure market. India, South Korea, and Japan support this expansion through mobile-focused consumption, sports services, and higher per-user spending. Cricket events in India have required multi-cloud deployments capable of handling major concurrent audience peaks. India's Digital Personal Data Protection Rules, 2025, require operators to consider local handling of subscriber personal information when designing cloud infrastructure. China's YD/T 7033-2026 standard sets technical requirements for 5G core network multicast and broadcast enhancements, which could reduce CDN demand during mass-viewing events.
South America recorded 190% growth in FAST viewing hours in Q2 2026, increasing demand for advertising-related processing and delivery capacity in the over-the-top (OTT) cloud infrastructure market. The region is gaining importance through the adoption of FAST services, which creates processing and CDN demand without the subscription revenue levels common in North America. Europe faces data sovereignty requirements that favor regional cloud locations and can slow the use of public hyperscalers for broadcast production workloads. The European Commission proposed a sovereign cloud computing services framework in 2026 with safeguards aligned with the General Data Protection Regulation. The Middle East, particularly Saudi Arabia and the UAE, combines premium streaming demand with in-country data requirements, while Africa's development depends on mobile broadband reach and more affordable devices.
- Amazon Web Services, Inc.
- Microsoft Corporation
- Alphabet Inc.
- Akamai Technologies, Inc.
- Cloudflare, Inc.
- Fastly, Inc.
- International Business Machines Corporation
- Oracle Corporation
- Cisco Systems, Inc.
- Alibaba Cloud Intelligence Pte. Ltd.
- Tencent Cloud Computing (Beijing) Co., Ltd.
- Comcast Technology Solutions, LLC
- Tata Communications Limited
- NTT Data Corporation
- MediaKind Group Limited
- Ateme S.A.
- Synamedia Limited
- Brightcove Inc.
- Kaltura, Inc.
- Bitmovin Inc.
- Wowza Media Systems, LLC
- Broadpeak S.A.
Additional Benefits:
- The market estimate (ME) sheet in Excel format
- 3 months of analyst support
TABLE OF CONTENTS
1 INTRODUCTION
- 1.1 Study Assumptions and Market Definition
- 1.2 Scope of the Study
2 RESEARCH METHODOLOGY
3 EXECUTIVE SUMMARY
4 MARKET LANDSCAPE
- 4.1 Market Overview
- 4.2 Market Drivers
- 4.2.1 Cloud-Native Elasticity for Event-Driven Streaming Peaks
- 4.2.2 Rising Low-Latency Live Sports and Interactive Streaming Demand
- 4.2.3 AI-Based Video Workflow Automation and Localization
- 4.2.4 Expansion of Edge Compute, Open Caching, and Multi-CDN Delivery
- 4.2.5 Ad-Supported and Hybrid Monetization Expanding Processing Volumes
- 4.2.6 5G, Multicast, and Broadcast-Streaming Convergence
- 4.3 Market Restraints
- 4.3.1 Escalating Bandwidth, Egress, and Transcoding Cost Burden
- 4.3.2 Fragmented Device, Codec, DRM, and Player Compatibility
- 4.3.3 Privacy, Content Rights, and Data Residency Constraints
- 4.3.4 Peak-Time Quality-of-Service Instability in Emerging Networks
- 4.4 Industry Value-Chain Analysis
- 4.5 Impact of Macroeconomic Factors on the Market
- 4.6 Regulatory Landscape
- 4.7 Technological Outlook
- 4.8 Porter's Five Forces Analysis
- 4.8.1 Bargaining Power of Suppliers
- 4.8.2 Bargaining Power of Buyers
- 4.8.3 Threat of New Entrants
- 4.8.4 Threat of Substitutes
- 4.8.5 Intensity of Competitive Rivalry
5 MARKET SIZE AND GROWTH FORECASTS (VALUE)
- 5.1 By Infrastructure Layer
- 5.1.1 Cloud Compute Infrastructure
- 5.1.2 Cloud Storage and Origin Infrastructure
- 5.1.3 Cloud Networking and CDN Infrastructure
- 5.1.4 Media Processing and Workflow Infrastructure
- 5.1.5 Observability, Analytics, and Measurement Infrastructure
- 5.2 By Deployment Model
- 5.2.1 Public Cloud
- 5.2.2 Private Cloud
- 5.2.3 Hybrid Cloud
- 5.3 By Streaming Format
- 5.3.1 Live Streaming
- 5.3.2 On-Demand Streaming
- 5.3.3 Hybrid Streaming
- 5.4 By Geography
- 5.4.1 North America
- 5.4.1.1 United States
- 5.4.1.2 Canada
- 5.4.1.3 Mexico
- 5.4.2 South America
- 5.4.2.1 Brazil
- 5.4.2.2 Argentina
- 5.4.2.3 Rest of South America
- 5.4.3 Europe
- 5.4.3.1 United Kingdom
- 5.4.3.2 Germany
- 5.4.3.3 France
- 5.4.3.4 Italy
- 5.4.3.5 Spain
- 5.4.3.6 Russia
- 5.4.3.7 Rest of Europe
- 5.4.4 Asia-Pacific
- 5.4.4.1 China
- 5.4.4.2 India
- 5.4.4.3 Japan
- 5.4.4.4 South Korea
- 5.4.4.5 Australia
- 5.4.4.6 Southeast Asia
- 5.4.4.7 Rest of Asia-Pacific
- 5.4.5 Middle East
- 5.4.5.1 United Arab Emirates
- 5.4.5.2 Saudi Arabia
- 5.4.5.3 Turkey
- 5.4.5.4 Rest of Middle East
- 5.4.6 Africa
- 5.4.6.1 South Africa
- 5.4.6.2 Nigeria
- 5.4.6.3 Egypt
- 5.4.6.4 Rest of Africa
- 5.4.1 North America
6 COMPETITIVE LANDSCAPE
- 6.1 Market Concentration
- 6.2 Strategic Moves
- 6.3 Market Share Analysis
- 6.4 Company Profiles (includes Global Level Overview, Market Level Overview, Core Segments, Financials as available, Strategic Information, Market Rank/Share, Products and Services, Recent Developments)
- 6.4.1 Amazon Web Services, Inc.
- 6.4.2 Microsoft Corporation
- 6.4.3 Alphabet Inc.
- 6.4.4 Akamai Technologies, Inc.
- 6.4.5 Cloudflare, Inc.
- 6.4.6 Fastly, Inc.
- 6.4.7 International Business Machines Corporation
- 6.4.8 Oracle Corporation
- 6.4.9 Cisco Systems, Inc.
- 6.4.10 Alibaba Cloud Intelligence Pte. Ltd.
- 6.4.11 Tencent Cloud Computing (Beijing) Co., Ltd.
- 6.4.12 Comcast Technology Solutions, LLC
- 6.4.13 Tata Communications Limited
- 6.4.14 NTT Data Corporation
- 6.4.15 MediaKind Group Limited
- 6.4.16 Ateme S.A.
- 6.4.17 Synamedia Limited
- 6.4.18 Brightcove Inc.
- 6.4.19 Kaltura, Inc.
- 6.4.20 Bitmovin Inc.
- 6.4.21 Wowza Media Systems, LLC
- 6.4.22 Broadpeak S.A.
7 MARKET OPPORTUNITIES AND FUTURE OUTLOOK
- 7.1 White-Space and Unmet-Need Assessment

 雲端基礎設施市場預測至 2034 年—按基礎設施類型、組件、部署模式、組織規模、最終用戶和地區分類的全球分析
 雲端和人工智慧基礎設施:研究訂閱
 中小規模雲端的超融合資料中心市場:全球市場預測,2026-2032年基礎設施門禁市場報告:趨勢、預測和競爭分析(至2035年)通訊領域的AI雲端基礎設施:全球市場預測,2025-2031年
 雲端基礎設施市場:按服務類型、部署模式、組織規模、最終用戶、銷售管道和地區分類
 2026 年雲端基礎設施十大成長機遇
 人工智慧工廠基礎設施:市場佔有率分析、產業趨勢與統計、成長預測(2026-2031 年)通訊業者雲端市場預測——按組件、雲端服務模型、部署模型、組織規模、應用程式、最終用戶和地區分類的全球分析——2034 年
 NeoCloud全球市場報告2026