


 |
市場調查報告書
商品編碼
2118176
現場行銷服務:市場佔有率分析、產業趨勢與統計、成長預測(2026-2031 年)Field Marketing Services - Market Share Analysis, Industry Trends & Statistics, Growth Forecasts (2026 - 2031) |
||||||

※ 本網頁內容可能與最新版本有所差異。詳細情況請與我們聯繫。
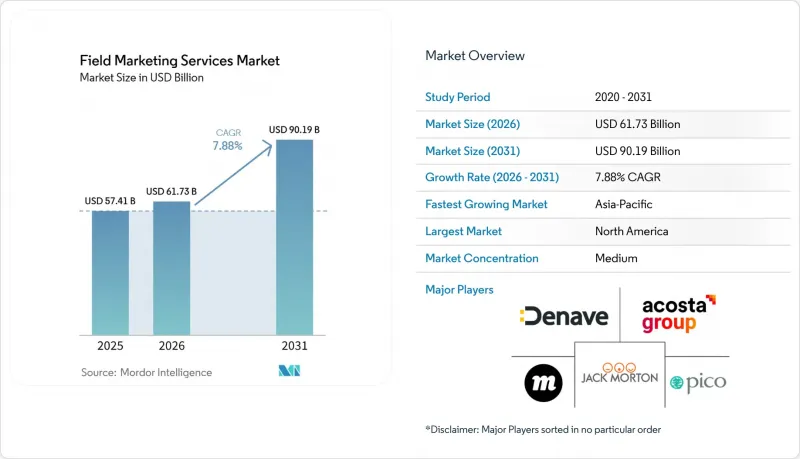
根據 Mordor Intelligence 預測,現場行銷服務市場規模將從 2025 年的 574.1 億美元成長到 2026 年的 617.3 億美元,然後在 2031 年達到 901.9 億美元,2026 年至 2031 年的複合年成長率為 7.8%。
本報告按服務類型(品牌活化和體驗式宣傳活動、產品展示和試用活動、路演和行動行銷巡迴等)、終端使用者產業(零售和電子商務、消費品和美容、媒體和娛樂、銀行、金融服務和保險、醫療保健和生命科學等)以及地區進行細分。市場預測以價值(美元)表示。
全球現場行銷服務市場趨勢與洞察
品牌對可衡量的全通路活化的需求日益成長。
品牌不再滿足於僅以出席人數和照片報告作為結尾的線下宣傳活動。現場行銷服務市場正轉向將線下觸點與銷售管道、數位化行動和後續轉換訊號連結的項目。廣告主的偏好也在推動這一轉變,41%的廣告買家計劃在2026年增加對線下和體驗式行銷的投入,這表明,當線下活動與更廣泛的宣傳活動目標相結合時,它們仍然能夠獲得預算支持。QR碼觸發、NFC互動、社交分享功能和數位內容收集正逐漸成為活動方案的標配,因為它們能夠幫助品牌將現場互動與下一個可衡量的步驟聯繫起來。這使得能夠將人員配備、製作和效果評估整合到單一營運模式中的現場行銷服務機構更具優勢。
有組織零售業的擴張以及現代貿易中執行的需求
有組織的零售業正在擴張,推動現場行銷服務市場的需求成長。隨著現代零售模式在印度二、三線城市普及,以及數位支付、社群電商和店內商品陳列在中國不斷融合,品牌需要更一致、更可衡量的門市執行策略。每開設一家新的現代零售店,都需要處理更多與商品陳列圖合規性、促銷物料擺放、庫存可見性和現場審核相關的任務。這使得零售執行服務提供者的角色不再局限於基本的商品行銷,而是擴展到為品牌在門市的業績提供持續的營運支援。同時,現場行銷服務市場對能夠在單一專案架構下同時服務於現代和傳統通路的混合型現場團隊的需求也在不斷成長。
多市場項目中的高昂人事費用、物流成本和場地成本。
成本上漲仍然是現場行銷服務市場最明顯的阻礙因素之一。多城市計畫需要人員配備、運輸、倉儲、場地協調和現場執行,這些都會迅速推高實施成本,尤其是在大都會圈。在路演、大規模樣品派發活動以及多市場新產品發表會中,這些壓力尤其突出,因為時間上的差異和突發變化會帶來額外成本的風險。因此,代理商和客戶越來越注重管理服務模式、更強大的員工網路和更周密的部署計劃,以保障專案的獲利能力。儘管做出了這些調整,現場行銷服務市場仍然不斷面臨與數位管道的比較,後者能夠以更低的邊際成本擴大覆蓋範圍。
細分市場分析
預計到2025年,店內商品行銷和零售執行服務將佔銷售額的30.72%,並繼續在現場行銷服務市場中佔據核心地位。這一主導地位反映了貨架合規性、貨架庫存檢查、促銷擺放以及在所有管道(包括雜貨店、藥店、會員制倉儲式超市和量販店)執行準確性的實際重要性。零售商對陳列品質和貨架陳列圖合規性的要求也日益嚴格,這進一步增加了對專業執行合作夥伴的需求。對於許多品牌而言,與活動主導營運相比,此現場行銷服務領域的預算自主權仍然較低,因為它直接影響門市績效和促銷合規性。
其他領域也具有重要的商業性價值,因為它們有助於實現各行業的不同轉換目標。產品展示和試用活動仍然至關重要,因為親身體驗會影響購買決策;而潛在客戶開發和客戶獲取計劃在金融服務和其他以轉化主導的宣傳活動中繼續發揮關鍵作用。品牌活化和體驗式宣傳活動預計到2031年將以9.01%的複合年成長率成長,這表明品牌正在將更多預算分配給身臨其境型體驗形式,以期在現場行銷服務市場中獲得更清晰的購買意願結果。活動人員配備和促銷人員管理也不再局限於簡單的人員供應,越來越多的客戶期望將培訓、合規管理和績效考核納入同一服務包中。
區域分析
2025年,北美佔據了現場行銷服務市場26.93%的佔有率,成為貢獻最大的區域。該地區的領先地位源於其成熟且組織完善的零售業、高額的行銷活動支出,以及眾多全球代理機構總部集中於美國和加拿大,這些機構負責協調大規模的多市場項目。美國仍然是主要的收入來源,這得益於其持續的大型消費品項目、超市和量販店管道的廣告投放,以及體育相關的行銷活動預算。廣告主的意願也提振了該地區的市場前景,41%的美國廣告買家計劃在2026年增加面對面和體驗式行銷的支出。儘管其他地區的成長率有所提高,但這些因素共同作用,使北美得以保持主導地位。
預計到2031年,亞太地區將以9.32%的複合年成長率成長,成為現場行銷服務市場成長最快的地區。這一成長主要得益於印度有組織零售網路的擴張、中產階級消費的成長,以及亞洲主要市場中店內促銷活動與數位商務日益融合。中國持續保持領先地位,現代零售模式正不斷將社交商務、數位支付和店內商品行銷整合到單一的購物旅程中。日本、韓國和東南亞地區也透過對高階促銷活動的需求、都市區高密度的零售業態以及代理商對以新加坡為主導的區域中心架構的持續投資,進一步拓展了業務機會。
歐洲在現場行銷服務市場中佔據第二大區域佔有率,其中德國、英國和法國在零售執行、展會參與和品牌體驗項目方面的支出尤為突出。英國也正在經歷顯著的整合,主要參與者正在整合專業職能並簡化品牌結構。 Smolan於2026年1月在英國和愛爾蘭進行的品牌整合,體現了其致力於擴大規模並提升跨市場服務交付一致性的更廣泛承諾。南美洲仍然是一個新興成長區域,大規模公共活動正日益被視為品牌活化的正式平台,而非一次性的贊助機會。在中東,阿拉伯聯合大公國、沙烏地阿拉伯和卡達的零售和娛樂基礎設施持續創造新的需求。同時,非洲仍然是一個充滿新興機會的市場,其中南非、奈及利亞和埃及主導。
其他好處:
- Excel格式的市場預測(ME)表
- 3個月的分析師支持
目錄
第1章:引言
- 研究假設和市場定義
- 調查範圍
第2章:調查方法
第3章執行摘要
第4章 市場狀況
- 市場概覽
- 市場促進因素
- 品牌對可衡量的全通路策略的需求日益成長。
- 有組織零售業的擴張和對現代交易執行的需求
- 人們對產品試用和身臨其境型品牌體驗的興趣日益濃厚
- 即時分析和體驗式測量方法的普及
- 向植根於當地的「微體驗」和社區振興轉型
- 創作者主導的商業和零售娛樂項目需要現場調整。
- 市場限制因素
- 在多個市場開展項目,需要承擔高昂的人事費用、物流成本和場地成本。
- 涵蓋範圍有限且規模化效率低下的挑戰:與數位專屬宣傳活動相比
- 集中式宣傳活動管理正在削弱其與地方社區的連結。
- 推廣負責人離職率上升及訓練負擔加重
- 產業價值鏈分析
- 監理情勢
- 技術展望
- 宏觀經濟因素對市場的影響
- 波特五力分析
第5章 市場規模與成長預測
- 按服務類型
- 品牌活化與體驗式宣傳活動
- 產品展示和樣品分發計劃
- 店內商品行銷及零售執行服務
- 路演和行動行銷巡迴
- 潛在客戶開發和客戶獲取計劃
- 活動人員調度和促銷人員管理。
- 其他服務類型
- 按最終用戶行業分類
- 零售與電子商務
- 消費品/美容
- 媒體與娛樂
- 資訊科技/通訊
- BFSI
- 醫療保健和生命科學
- 其他終端用戶產業
- 按地區
- 北美洲
- 美國
- 加拿大
- 墨西哥
- 南美洲
- 巴西
- 阿根廷
- 智利
- 其他南美國家
- 歐洲
- 德國
- 英國
- 法國
- 義大利
- 西班牙
- 其他歐洲國家
- 亞太地區
- 中國
- 日本
- 印度
- 韓國
- 澳洲
- 其他亞太國家
- 中東
- 阿拉伯聯合大公國
- 沙烏地阿拉伯
- 卡達
- 其他中東國家
- 非洲
- 南非
- 埃及
- 奈及利亞
- 其他非洲國家
- 北美洲
第6章 競爭情勢
- 市場集中度
- 策略趨勢
- 市佔率分析
- 公司簡介
- Acosta Group
- George P. Johnson Company
- Jack Morton Worldwide Inc.
- Pico Far East Holdings Limited
- Denave India Private Limited
- GMR Marketing LLC
- Momentum Worldwide Inc.
- Inspira Marketing Group LLC
- TRO Group Ltd.
- BDS Connected Solutions, LLC
- ASTOUND Group LLC
- NVE Experience Agency
- Sense Marketing Services Ltd.
- Evolve Activation LLC
第7章 市場機會與未來展望
According to Mordor Intelligence, the field marketing services market size is expected to grow from USD 57.41 billion in 2025 to USD 61.73 billion in 2026, and is forecast to reach USD 90.19 billion by 2031, at a 7.88% CAGR over 2026-2031.
This report is Segmented by Service Type (Brand Activation and Experiential Campaigns, Product Demonstrations and Sampling Programs, Roadshows and Mobile Marketing Tours, and More), End-User Industry (Retail and E-Commerce, Consumer Goods and Beauty, Media and Entertainment, BFSI, Healthcare and Life Sciences, and More), and Geography. The Market Forecasts are Provided in Terms of Value (USD).
Global Field Marketing Services Market Trends and Insights
Rising Brand Demand for Measurable Omnichannel Activation
Brands no longer want physical campaigns that end with a traffic count and a photo report. The field marketing services market is moving toward programs that connect physical touchpoints with sales pipelines, digital actions, and follow-up conversion signals. Advertiser sentiment has supported that shift, with 41% of advertising buyers planning to increase spending on in-person and experiential marketing in 2026, indicating that physical activation still carries budget support when tied to broader campaign objectives. QR triggers, NFC interactions, social sharing mechanics, and digital content capture have become part of standard activation planning because they help brands connect on-ground engagement with measurable next steps. This has favored agencies in the field marketing services market that can combine staffing, production, and measurement within one operating model.
Expansion of Organized Retail and Modern Trade Execution Needs
Organized retail expansion is changing, where demand is building across the field marketing services market. As modern trade formats spread into India's tier-2 and tier-3 cities and China continues to integrate digital payments, social commerce, and physical merchandising, brands need store-level execution that is more consistent and measurable. Each additional modern retail outlet adds work tied to planogram compliance, promotional installation, stock visibility, and field auditing. This has widened the role of retail execution providers beyond basic merchandising to include ongoing operational support for brand performance in stores. The field marketing services market is also seeing more demand for hybrid field teams that can work across both modern and traditional channels under a single program structure.
High Labor, Logistics, and Venue Costs in Multi-Market Programs
Cost inflation remains one of the clearest constraints on the field marketing services market. Multi-city programs require staffing, transport, storage, venue coordination, and local execution, which quickly raise delivery costs, especially in large urban markets. These pressures are most visible in roadshows, large sampling programs, and multi-market launches where timing errors or rush changes create additional cost exposure. The result is that agencies and clients are placing more emphasis on managed-service models, stronger staffing networks, and tighter deployment planning to protect program margins. Even with those adjustments, the field marketing services market still faces recurring comparison against digital channels that can extend reach at much lower marginal cost.
Other drivers and restraints analyzed in the detailed report include:
- Growing Preference for Product Trial and Immersive Brand Experiences
- Wider Use of Real-Time Analytics and Experience Measurement
- Limited Reach and Scaling Efficiency Versus Digital-Only Campaigns
For complete list of drivers and restraints, kindly check the Table Of Contents.
Segment Analysis
In-Store Merchandising and Retail Execution Services accounted for 30.72% of revenue in 2025, keeping this category at the center of the field marketing services market. Its lead reflects the practical importance of shelf compliance, on-shelf availability checks, promotional installation, and execution accuracy across grocery, pharmacy, club, and mass channels. Retailers have also become more demanding about display quality and planogram adherence, which strengthens the case for specialized execution partners. For many brands, this part of the field marketing services market remains less discretionary than event-led work because it directly supports store performance and promotional compliance.
The rest of the mix remains commercially important because it serves different conversion goals across sectors. Product Demonstrations and Sampling Programs continue to matter when physical trials influence purchase, while Lead Generation and Customer Acquisition Programs remain relevant in financial services and other conversion-led campaigns. Brand Activation and Experiential Campaigns are projected to grow at a CAGR of 9.01% through 2031, indicating that the field marketing services market is directing more brand spend toward immersive formats with clearer purchase intent outcomes. Event Staffing and Promotional Workforce Management is also moving beyond simple headcount supply, with more clients expecting training, compliance control, and performance benchmarking as part of the same service package.
Complete Report Scope:
- By Service Type
- Brand Activation and Experiential Campaigns
- Product Demonstrations and Sampling Programs
- In-Store Merchandising and Retail Execution Services
- Roadshows and Mobile Marketing Tours
- Lead Generation and Customer Acquisition Programs
- Event Staffing and Promotional Workforce Management
- Other Service Types
- By End-User Industry
- Retail and E-commerce
- Consumer Goods and Beauty
- Media and Entertainment
- IT and Telecom
- BFSI
- Healthcare and Life Sciences
- Other End-User Industries
- By Geography
- North America
- United States
- Canada
- Mexico
- South America
- Brazil
- Argentina
- Chile
- Rest of South America
- Europe
- Germany
- United Kingdom
- France
- Italy
- Spain
- Rest of Europe
- Asia-Pacific
- China
- Japan
- India
- South Korea
- Australia
- Rest of Asia-Pacific
- Middle East
- United Arab Emirates
- Saudi Arabia
- Qatar
- Rest of Middle East
- Africa
- South Africa
- Egypt
- Nigeria
- Rest of Africa
- North America
Geography Analysis
North America accounted for 26.93% of the field marketing services market share in 2025, which made it the largest regional contributor. The region's lead came from mature organized retail, high activation spending, and the concentration of global agency headquarters based in the United States and Canada that coordinate large multi-market programs. The United States remained the main revenue engine because consumer goods programs, grocery and mass-retail execution, and sports-linked activation budgets stayed large. Advertiser intent also supported the regional outlook, with 41% of US advertising buyers planning to increase spending on in-person and experiential marketing in 2026. That combination kept North America in a leading position in the field marketing services market, even as growth rates in other regions rose.
Asia-Pacific is projected to expand at a CAGR of 9.32% through 2031, making it the fastest-growing geography in the field marketing services market. Growth is being supported by organized retail expansion in India, rising middle-class consumption, and a stronger link between physical activation and digital commerce across major Asian markets. China continues to stand out because modern trade formats increasingly connect social commerce, digital payments, and in-store merchandising into a single shopper journey. Japan, South Korea, and Southeast Asia add to the opportunity set through premium activation demand, urban retail density, and growing agency investment in Singapore-led regional hub structures.
Europe held the second-largest regional position in the field marketing services market, with Germany, the United Kingdom, and France leading spend across retail execution, trade show engagement, and branded experience programs. The United Kingdom has also become a visible consolidation point as larger operators absorb specialist capabilities and simplify brand structures. Smollan's January 2026 brand unification across the United Kingdom and Ireland reflected that wider push toward scale and consistency in cross-market delivery. South America remained an emerging growth zone led by Brazil, where large public events are increasingly treated as formal platforms for brand activation rather than one-off sponsorship moments. The Middle East continued to build new demand through retail and entertainment infrastructure in the United Arab Emirates, Saudi Arabia, and Qatar, while Africa remained an earlier-stage opportunity led by South Africa, Nigeria, and Egypt.
- Acosta Group
- George P. Johnson Company
- Jack Morton Worldwide Inc.
- Pico Far East Holdings Limited
- Denave India Private Limited
- GMR Marketing LLC
- Momentum Worldwide Inc.
- Inspira Marketing Group LLC
- TRO Group Ltd.
- BDS Connected Solutions, LLC
- ASTOUND Group LLC
- NVE Experience Agency
- Sense Marketing Services Ltd.
- Evolve Activation LLC
Additional Benefits:
- The market estimate (ME) sheet in Excel format
- 3 months of analyst support
TABLE OF CONTENTS
1 INTRODUCTION
- 1.1 Study Assumptions and Market Definition
- 1.2 Scope of the Study
2 RESEARCH METHODOLOGY
3 EXECUTIVE SUMMARY
4 MARKET LANDSCAPE
- 4.1 Market Overview
- 4.2 Market Drivers
- 4.2.1 Rising Brand Demand for Measurable Omnichannel Activation
- 4.2.2 Expansion of Organized Retail and Modern Trade Execution Needs
- 4.2.3 Growing Preference for Product Trial and Immersive Brand Experiences
- 4.2.4 Wider Use of Real-Time Analytics and Experience Measurement
- 4.2.5 Shift Toward Micro-Experiences and Localized Community Activations
- 4.2.6 Creator-Led Commerce and Retailtainment Programs Requiring On-Ground Orchestration
- 4.3 Market Restraints
- 4.3.1 High Labor, Logistics, and Venue Costs in Multi-Market Programs
- 4.3.2 Limited Reach and Scaling Efficiency Versus Digital-Only Campaigns
- 4.3.3 Centralized Campaign Governance Weakening Local Relevance
- 4.3.4 Rising Promotional Talent Churn and Training Burdens
- 4.4 Industry Value Chain Analysis
- 4.5 Regulatory Landscape
- 4.6 Technological Outlook
- 4.7 Impact of Macroeconomic Factors on the Market
- 4.8 Porter's Five Forces Analysis
- 4.8.1 Threat of New Entrants
- 4.8.2 Bargaining Power of Buyers
- 4.8.3 Bargaining Power of Suppliers
- 4.8.4 Threat of Substitutes
- 4.8.5 Industry Rivalry
5 MARKET SIZE AND GROWTH FORECASTS (VALUE)
- 5.1 By Service Type
- 5.1.1 Brand Activation and Experiential Campaigns
- 5.1.2 Product Demonstrations and Sampling Programs
- 5.1.3 In-Store Merchandising and Retail Execution Services
- 5.1.4 Roadshows and Mobile Marketing Tours
- 5.1.5 Lead Generation and Customer Acquisition Programs
- 5.1.6 Event Staffing and Promotional Workforce Management
- 5.1.7 Other Service Types
- 5.2 By End-User Industry
- 5.2.1 Retail and E-commerce
- 5.2.2 Consumer Goods and Beauty
- 5.2.3 Media and Entertainment
- 5.2.4 IT and Telecom
- 5.2.5 BFSI
- 5.2.6 Healthcare and Life Sciences
- 5.2.7 Other End-User Industries
- 5.3 By Geography
- 5.3.1 North America
- 5.3.1.1 United States
- 5.3.1.2 Canada
- 5.3.1.3 Mexico
- 5.3.2 South America
- 5.3.2.1 Brazil
- 5.3.2.2 Argentina
- 5.3.2.3 Chile
- 5.3.2.4 Rest of South America
- 5.3.3 Europe
- 5.3.3.1 Germany
- 5.3.3.2 United Kingdom
- 5.3.3.3 France
- 5.3.3.4 Italy
- 5.3.3.5 Spain
- 5.3.3.6 Rest of Europe
- 5.3.4 Asia-Pacific
- 5.3.4.1 China
- 5.3.4.2 Japan
- 5.3.4.3 India
- 5.3.4.4 South Korea
- 5.3.4.5 Australia
- 5.3.4.6 Rest of Asia-Pacific
- 5.3.5 Middle East
- 5.3.5.1 United Arab Emirates
- 5.3.5.2 Saudi Arabia
- 5.3.5.3 Qatar
- 5.3.5.4 Rest of Middle East
- 5.3.6 Africa
- 5.3.6.1 South Africa
- 5.3.6.2 Egypt
- 5.3.6.3 Nigeria
- 5.3.6.4 Rest of Africa
- 5.3.1 North America
6 COMPETITIVE LANDSCAPE
- 6.1 Market Concentration
- 6.2 Strategic Moves
- 6.3 Market Share Analysis
- 6.4 Company Profiles (includes Global Level Overview, Market Level Overview, Core Segments, Financials as available, Strategic Information, Market Rank/Share, Products and Services, Recent Developments)
- 6.4.1 Acosta Group
- 6.4.2 George P. Johnson Company
- 6.4.3 Jack Morton Worldwide Inc.
- 6.4.4 Pico Far East Holdings Limited
- 6.4.5 Denave India Private Limited
- 6.4.6 GMR Marketing LLC
- 6.4.7 Momentum Worldwide Inc.
- 6.4.8 Inspira Marketing Group LLC
- 6.4.9 TRO Group Ltd.
- 6.4.10 BDS Connected Solutions, LLC
- 6.4.11 ASTOUND Group LLC
- 6.4.12 NVE Experience Agency
- 6.4.13 Sense Marketing Services Ltd.
- 6.4.14 Evolve Activation LLC
7 MARKET OPPORTUNITIES AND FUTURE OUTLOOK
- 7.1 White-Space and Unmet-Need Assessment

 現場服務管理(FSM):市場佔有率分析、行業趨勢和統計數據、成長預測(2026-2031 年)
 現場服務管理市場-2026-2032年全球市場預測
 現場服務管理市場報告:按解決方案、服務、部署類型、組織規模、最終用戶產業和地區分類(2026-2034 年)
 現場服務管理市場規模、佔有率和趨勢分析報告:按組件、部署類型、企業規模、最終用途、地區和細分市場預測(2026-2033 年)
 2026年全球現場服務管理解決方案市場報告
 2026-2030年全球現場服務管理(FSM)軟體市場2026年全球現場服務管理市場報告
 現場服務管理市場分析及預測(至2035年):依類型、產品類型、服務、技術、組件、應用、部署類型、最終用戶、模組及功能分類
 全球現場服務管理市場規模、佔有率、趨勢和成長分析報告(2026-2034年)
 現場服務管理市場 - 全球產業規模、佔有率、趨勢、機會及預測(按組件、部署模式、公司規模、產業垂直領域、地區和競爭格局分類,2021-2031 年)