


 |
市場調查報告書
商品編碼
2117535
行銷組合建模軟體:市場佔有率分析、產業趨勢與統計資料、成長預測(2026-2031)Marketing Mix Modeling Software - Market Share Analysis, Industry Trends & Statistics, Growth Forecasts (2026 - 2031) |
||||||

※ 本網頁內容可能與最新版本有所差異。詳細情況請與我們聯繫。
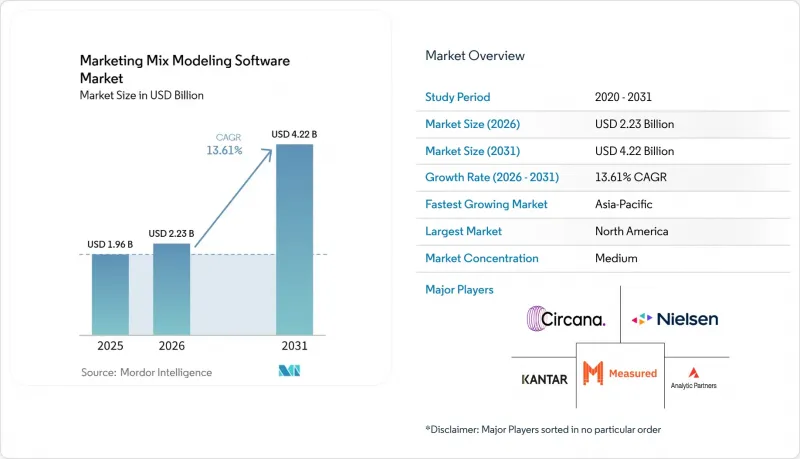
根據 Mordor Intelligence 預測,行銷組合建模軟體的市場規模預計將從 2025 年的 19.6 億美元和 2026 年的 22.3 億美元成長到 2031 年的 42.2 億美元,2026 年至 2031 年的年複合成長率(CAGR)為 13.61%。
本報告按組件(軟體和服務)、部署類型(雲端和本地部署)、企業規模(大型企業和中小企業)、最終用戶行業(消費品、零售和電子商務、媒體和娛樂、IT和電信、汽車及其他)以及地區進行細分。市場預測以美元計價。
全球行銷組合建模軟體市場趨勢與洞察
轉向以隱私為先的測量方法
受基於 Cookie 和用戶級屬性歸因系統持續衰退的推動,行銷組合建模軟體市場正蓬勃發展。這些系統已無法像以往一樣為眾多廣告主提供可靠的跨通路證據。主流隱私框架和更嚴格的資料最小化實踐正迫使品牌轉向不依賴個人識別識別碼或持續追蹤的匯總衡量方法。蘋果的「應用追蹤透明度」政策也加速了這一轉變,因為行動優先的廣告商失去了許多曾經支撐詳細用戶通行證分析的訊號。在此背景下,行銷組合建模非常適合新環境,因為它透過對匯總的支出和績效數據進行統計推斷,而不是依賴單一識別碼。谷歌於 2025 年 1 月發布的「Meridian」為行銷組合建模軟體市場提供了強力的支持,將注重隱私的貝葉斯建模定位為團隊更廣泛部署和運營的選擇。此外,合規計畫的改進增強了第一方資料的管理,使得許多品牌能夠為其模型提供比幾年前更清晰、更結構化的輸入資料。
來自人工智慧搜尋和答案引擎的流量作為一個新的模型變量
行銷組合建模軟體市場也正受到人工智慧驅動的發現功能興起的影響。用戶在點擊傳統廣告之前,就已經透過 Google AI Overviews、Perplexity 和 ChatGPT 等平台搜尋,從而影響購買決策。這種轉變造成了衡量指標的缺失。一些曾經直接體現在付費搜尋結果中的需求,如今透過輔助發現之旅產生,這使得傳統的通路框架難以追蹤。如果品牌不單獨對這類流量進行建模,則可能低估內容、自然搜尋可見度和公共關係在產生收入中的作用,進而扭曲整個行銷漏斗的預算分配。一篇發表於 2026 年《未來商業期刊》(Future Business Journal)的同行評審論文指出,人工智慧主導的發現需要建立衡量、資源分配和組織學習之間的新反饋機制,這與行銷組合建模軟體市場的當前發展方向高度契合。 Google 2026 年 2 月推出的「Meridian 情境規劃器」正在加速這一轉變。此舉旨在為需要近乎即時檢驗頻道行為變化的團隊提供更友善的使用者介面,以進行基於假設的預算建模。隨著人工智慧輔助發現技術在採購流程中佔據越來越大的佔有率,能夠將這些訊號融入決策工作流程的供應商有望獲得競爭優勢。
低支出水準下模型表現較差
行銷組合建模軟體市場在推廣應用方面仍面臨許多挑戰。這是因為可靠的模型需要充足的歷史支出波動數據,才能準確評估通路效應。那些每月媒體支出水準低於足以支撐有效數據深度的品牌,往往會得到不一致的輸出結果,導致在模型被納入預算流程之前就對其失去信心。這個問題不僅僅是關於總支出;數據品質取決於是否在足夠長的時間內,從多個管道持續輸入一致的每週數據,從而區分真實訊號和雜訊。當廣告主試圖按地區、產品線和零售合作夥伴進行細分分析時,這項挑戰會更加突出,因為資料樣本越小,準確性就越低。開放原始碼工具雖然降低了存取成本,但並不能消除資料量的基本要求。因此,儘管從統計學角度來看,行銷組合建模軟體市場仍然難以進入,但從經濟角度來看,它相對容易取得。這種影響在新興的數位廣告領域尤其明顯,預算正在迅速成長,但用於訓練可靠模型的足夠清晰的歷史數據尚未累積。
細分市場分析
預計到2025年,軟體將佔據行銷組合建模軟體市場佔有率的76.18%,而服務領域預計到2031年將以15.77%的複合年成長率成長。這一細分錶明,該行業正朝著基於平台的交付模式發生決定性轉變,其中周期性訂閱、模型自動化和受管理的工作流程正在取代大部分傳統的基於專案的諮詢結構。軟體仍然至關重要,因為買家越來越需要一個可復現的操作層,使他們能夠檢索最新的輸入資料、重新運行模型並支援規劃討論,而無需每個週期都從頭開始。對於那些需要管治、審計追蹤以及跨行銷、分析和財務團隊共用存取權限的公司而言,這種吸引力尤其強烈,因為這些需求僅靠一次性的諮詢服務難以滿足。因此,儘管許多客戶仍然依賴外部專家將模型輸出與可靠的預算決策聯繫起來,但行銷組合建模軟體市場的大部分收入仍然來自平台。
服務業的快速成長源於這樣一個事實:對於許多組織,尤其是那些初涉此領域的組織而言,實施、模型設計、校準和解釋仍然充滿挑戰。由於中型企業和新用戶通常希望在自身能力建立之前將資料管道維護、假設檢驗和經營團隊規劃支援外包,因此託管服務在行銷組合建模軟體市場中日益受到重視。實施後的前 6 至 18 個月尤其關鍵,因為許多買家在軟體成為標準規劃流程的一部分之前,需要協助來檢驗規格並基於模型輸出建立決策流程。 Prescient AI 的「驗證層」透過讓品牌能夠在模型評估過程中比較設定並納入增量測試、售後調查和歸因訊號來滿足這一需求。雖然隨著時間的推移,其中一些工作流程將進一步整合到產品介面中,但由於組織實施在很大程度上依賴解釋、變更管理、相關人員的信任以及技術準確性,因此服務業的商機仍然強勁。
到2025年,基於雲端的部署將佔據行銷組合建模軟體市場79.61%的佔有率,預計到2031年將以14.36%的複合年成長率成長。如此巨大的市場佔有率和最快的成長速度表明,在運算密集且持續更新的建模環境中,買家如今強烈傾向於「雲端優先」的測量架構。行銷組合建模對運算能力和工作流程調整提出了很高的要求,因為貝葉斯抽樣、情境測試和頻繁的資料更新都需要靈活的處理和可靠的編配。在許多情況下,雲端部署比本地環境更能有效地滿足這些需求,尤其對於需要跨職能和跨地區存取共用規劃成果的分散式團隊更是如此。因此,行銷組合建模軟體市場正在圍繞雲端交付進行整合,這不僅是因為雲端擴展成本更低,還因為尖端產品功能首先是為雲端環境設計的。
儘管安全性和合規性問題依然存在,但隨著企業級控制、身份驗證以及私有雲端和主權雲選項的日益普及,這種平衡正在轉變。 Recast 作為符合 SOC 2 標準的平台和認證的 Meta Measurement Partner,正是雲端服務供應商如何滿足受嚴格監管買家的信任需求的一個例證。本地部署不會完全消失,因為在金融服務和醫療保健等資料居住規則和內部管治標準仍然嚴格的領域,本地部署在某些用例中仍然至關重要。然而,目前的產品發展方向優先考慮雲端架構,領先的供應商正在建立依賴彈性基礎設施和持續整合的 AI 原生營運層。 NIQ Cadence 作為一款雲端原生混合 AI 作業系統發布,清楚地展現了這一趨勢,並指明了行銷組合建模軟體市場中尖端功能的發展方向。
區域分析
截至2025年,北美市場佔據行銷組合建模軟體市場34.61%的佔有率,而亞太地區預計到2031年將以17.39%的複合年成長率成長。美國仍然是該地區的核心市場,因為消費品、零售、金融服務和媒體行業的主要廣告商已經將持續建模視為企業規劃的一部分,而不是一次性的分析項目。該地區的供應商格局也非常強大,NIQ、Circana、Analytic Partners和Measured等公司都在積極運營,而該市場往往能夠迅速採用新的衡量功能和工作流程變更。根據Google發布的《Think with Google》商業衡量報告,北美買家擴大將建模不僅用於宣傳活動後的評估,還用於主動的預算規劃,這進一步鞏固了該地區在決定整個行銷組合建模軟體市場產品發展方向方面的作用。此外,尼爾森於 2026 年在美國市場推出「預測銷售提升」服務,反映出許多尖端商業化措施在廣泛部署之前仍先在該地區啟動。
亞太地區是行銷組合模型軟體市場成長最快的地區。這是因為印度、中國、韓國、日本和澳洲的廣告主正從截然不同的起點出發,擴大其數位投資。中國分散的平台環境、印度不斷成長的數位廣告基礎以及日本成熟的消費品生態系統,各自都為該模型的傳播提供了獨特的推動因素。 Intage 在日本提供行銷組合模型服務的長期經驗表明,這種方法在該地區並非全新,而當前的成長是由市場擴張、在地化以及前期培訓所驅動的。 Meridian、Robyn 和 MixCast 等在地化工具正在降低訪問和語言障礙,預計這將進一步擴大該模型的應用範圍,使其超越大型跨國廣告主的範疇。
歐洲在行銷組合模型 (MMM) 軟體市場中仍然佔據相當大的收入佔有率,其中德國、英國和法國是重要的市場中心。 GDPR 時代的監管力度使得符合隱私保護的衡量方法在全部區域更具吸引力,因為它減少了對那些難以證明其合理性和可維護性的追蹤方法的依賴。 Analytic Partners 於 2025 年 1 月收購 Analytics,凸顯了歐洲當地企業覆蓋的價值,並表明了該地區對於透過收購進行有針對性的業務擴張的重要性。南美和中東及非洲地區仍處於發展初期,但隨著數位投資、第一方數據利用和衡量成熟度的提高,它們在巴西和阿拉伯聯合大公國的重要性日益凸顯。
其他好處:
- Excel格式的市場預測(ME)表
- 3個月的分析師支持
目錄
第1章:引言
- 研究假設和市場定義
- 調查範圍
第2章:調查方法
第3章執行摘要
第4章 市場狀況
- 市場概覽
- 市場促進因素
- 過渡到以隱私為優先的測量方法。
- 來自人工智慧搜尋和答案引擎的流量作為一個新的模型變量
- 重新分配預算給課責更重的銷售管道的壓力
- 資金籌措到位後,就需要進行情境規劃。
- 透過調整增量效應來擴展 MMM 工作流程
- 調查方法透明度作為採購標準
- 市場限制因素
- 低支出水準下模型表現較差
- 在分散的行銷技術堆疊中,資料整合帶來的負擔日益沉重。
- 預算決策前的漫長檢驗週期
- 行銷科學家與因果分析師短缺
- 產業價值鏈分析
- 宏觀經濟因素對市場的影響
- 監理情勢
- 技術展望
- 波特五力分析
第5章 市場規模與成長預測
- 按組件
- 軟體
- 服務
- 專業服務
- 託管服務
- 不同的發展
- 基於雲端的
- 現場
- 按公司規模
- 大公司
- 小型企業
- 按最終用戶行業分類
- 面向消費者的包裝商品
- 零售與電子商務
- 媒體與娛樂
- IT/通訊
- 銀行、金融服務和保險(BFSI)
- 醫療保健和生命科學
- 車
- 其他終端用戶產業
- 按地區
- 北美洲
- 美國
- 加拿大
- 墨西哥
- 南美洲
- 巴西
- 阿根廷
- 其他南美國家
- 歐洲
- 德國
- 英國
- 法國
- 義大利
- 西班牙
- 俄羅斯
- 其他歐洲國家
- 亞太地區
- 中國
- 日本
- 印度
- 韓國
- 澳洲
- 其他亞太國家
- 中東和非洲
- 中東
- 阿拉伯聯合大公國
- 沙烏地阿拉伯
- 土耳其
- 其他中東國家
- 非洲
- 南非
- 埃及
- 其他非洲國家
- 中東
- 北美洲
第6章 競爭情勢
- 市場集中度
- 策略趨勢
- 市佔率分析
- 公司簡介
- Nielsen Holdings plc
- Kantar Group Limited
- Circana, LLC
- Analytic Partners, Inc.
- Measured, Inc.
- Ipsos MMA, Inc.
- Recast Analytics, Inc.
- Google LLC
- Meta Platforms, Inc.
- Adobe Inc.
- Keen Decision Systems, Inc.
- Prescient AI, Inc.
- Lifesight Pte. Ltd.
- Northbeam, Inc.
- Triple Whale, Inc.
- Rockerbox, Inc.
- WorkMagic, Inc.
- Marketing Evolution, Inc.
- Gain Theory Limited
- Neustar, Inc.
- Salesforce, Inc.
- Mutinex Pty Ltd.
- SegmentStream Ltd.
- Cometly, Inc.
第7章 市場機會與未來展望
According to Mordor Intelligence, the marketing mix modeling software market size is projected to expand from USD 1.96 billion in 2025 and USD 2.23 billion in 2026 to USD 4.22 billion by 2031, registering a CAGR of 13.61% between 2026 to 2031.
This report is Segmented by Component (Software, and Services), Deployment (Cloud-Based, and On-Premises), Enterprise Size (Large Enterprises, and Small and Medium Enterprises), End User Industry (Consumer Packaged Goods, Retail and E-Commerce, Media and Entertainment, IT and Telecommunication, Automotive, and More), and Geography. The Market Forecasts are Provided in Terms of Value (USD).
Global Marketing Mix Modeling Software Market Trends and Insights
Privacy-First Measurement Shift
The marketing mix modeling software market is gaining force from the steady erosion of cookie-based and user-level attribution systems, which no longer provide the same level of dependable cross-channel evidence for many advertisers. Major privacy frameworks and stricter data minimization practices have pushed brands toward aggregate measurement methods that do not depend on personal identifiers or persistent tracking. Apple's App Tracking Transparency policy added to this shift because mobile-first advertisers lost a large part of the signal that had once supported detailed user-path analysis. In this setting, marketing mix modeling fits the new environment because it works through statistical inference on aggregated spend and outcome data rather than individual identities. Google's January 2025 release of Meridian gave the marketing mix modeling software market a major validation point because it positioned privacy-safe Bayesian modeling as a production-grade option that teams could deploy more broadly. Better compliance programs are also improving first-party data discipline, which means many brands are feeding cleaner and more structured inputs into models than they did a few years ago.
AI Search and Answer Engine Traffic as a New Model Variable
The marketing mix modeling software market is also being shaped by the rise of AI-assisted discovery, where platforms such as Google AI Overviews, Perplexity, and ChatGPT search influence consideration before a user ever clicks a traditional ad. That change creates a measurement gap because some demand that once appeared as a direct paid-search outcome now develops through assisted discovery journeys that are harder to trace with older channel frameworks. Brands that do not model this traffic separately risk understating the role of content, organic visibility, and public relations in revenue generation, which can distort budget allocation across the funnel. A 2026 peer-reviewed paper in Future Business Journal argued that AI-driven discovery requires a new feedback loop between measurement, resource allocation, and organizational learning, which aligns closely with the current direction of the marketing mix modeling software market. Google's Scenario Planner for Meridian, introduced in February 2026, supports this shift because it brings what-if budget modeling into a more accessible interface for teams that need to test changing channel behavior in near real time. As AI-assisted discovery takes a larger share of the path to purchase, vendors that can operationalize these signals inside decision workflows are likely to gain an advantage.
Weak Model Performance at Low Spend Levels
The marketing mix modeling software market still faces a hard adoption floor because reliable models need enough historical variation in spend to estimate channel effects with confidence. Brands operating below monthly media spend levels that support meaningful data depth often receive unstable outputs, which weakens trust in the model before it can become part of budget ownership. The issue is not just total spend, because data quality also depends on having consistent weekly inputs across several channels over a long enough period to separate real signal from noise. This becomes even more difficult when advertisers try to split analysis by geography, product line, or retail partner, since smaller data slices further weaken precision. Open-source tools reduce access cost, but they do not remove the basic data volume requirement, so the marketing mix modeling software market remains more accessible financially than statistically. The effect is most visible in newer digital advertising environments where budgets are growing quickly but have not yet built enough clean history for dependable model training.
Other drivers and restraints analyzed in the detailed report include:
- Budget Reallocation Pressure Toward Higher-Accountability Channels
- Demand for Finance-Ready Scenario Planning
- Data Integration Burden Across Fragmented Marketing Stacks
For complete list of drivers and restraints, kindly check the Table Of Contents.
Segment Analysis
Software held 76.18% of the marketing mix modeling software market share in 2025, while services are projected to expand at a 15.77% CAGR through 2031. This split shows that the category has moved decisively toward platform-based delivery, where recurring subscriptions, model automation, and managed workflows have replaced a larger part of the old project-by-project consulting structure. Software remains the anchor because buyers increasingly want a repeatable operating layer that can pull in fresh inputs, rerun models, and support planning discussions without restarting the process from zero each cycle. The appeal is strongest for enterprises that need governance, audit trails, and shared access across marketing, analytics, and finance teams, since these needs are harder to meet with one-off advisory work alone. The marketing mix modeling software market is therefore generating most of its revenue from platforms, even though many customers still depend on outside expertise to turn model outputs into confident budget decisions.
Services are growing faster because implementation, model design, calibration, and interpretation remain difficult for many organizations, especially those that are adopting the category for the first time. Managed services are gaining room in the marketing mix modeling software market because mid-sized and newer adopters often want external partners to maintain data pipelines, review assumptions, and support executive planning while internal capability develops. The first 6 to 18 months after deployment are especially important because many buyers need help validating specifications and building decision routines around model outputs before the software becomes part of standard planning. Prescient AI's Validation Layer points to this demand because it lets brands compare configurations and bring in incrementality tests, post-purchase surveys, and attribution signals during model evaluation. Over time, some of these workflows will move further into product interfaces, but the services opportunity remains strong because organizational adoption still depends on interpretation, change management, and stakeholder trust as much as on technical accuracy.
Cloud-based deployment accounted for 79.61% of the marketing mix modeling software market size in 2025 and is projected to grow at a 14.36% CAGR through 2031. That combination of dominant share and fastest growth shows how strongly buyers now prefer cloud-first measurement architecture for computationally heavy and continuously updated modeling environments. Marketing mix modeling places high demand on compute and workflow coordination because Bayesian sampling, scenario testing, and frequent data refreshes all require flexible processing and reliable orchestration. Cloud deployment supports this need more efficiently than on-premises setups in many cases, particularly for distributed teams that need access to shared planning outputs across functions and geographies. The marketing mix modeling software market is therefore consolidating around cloud delivery, not only because it is cheaper to scale, but also because the most advanced product features are being designed for that environment first.
Security and compliance concerns have not disappeared, but the balance has shifted as enterprise-grade controls, certifications, and private or sovereign cloud options have become more accepted. Recast's positioning as a SOC 2 compliant platform and a certified Meta Measurement Partner is one example of how cloud providers are addressing the trust requirements of more regulated buyers. On-premises deployment still matters in some financial services and healthcare use cases where data residency rules or internal governance standards remain strict, so the segment is not disappearing outright. Even so, current product direction favors cloud architecture because leading vendors are building AI-native operating layers that depend on elastic infrastructure and continuous integration. NIQ Cadence illustrates this well because it was launched as a cloud-native compound AI operating system, which signals where frontier capabilities in the marketing mix modeling software market are now being built.
Complete Report Scope:
- By Component
- Software
- Services
- Professional Services
- Managed Services
- By Deployment
- Cloud-Based
- On-Premises
- By Enterprise Size
- Large Enterprises
- Small and Medium Enterprises
- By End User Industry
- Consumer Packaged Goods
- Retail and E-Commerce
- Media and Entertainment
- IT and Telecommunication
- Banking, Financial Services, and Insurance (BFSI)
- Healthcare and Life Sciences
- Automotive
- Other End User Industries
- By Geography
- North America
- United States
- Canada
- Mexico
- South America
- Brazil
- Argentina
- Rest of South America
- Europe
- Germany
- United Kingdom
- France
- Italy
- Spain
- Russia
- Rest of Europe
- Asia-Pacific
- China
- Japan
- India
- South Korea
- Australia
- Rest of Asia-Pacific
- Middle East and Africa
- Middle East
- United Arab Emirates
- Saudi Arabia
- Turkey
- Rest of Middle East
- Africa
- South Africa
- Egypt
- Rest of Africa
- Middle East
- North America
Geography Analysis
North America held 34.61% of the marketing mix modeling software market share in 2025, while Asia-Pacific is projected to expand at a 17.39% CAGR through 2031. The United States remains the center of the regional base because large advertisers in CPG, retail, financial services, and media already treat continuous modeling as part of enterprise planning rather than as an occasional analytics project. The vendor landscape in the region is also dense, with NIQ, Circana, Analytic Partners, and Measured operating in a market that is often the first to absorb new measurement capabilities and workflow changes. Think with Google's business measurement material shows that North American buyers are increasingly using modeling for active budget planning rather than only post-campaign review, which strengthens the region's role in shaping product direction across the marketing mix modeling software market. Nielsen's Predictive Sales Lift launch for the U.S. market in 2026 also reflects how many leading-edge commercialization moves still start in this region before broader rollout.
Asia-Pacific is the fastest-growing regional part of the marketing mix modeling software market because advertisers across India, China, South Korea, Japan, and Australia are expanding digital investment from very different starting points. China's fragmented platform environment, India's scaling digital advertising base, and Japan's mature consumer goods ecosystem each create separate reasons for broader model adoption. Intage's long MMM service history in Japan shows that the region is not entirely new to the practice, and that current growth is as much about expansion and localization as first-time education. Meridian, Robyn, and localized tools such as MixCast are lowering access and language barriers, which should keep adoption broadening beyond the largest multinational advertisers.
Europe still represents a substantial share of revenue in the marketing mix modeling software market, with Germany, the United Kingdom, and France standing out as major national bases. GDPR-era enforcement has made privacy-compliant measurement structurally more attractive across the region because it reduces reliance on tracking methods that have become harder to defend and maintain. Analytic Partners' January 2025 acquisition of Analyx highlighted the value of local enterprise coverage in Europe and showed that the region is important enough to justify targeted expansion through acquisition. South America and the Middle East and Africa remain earlier-stage areas, but Brazil and the United Arab Emirates are becoming more relevant as digital investment, first-party data practices, and measurement maturity improve.
- Nielsen Holdings plc
- Kantar Group Limited
- Circana, LLC
- Analytic Partners, Inc.
- Measured, Inc.
- Ipsos MMA, Inc.
- Recast Analytics, Inc.
- Google LLC
- Meta Platforms, Inc.
- Adobe Inc.
- Keen Decision Systems, Inc.
- Prescient AI, Inc.
- Lifesight Pte. Ltd.
- Northbeam, Inc.
- Triple Whale, Inc.
- Rockerbox, Inc.
- WorkMagic, Inc.
- Marketing Evolution, Inc.
- Gain Theory Limited
- Neustar, Inc.
- Salesforce, Inc.
- Mutinex Pty Ltd.
- SegmentStream Ltd.
- Cometly, Inc.
Additional Benefits:
- The market estimate (ME) sheet in Excel format
- 3 months of analyst support
TABLE OF CONTENTS
1 INTRODUCTION
- 1.1 Study Assumptions and Market Definition
- 1.2 Scope of the Study
2 RESEARCH METHODOLOGY
3 EXECUTIVE SUMMARY
4 MARKET LANDSCAPE
- 4.1 Market Overview
- 4.2 Market Drivers
- 4.2.1 Privacy-First Measurement Shift
- 4.2.2 AI Search and Answer Engine Traffic as a New Model Variable
- 4.2.3 Budget Reallocation Pressure Toward Higher-Accountability Channels
- 4.2.4 Demand For Finance-Ready Scenario Planning
- 4.2.5 Expansion of Incrementality-Calibrated MMM Workflows
- 4.2.6 Methodology Transparency as a Purchase Criterion
- 4.3 Market Restraints
- 4.3.1 Weak Model Performance At Low Spend Levels
- 4.3.2 Data Integration Burden Across Fragmented Marketing Stacks
- 4.3.3 Long Validation Cycles Before Budget Ownership
- 4.3.4 Shortage Of Marketing Scientists And Causal Analytics Talent
- 4.4 Industry Value-Chain Analysis
- 4.5 Impact of Macroeconomic Factors on the Market
- 4.6 Regulatory Landscape
- 4.7 Technological Outlook
- 4.8 Porter's Five Forces Analysis
- 4.8.1 Bargaining Power of Buyers
- 4.8.2 Bargaining Power of Suppliers
- 4.8.3 Threat of New Entrants
- 4.8.4 Threat of Substitutes
- 4.8.5 Intensity of Competitive Rivalry
5 MARKET SIZE AND GROWTH FORECASTS (VALUE)
- 5.1 By Component
- 5.1.1 Software
- 5.1.2 Services
- 5.1.2.1 Professional Services
- 5.1.2.2 Managed Services
- 5.2 By Deployment
- 5.2.1 Cloud-Based
- 5.2.2 On-Premises
- 5.3 By Enterprise Size
- 5.3.1 Large Enterprises
- 5.3.2 Small and Medium Enterprises
- 5.4 By End User Industry
- 5.4.1 Consumer Packaged Goods
- 5.4.2 Retail and E-Commerce
- 5.4.3 Media and Entertainment
- 5.4.4 IT and Telecommunication
- 5.4.5 Banking, Financial Services, and Insurance (BFSI)
- 5.4.6 Healthcare and Life Sciences
- 5.4.7 Automotive
- 5.4.8 Other End User Industries
- 5.5 By Geography
- 5.5.1 North America
- 5.5.1.1 United States
- 5.5.1.2 Canada
- 5.5.1.3 Mexico
- 5.5.2 South America
- 5.5.2.1 Brazil
- 5.5.2.2 Argentina
- 5.5.2.3 Rest of South America
- 5.5.3 Europe
- 5.5.3.1 Germany
- 5.5.3.2 United Kingdom
- 5.5.3.3 France
- 5.5.3.4 Italy
- 5.5.3.5 Spain
- 5.5.3.6 Russia
- 5.5.3.7 Rest of Europe
- 5.5.4 Asia-Pacific
- 5.5.4.1 China
- 5.5.4.2 Japan
- 5.5.4.3 India
- 5.5.4.4 South Korea
- 5.5.4.5 Australia
- 5.5.4.6 Rest of Asia-Pacific
- 5.5.5 Middle East and Africa
- 5.5.5.1 Middle East
- 5.5.5.1.1 United Arab Emirates
- 5.5.5.1.2 Saudi Arabia
- 5.5.5.1.3 Turkey
- 5.5.5.1.4 Rest of Middle East
- 5.5.5.2 Africa
- 5.5.5.2.1 South Africa
- 5.5.5.2.2 Egypt
- 5.5.5.2.3 Rest of Africa
- 5.5.5.1 Middle East
- 5.5.1 North America
6 COMPETITIVE LANDSCAPE
- 6.1 Market Concentration
- 6.2 Strategic Moves
- 6.3 Market Share Analysis
- 6.4 Company Profiles (includes Global Level Overview, Market Level Overview, Core Segments, Financials as available, Strategic Information, Market Rank/Share, Products and Services, Recent Developments)
- 6.4.1 Nielsen Holdings plc
- 6.4.2 Kantar Group Limited
- 6.4.3 Circana, LLC
- 6.4.4 Analytic Partners, Inc.
- 6.4.5 Measured, Inc.
- 6.4.6 Ipsos MMA, Inc.
- 6.4.7 Recast Analytics, Inc.
- 6.4.8 Google LLC
- 6.4.9 Meta Platforms, Inc.
- 6.4.10 Adobe Inc.
- 6.4.11 Keen Decision Systems, Inc.
- 6.4.12 Prescient AI, Inc.
- 6.4.13 Lifesight Pte. Ltd.
- 6.4.14 Northbeam, Inc.
- 6.4.15 Triple Whale, Inc.
- 6.4.16 Rockerbox, Inc.
- 6.4.17 WorkMagic, Inc.
- 6.4.18 Marketing Evolution, Inc.
- 6.4.19 Gain Theory Limited
- 6.4.20 Neustar, Inc.
- 6.4.21 Salesforce, Inc.
- 6.4.22 Mutinex Pty Ltd.
- 6.4.23 SegmentStream Ltd.
- 6.4.24 Cometly, Inc.
7 MARKET OPPORTUNITIES AND FUTURE OUTLOOK
- 7.1 White-Space and Unmet-Need Assessment

 人工智慧驅動的行銷服務:市場佔有率分析、行業趨勢和統計數據、成長預測(2026-2031 年)
 全球行銷人工智慧市場:2026-2030 年
 人工智慧行銷市場:依技術、應用、產業、部署模式和企業規模分類-2026-2032年全球市場預測人工智慧行銷平台:市場佔有率分析、產業趨勢與統計及成長預測(2026-2031 年)行銷科技服務市場:市場佔有率分析、產業趨勢與統計、成長預測(2026-2031)
 全球行銷技術市場規模、佔有率、趨勢和成長分析報告(2026-2034年)
 2026年人工智慧受眾成長預測全球市場報告
 行銷技術市場規模、佔有率、趨勢和預測:按類型、產品類型、應用和地區分類,2026-2034 年
 行銷科技市場:按產品類型、應用和地區分類2026年全球頻譜熱圖分析市場報告