


 |
市場調查報告書
商品編碼
2117453
電動SUV:市場佔有率分析、產業趨勢與統計、成長預測(2025-2030年)Electric SUV - Market Share Analysis, Industry Trends & Statistics, Growth Forecasts (2025 - 2030) |
||||||

※ 本網頁內容可能與最新版本有所差異。詳細情況請與我們聯繫。
根據 Mordor Intelligence 預測,電動 SUV 市場規模預計到 2025 年將達到 3,613.5 億美元,到 2030 年將達到 5968.1 億美元,2025 年至 2030 年的複合年成長率為 10.56%。
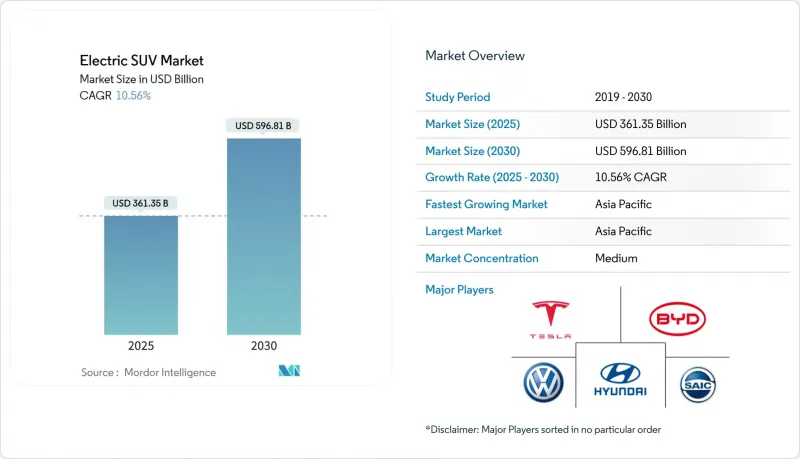
本報告按車輛尺寸(緊湊型、中型、其他)、動力系統(純電動車 (BEV)、燃料電池汽車 (FCEV)、其他)、驅動方式(兩輪驅動、四輪驅動、其他)、最終用戶(個人、商用)、座位數(5 人座、7 人座)和地區(北美、其他)進行細分。市場預測以價值(美元)和銷售(輛)為單位呈現。
全球電動SUV市場趨勢與洞察
更低的電池價格和更持久的化學成分
預計到2024年,鋰離子電池組的價格將降至115美元/千瓦時,接近100美元/千瓦時,這將使大型SUV能夠在沒有補貼的情況下與汽油車的標價競爭。計畫於2020年代中期試行引入固態電池和高鎳電池,預計將使電池重量減輕50%,能量密度翻倍,從而緩解長期以來限制全尺寸SUV普及的重量限制。寧德時代(CATL)的「麒麟」電池組續航里程可達1000公里,特斯拉成本最佳化的4680電芯也清晰地表明,化學技術的進步如何在提升續航里程的同時,將電池組成本降低14%。目前,汽車製造商已在其主流五人座車型中使用低成本的磷酸鋰鐵電池,在顯著降低售價的同時,實現了300英里的實際續航里程。這些綜效維持了OEM廠商的利潤率,並加速了電動SUV市場在價格敏感型家庭中的滲透。
強制企業車隊電氣化正在加速SUV訂單。
租賃公司預計,2024年電動SUV的報價請求(RFQ)將顯著增加,這主要得益於電動SUV總擁有成本(TCO)四年內實現盈虧平衡點。這一趨勢反映出,隨著企業日益重視永續性和成本效益,負責人用車和高頂貨車衍生車型對SUV的偏好不斷增強。企業銷量的激增將提高車輛殘值的可預測性,並加速充電站的擴張,而充電站對於支援電動車的廣泛普及至關重要。這些趨勢凸顯了電動SUV市場不斷演變的動態及其在塑造未來車隊管理格局中的作用。
與同級的內燃機(ICE)SUV車型相比,初始價格溢價較高。
儘管電池成本正在下降,但電動車 (EV) 的價格仍然遠高於汽油車。例如,福特 F-150 Lightning 的起價為 49,995 美元,而其汽油版車型的價格則更為親民,為 37,970 美元。為了維持每月付款水準相當,購車者通常會將貸款期限延長至 72 個月。此外,隨著租賃越來越普遍,消費者希望降低車輛貶值的風險。折扣力度正在縮小,德國推出了補貼償還措施,美國也實施了基於收入的稅額扣抵,這導致一些消費者猶豫不決。由於供應緊張,而汽車製造商 (OEM) 將利潤率維持在首要位置,電動車 SUV 市場的價格可能要到 2027 年才能與汽油車持平。
細分市場分析
2024年,小型SUV佔據電動SUV市場48.15%的佔有率,交付量位居榜首。這主要得益於特斯拉Model Y和比亞迪元Plus在大都會圈的成功銷售。同時,全尺寸SUV預計將以11.56%的複合年成長率成長至2030年,成為成長最快的車款。 BMW、賓士和凱迪拉克等品牌紛紛推出長續航旗艦車型,滿足了豪華車買家的期望。中型SUV市場呈現穩定成長態勢,在都市區操控性和家庭實用性之間取得了平衡。
緊湊型車市場的領先地位反映了歐洲和中國都市區停車位有限且基礎設施集中的現狀,而全尺寸車市場的成長則表明人們對續航里程達400英里(約644公里)的電池組越來越有信心,這種電池組能夠提升公路旅行的實用性。福特Lightning和即將上市的凱迪拉克Escalade IQ證明,即使是零排放車也能滿足拖曳和載貨的需求。區域趨勢依然顯著,緊湊型車在歐洲和日本仍然佔據主導地位,而美國市場的需求則傾向於空間較大的車型。
到2024年,電池式電動車(BEV)將佔據電動SUV市場72.33%的佔有率。這主要得益於完善的充電基礎設施和不斷下降的電池組成本,從而增強了消費者的信心。燃料電池電動車(FCEV)預計將以13.17%的複合年成長率成長,這主要得益於現代Nexo的上市以及德國和韓國氫能走廊計畫的推進。混合動力汽車和插電式混合動力汽車目前仍作為過渡技術佔據一定的市場佔有率。
市場趨勢受基礎設施發展狀況的影響。純電動車在加州、挪威和上海佔據主導地位,而燃料電池電動車在物流和長途計程車領域的示範計畫正在日本、韓國和德國部分地區進行。對於商業車隊而言,如果路線可預測,純電動車是首選;但對於運作至關重要的運營,氫燃料電池仍然是可行的選擇。
區域分析
亞太地區將在2024年繼續保持其在電動SUV市場54.28%的主導地位,並將繼續保持最快的成長速度,到2030年將以11.13%的複合年成長率成長,這主要得益於中國大規模生產和垂直整合價值鏈的優勢。 2024年,補貼政策降低了平均售價,加上韓國在電池領域的領先地位以及印度在生產連結獎勵計畫(PLI)支持下擴大產能,將維持該地區的成本優勢。北美也擁有巨大的潛力,福特、通用和特斯拉正在擴大其超級工廠,以滿足《獎勵控制法案》的國內採購要求。加州和紐約州的州級購車補貼降低了車輛的價格,而加拿大到2026年實現20%零排放車輛(ZEV)的目標也加強了對該地區的政策支持。
儘管歐洲在監管方面保持主導,但其面臨來自中國日益成長的進口壓力。歐盟將於2025年生效平均每公里95克的車輛二氧化碳排放量上限規定,屆時電動SUV的銷售將成為實現合規的關鍵。南美洲正在崛起為戰略成長中心,比亞迪和上汽組裝利用本地組裝優勢,以比歐美競爭對手低2.5萬至3.5萬美元,甚至1.5萬至2萬美元的價格銷售車型,從而迅速擴大了巴西及其周邊國家的電動SUV市場。
儘管中東和非洲的電動車銷量絕對值落後於其他地區,但它們擁有巨大的長期成長潛力。阿拉伯聯合大公國的目標是到2050年透過免費充電和關稅減免,實現50%的電動車普及率;沙烏地阿拉伯的NEOM計畫則旨在打造一個完全電氣化的交通生態系統。南非豐富的礦產資源為互惠互利的供應鏈提供了可能,但其電網的可靠性以及高昂的初始成本仍然是阻礙電動車普及的主要因素。政府致力於經濟多元化和投資可再生能源的措施有望縮小這些差距,隨著基礎設施的完善,該地區的電動車普及速度預計將會加快。
其他好處:
- Excel格式的市場預測(ME)表
- 3個月的分析師支持
目錄
第1章:引言
- 市場分析與定義的前提條件
- 分析範圍
第2章 分析方法
第3章執行摘要
第4章 市場狀況
- 市場概覽
- 市場促進因素
- 更低的電池價格和更持久的化學成分
- 企業車輛強制電動化正在加速SUV的訂單成長。
- 收緊全球平均車輛二氧化碳排放標準和SUV零排放車輛標準。
- 高速公路沿線直流快速充電走廊的快速發展
- 中國低成本電動SUV出口熱潮席捲全球南方
- 專為推出高速SUV車型而打造的滑板平台。
- 市場限制因素
- 與同級配備內燃機的SUV相比,其初始購買價格溢價較高。
- 農村地區充電基礎設施不足
- 由於關鍵礦產相關的環境、社會和治理(ESG)問題引發的強烈反對,新的電池項目被推遲。
- 殘值方面的不確定性阻礙了貨運租賃業務的擴張。
- 價值鍊和供應鏈分析
- 監理情勢
- 技術展望
- 波特五力分析
第5章:預測市場規模與成長率
- 按車輛尺寸
- 袖珍的
- 中號
- 全尺寸
- 透過推進方法
- 電池式電動車(BEV)
- 燃料電池汽車(FCEV)
- 混合動力汽車(HEV)
- 插電式混合動力汽車(PHEV)
- 透過驅動系統
- 2WD
- 4WD
- AWD
- 最終用戶
- 個人
- 商業的
- 按座位數
- 5座
- 7座
- 按地區
- 北美洲
- 美國
- 加拿大
- 其他北美國家
- 南美洲
- 巴西
- 阿根廷
- 其他南美國家
- 歐洲
- 英國
- 德國
- 西班牙
- 義大利
- 法國
- 俄羅斯
- 其他歐洲國家
- 亞太地區
- 印度
- 中國
- 日本
- 韓國
- 其他亞太國家
- 中東和非洲
- 阿拉伯聯合大公國
- 沙烏地阿拉伯
- 土耳其
- 埃及
- 南非
- 其他中東和非洲國家
- 北美洲
第6章 競爭情勢
- 市場集中度
- 策略趨勢
- 市佔率分析
- 公司簡介
- Tesla, Inc.
- BYD Auto Co. Ltd.
- Volkswagen AG
- Hyundai Motor Group
- SAIC Motor Corp., Ltd.
- Kia Corporation
- Ford Motor Company
- General Motors Company
- BMW Group
- Mercedes-Benz Group AG
- AB Volvo
- Stellantis NV
- Toyota Motor Corporation
- NIO Inc.
- XPeng Inc.
- Rivian Automotive Inc.
- Lucid Group
- Geely Holding Group Co. Ltd.
- Great Wall Motor Company Limited
- Tata Motors Limited
- Li Auto Inc.
- Maruti Suzuki Ltd.
- Mitusbishi Motors Corporation
第7章 市場機會與未來展望
According to Mordor Intelligence, the electric SUV market size stood at USD 361.35 billion in 2025 before climbing to USD 596.81 billion by 2030, reflecting a 10.56% CAGR over 2025-2030.
This report is Segmented by Vehicle Size (Compact, Mid-Size, and More), Propulsion Type (Battery Electric Vehicle (BEV), Fuel-Cell Electric Vehicle (FCEV), and More), Drivetrain (2WD, 4WD, and More), End-User (Personal Use and Commercial Use), Seating Capacity (5-Seater and 7-Seater), and Geography (North America and More). The Market Forecasts are Provided in Terms of Value (USD) and Volume (Units).
Global Electric SUV Market Trends and Insights
Falling Battery Prices and Longer-Range Chemistries
Lithium-ion pack prices slid to USD 115 /kWh in 2024 and are nearing the USD 100 tipping point at which large-format SUVs can match gasoline sticker prices without subsidies. Mid-decade pilots of solid-state and high-nickel chemistries promise 50% mass cuts and double the energy density, easing weight penalties that previously limited full-size SUV adoption. CATL's 1,000-km "Qilin" pack and Tesla's cost-optimized 4680 cells highlight how chemistry advances are expanding range envelopes while shaving 14% pack-level costs . Automakers are now fitting lower-cost LFP cells into mainstream five-seater trims, slicing sticker prices significantly yet still delivering 300-mile real-world range. The cumulative effect cushions OEM margins and accelerates e-SUV market uptake among price-sensitive households.
Corporate Fleet Electrification Mandates Accelerate SUV Orders
Lease companies have noted a significant uptick in requests for quotes (RFQs) for electric SUVs in 2024, driven by a four-year breakeven point in total cost of ownership. This trend reflects the growing preference for SUVs in executive transport and high-roof delivery van derivatives, as businesses increasingly prioritize sustainability and cost efficiency. The surge in institutional volumes bolsters predictable residuals and facilitates the expansion of charging depots, which are critical for supporting the scaling of electric vehicle adoption. These developments highlight the evolving dynamics of the e-SUV market and its role in shaping the future of fleet management.
High Upfront Price Premium Versus ICE SUV Equivalents
Despite declining battery costs, electric vehicles (EVs) carry hefty premiums. Take the Ford F-150 Lightning, for instance: it kicks off at USD 49,995, while its gasoline counterpart starts at a more modest USD 37,970. Buyers are extending their financing terms to 72 months to achieve comparable monthly payments. Additionally, with rising lease penetration, consumers want to mitigate depreciation risks. In Germany, subsidy claw-backs and income-capped credits in the United States are tightening discounts, leaving some mainstream buyers hesitant. As original equipment manufacturers (OEMs) prioritize margin retention amidst constrained supply, it suggests that a full price parity for EVs within the e-SUV market might remain elusive until 2027.
Other drivers and restraints analyzed in the detailed report include:
- Tighter Global CO2 and ZEV Fleet-Average Targets for SUVs
- Rapid Build-Out of Highway DC Fast-Charging Corridors
- Sparse Rural Charging Infrastructure
For complete list of drivers and restraints, kindly check the Table Of Contents.
Segment Analysis
Compact models led 2024 deliveries with a 48.15% slice of the Electric SUV market share, anchored by Tesla Model Y and BYD Yuan Plus' success in dense cities. Full-size entries, however, record the sharpest 11.56% CAGR to 2030 as BMW, Mercedes-Benz, and Cadillac unleash long-range flagships meeting luxury buyer expectations. Mid-size offerings remain stable, striking a balance between urban maneuverability and family utility.
The compact lead reflects parking constraints and infrastructure concentration in Europe and urban China, while full-size gains show rising faith in 400-mile packs for road-trip practicality. Ford's Lightning and upcoming Escalade IQ exemplify how towing and cargo demands are now addressable in zero-emission guise. Regional splits stay pronounced: compacts dominate Europe and Japan, whereas U.S. demand tilts toward roomier trims.
Battery Electric Vehicles (BEVs) secured 72.33% of the Electric SUV market share in 2024, as robust charging ecosystems and falling pack costs cemented buyer confidence. Fuel-cell Electric Vehicle (FCEVs) post a 13.17% CAGR outlook, catalyzed by Hyundai Nexo launches and German-Korean hydrogen corridor projects. Hybrid and plug-in hybrid niches persist as bridge technologies.
Market preference tracks infrastructure. California, Norway, and Shanghai propel BEV dominance, whereas Japan, South Korea, and parts of Germany foster FCEV pilots for logistics and long-haul taxis. Commercial fleets weigh BEV for predictable routes but keep hydrogen on radar for uptime-critical operations.
Complete Report Scope:
- By Vehicle Size
- Compact
- Mid-size
- Full-size
- By Propulsion Type
- Battery Electric Vehicle (BEV)
- Fuel-cell Electric Vehicle (FCEV)
- Hybrid Electric Vehicle (HEV)
- Plug-in Hybrid Electric Vehicle (PHEV)
- By Drivetrain
- 2WD
- 4WD
- AWD
- By End-User
- Personal Use
- Commercial Use
- By Seating Capacity
- 5-Seater
- 7-Seater
- By Geography
- North America
- United States
- Canada
- Rest of North America
- South America
- Brazil
- Argentina
- Rest of South America
- Europe
- United Kingdom
- Germany
- Spain
- Italy
- France
- Russia
- Rest of Europe
- Asia-Pacific
- India
- China
- Japan
- South Korea
- Rest of Asia-Pacific
- Middle East and Africa
- United Arab Emirates
- Saudi Arabia
- Turkey
- Egypt
- South Africa
- Rest of Middle East and Africa
- North America
Geography Analysis
Asia-Pacific retained its commanding 54.28% Electric SUV market share in 2024 and continues as the fastest-growing region at 11.13% CAGR through 2030, led by China's high production and vertically integrated value chain advantages. Subsidies that trimmed 2024 average selling prices and South Korea's battery leadership and India's PLI-backed capacity build-outs sustain the region's cost edge. North America also holds a significant potential, as the Inflation Reduction Act content rules, with Ford, General Motors, and Tesla scaling gigafactories to qualify for incentives. State-level rebates in California and New York deepen affordability, while Canada's ZEV quota of 20% by 2026 reinforces the regional policy pull.
Europe maintains regulatory leadership yet faces rising Chinese import pressure; the EU's 95 g/km fleet-average CO2 cap, effective 2025, makes Electric SUV sales pivotal for compliance. South America is emerging as a strategic growth pod where BYD and SAIC leverage local assembly to retail models at USD 25,000-35,000-USD 15,000-20,000 below Western rivals-rapidly expanding the Electric SUV market size in Brazil and neighboring economies.
The Middle East and Africa trail in absolute units yet present long-run upside: the United Arab Emirates targets 50% electric adoption by 2050 through free charging and duty exemptions, while Saudi Arabia's NEOM project envisions a fully electric transport ecosystem. South Africa's mineral resources offer reciprocal supply-chain prospects, though grid reliability and upfront affordability still restrain uptake. Government diversification agendas and renewable energy investments are expected to narrow these gaps, positioning the region for accelerated penetration as infrastructure densifies.
- Tesla, Inc.
- BYD Auto Co. Ltd.
- Volkswagen AG
- Hyundai Motor Group
- SAIC Motor Corp., Ltd.
- Kia Corporation
- Ford Motor Company
- General Motors Company
- BMW Group
- Mercedes-Benz Group AG
- AB Volvo
- Stellantis N.V.
- Toyota Motor Corporation
- NIO Inc.
- XPeng Inc.
- Rivian Automotive Inc.
- Lucid Group
- Geely Holding Group Co. Ltd.
- Great Wall Motor Company Limited
- Tata Motors Limited
- Li Auto Inc.
- Maruti Suzuki Ltd.
- Mitusbishi Motors Corporation
Additional Benefits:
- The market estimate (ME) sheet in Excel format
- 3 months of analyst support
TABLE OF CONTENTS
1 Introduction
- 1.1 Study Assumptions & Market Definition
- 1.2 Scope of the Study
2 Research Methodology
3 Executive Summary
4 Market Landscape
- 4.1 Market Overview
- 4.2 Market Drivers
- 4.2.1 Falling Battery Prices and Longer-Range Chemistries
- 4.2.2 Corporate Fleet Electrification Mandates Accelerate SUV Orders
- 4.2.3 Tighter Global CO2 and ZEV Fleet-Average Targets for SUVs
- 4.2.4 Rapid Build-Out of Highway DC Fast-Charging Corridors
- 4.2.5 Chinese Low-Cost E-SUV Export Wave to the Global South
- 4.2.6 Dedicated Skateboard Platforms for Speeding SUV Variant Launches
- 4.3 Market Restraints
- 4.3.1 High Upfront Price Premium Versus ICE SUV Equivalents
- 4.3.2 Sparse Rural Charging Infrastructure
- 4.3.3 Critical-Minerals ESG Pushback Delaying New Battery Projects
- 4.3.4 Residual-Value Uncertainty Curbing Fleet Leasing Uptake
- 4.4 Value / Supply-Chain Analysis
- 4.5 Regulatory Landscape
- 4.6 Technological Outlook
- 4.7 Porter's Five Forces
- 4.7.1 Bargaining Power of Suppliers
- 4.7.2 Bargaining Power of Buyers
- 4.7.3 Threat of New Entrants
- 4.7.4 Threat of Substitutes
- 4.7.5 Competitive Rivalry
5 Market Size & Growth Forecasts (Value (USD) and Volume (Units))
- 5.1 By Vehicle Size
- 5.1.1 Compact
- 5.1.2 Mid-size
- 5.1.3 Full-size
- 5.2 By Propulsion Type
- 5.2.1 Battery Electric Vehicle (BEV)
- 5.2.2 Fuel-cell Electric Vehicle (FCEV)
- 5.2.3 Hybrid Electric Vehicle (HEV)
- 5.2.4 Plug-in Hybrid Electric Vehicle (PHEV)
- 5.3 By Drivetrain
- 5.3.1 2WD
- 5.3.2 4WD
- 5.3.3 AWD
- 5.4 By End-User
- 5.4.1 Personal Use
- 5.4.2 Commercial Use
- 5.5 By Seating Capacity
- 5.5.1 5-Seater
- 5.5.2 7-Seater
- 5.6 By Geography
- 5.6.1 North America
- 5.6.1.1 United States
- 5.6.1.2 Canada
- 5.6.1.3 Rest of North America
- 5.6.2 South America
- 5.6.2.1 Brazil
- 5.6.2.2 Argentina
- 5.6.2.3 Rest of South America
- 5.6.3 Europe
- 5.6.3.1 United Kingdom
- 5.6.3.2 Germany
- 5.6.3.3 Spain
- 5.6.3.4 Italy
- 5.6.3.5 France
- 5.6.3.6 Russia
- 5.6.3.7 Rest of Europe
- 5.6.4 Asia-Pacific
- 5.6.4.1 India
- 5.6.4.2 China
- 5.6.4.3 Japan
- 5.6.4.4 South Korea
- 5.6.4.5 Rest of Asia-Pacific
- 5.6.5 Middle East and Africa
- 5.6.5.1 United Arab Emirates
- 5.6.5.2 Saudi Arabia
- 5.6.5.3 Turkey
- 5.6.5.4 Egypt
- 5.6.5.5 South Africa
- 5.6.5.6 Rest of Middle East and Africa
- 5.6.1 North America
6 Competitive Landscape
- 6.1 Market Concentration
- 6.2 Strategic Moves
- 6.3 Market Share Analysis
- 6.4 Company Profiles (Includes Global Level Overview, Market Level Overview, Core Segments, Financials as Available, Strategic Information, Market Rank/Share for Key Companies, Products and Services, SWOT Analysis, and Recent Developments)
- 6.4.1 Tesla, Inc.
- 6.4.2 BYD Auto Co. Ltd.
- 6.4.3 Volkswagen AG
- 6.4.4 Hyundai Motor Group
- 6.4.5 SAIC Motor Corp., Ltd.
- 6.4.6 Kia Corporation
- 6.4.7 Ford Motor Company
- 6.4.8 General Motors Company
- 6.4.9 BMW Group
- 6.4.10 Mercedes-Benz Group AG
- 6.4.11 AB Volvo
- 6.4.12 Stellantis N.V.
- 6.4.13 Toyota Motor Corporation
- 6.4.14 NIO Inc.
- 6.4.15 XPeng Inc.
- 6.4.16 Rivian Automotive Inc.
- 6.4.17 Lucid Group
- 6.4.18 Geely Holding Group Co. Ltd.
- 6.4.19 Great Wall Motor Company Limited
- 6.4.20 Tata Motors Limited
- 6.4.21 Li Auto Inc.
- 6.4.22 Maruti Suzuki Ltd.
- 6.4.23 Mitusbishi Motors Corporation
7 Market Opportunities & Future Outlook
- 7.1 White-space & Unmet-Need Assessment

 2026年全球掀背車市場報告
 2026-2034年全球SUV市場規模、佔有率、趨勢和成長分析報告
 印度SUV市場:市場佔有率分析、產業趨勢與統計、成長預測(2026-2031年)
 運動型多用途車(SUV)市場規模、佔有率和成長分析:按車輛類型、推進系統、驅動方式、燃料類型、座位數、最終用戶和地區分類-2026-2033年產業預測
 運動型多用途車(SUV)市場:全球市場預測,2026-2032年SUV:市佔率分析、產業趨勢與統計、成長預測(2025-2030 年)
 SUV市場分析及預測(至2035年):類型、產品、技術、組件、應用、最終用戶、安裝類型、設備、解決方案
 運動型多用途車(SUV)市場規模、佔有率和成長分析:按SUV尺寸、動力系統、驅動方式、銷售管道和地區分類-2026-2033年產業預測
 混合動力生活風格汽車市場:未來預測(至2034年)-按車輛類型、動力技術、生活方式導向、應用、最終用戶和地區分類的全球分析
 SUV市場-全球產業規模、佔有率、趨勢、機會、預測:按類型、燃料類型、尺寸、座位數、價格範圍、地區和競爭格局分類,2021-2031年