


 |
市場調查報告書
商品編碼
2116792
歐洲氫氣生產:市場佔有率分析、產業趨勢與統計及成長預測(2026-2031 年)Europe Hydrogen Generation - Market Share Analysis, Industry Trends & Statistics, Growth Forecasts (2026 - 2031) |
||||||

※ 本網頁內容可能與最新版本有所差異。詳細情況請與我們聯繫。
據估計,2026 年歐洲氫氣生產市場價值為 445.9 億美元,預計在預測期(2026-2031 年)內將以 3.69% 的複合年成長率成長,到 2031 年達到 534.4 億美元。
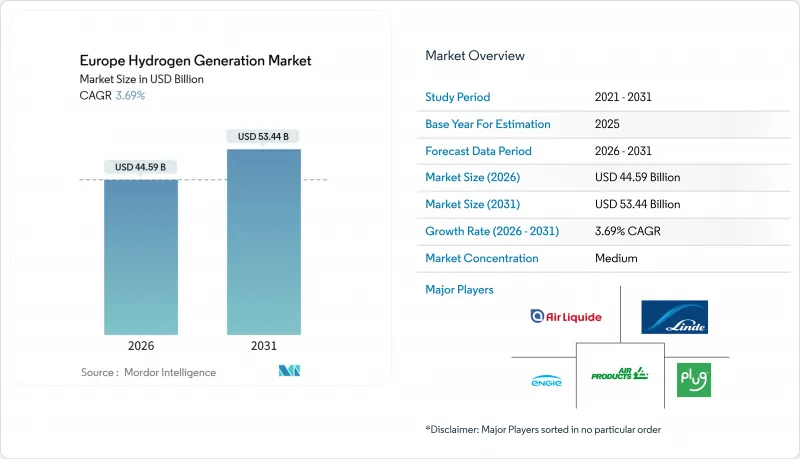
本報告按原料(灰色、藍色、綠色、青色、粉紅色)、技術(SMR、煤炭氣化、ATR、POX、電解)、應用(石油煉製、化學加工、鋼鐵、運輸燃料、電力和儲能以及住宅和商業供暖)和地區(德國、法國、英國、荷蘭、西班牙、義大利、挪威、丹麥等)進行分類。
歐洲氫氣生產市場的趨勢與洞察
歐盟的「適合55歲族群」和綠色新政義務
歐盟設定了具有法律約束力的目標,即到2030年實現國內可再生1000萬噸,進口氫產量1000萬噸。儘管短期內成本面臨挑戰,但這些目標正在增強市場需求的確定性。德國2023年的戰略計畫撥款81億美元用於電解和進口通道建設,而法國則撥款79億美元用於2030年實現工業脫碳。將於2025年7月生效的《區域可再生氫和生物技術條例》(RFNBO)引入了額外性和基於時間的匹配機制,透過確保碳完整性來降低私人資本的風險,同時有意放慢氫能的普及速度。成員國之間的競標、德國的「H2Global」和法國的「Hydrogene decarbone」競標以及為期10年的上網電價補貼保證正在縮小灰氫和綠氫之間的成本差距。這些措施共同引導歐洲氫能市場走向結構性低排放的道路,同時增強了先鋒計畫資金籌措的確定性。
降低電解槽成本(規模經濟與學習曲線)
隨著超級工廠的運作,鹼性燃料電池的價格已從2020年的每千瓦1300歐元降至2025年底的每千瓦600-800歐元,使其價格水準與從中國進口的燃料電池堆相當。蒂森克虜伯Nucera的20兆瓦組件和Nel的3.5兆瓦燃料電池堆目前的出貨價格均低於每千瓦700歐元,而Sunfire的固態氧化物電解池(SOEC)先導計畫效率提高了10-15個百分點,儘管資本支出(Capex)更高。正如產能每加倍需要18-22%的學習曲線所表明的那樣,匈牙利和柏林宣佈建造的超級工廠預計將在2029年之前將鹼性燃料電池的成本降至每千瓦400歐元以下,並使綠色氫能在風能資源豐富的地區實現成本持平。設備價格的下降將直接導致專案層面的均衡成本(LCOH)降低,從而縮短歐洲氫氣生產市場獲得補貼所需的時間。
如果沒有設定明確的碳價格,綠色氫(LCOH)和灰色氫之間的成本差異將會很大。
預計到2025年,綠色氫氣的平均價格將在每公斤4.50歐元至6.50歐元之間,而灰色氫氣的價格則在每公斤1.80歐元至2.30歐元之間,兩者之間存在2.70歐元至4.20歐元的價差。然而,由於目前碳排放交易體系(ETS)的價格低於每噸75歐元,這一價差仍未被彌補。德國2024年的碳價差合約(CFD)設定了每公斤4歐元的執行價格,但首次競標僅涵蓋了1.2吉瓦的裝置容量,遠低於2030年10吉瓦的目標。歐洲氫能銀行的固定溢價競標在10年內提供每公斤0.40歐元至0.48歐元的價差。雖然這有利,但依賴公共資金會帶來風險,即專案可能會受到 2027 年後財政優先事項變化的影響。在 EUA 價格達到每噸 90-110 歐元之前,交易商會進行避險,並推遲在自由市場上的大規模採購,這將減緩歐洲氫能市場的擴張速度。
細分市場分析
預計2025年,歐洲氫能市場規模中,灰氫市場將達到310億美元,佔總量的70.1%。然而,隨著可再生能源氫氣生產方式超越傳統方式,到2031年,其佔有率將下降至55%以下。綠氫產量將以每年25.5%的速度成長,這主要得益於資本投資的減少以及「Fit-for-55」計畫的需求保障。這一成長將使綠氫市場規模到2031年達到126億美元,大幅提升電解生產商在歐洲氫氣生產市場的佔有率。藍氫將因二氧化碳捕集率達到90%或以上的項目而溫和成長,但其成長將受到公眾對碳捕獲與封存(CCS)基礎設施的抵制限制。同時,綠松石氫和粉紅氫將滿足聚合物產業和核能發電叢集的特定需求。總體而言,能源來源結構轉型表明這是一個可控的、分階段的轉型,而不是突然的轉型,這不僅降低了現有天然氣供應商的現金流風險,也為能夠確保符合 RFNBO 標準的供應量的新進入者創造了機會。
次要影響體現在天然氣市場和氨貿易流量的對沖交易。煉油商在等待與綠氫價格趨於一致期間,正簽訂3-5年的藍氫過渡協議;而大型化學企業則專注於出口綠氨,以利用RFNBO的溢價信用額度獲利。因此,各供應路線上的選擇權交易正逐漸成為對沖策略,使企業買家能夠在不影響其核心業務運作的情況下滿足合規期限要求。
其他好處:
- Excel格式的市場預測(ME)表
- 3個月的分析師支持
目錄
第1章:引言
- 研究假設和市場定義
- 調查範圍
第2章:調查方法
第3章執行摘要
第4章 市場狀況
- 市場概覽
- 市場促進因素
- 歐盟「適合55歲人群居住」和綠色新政的要求
- 降低電解槽成本(規模經濟與學習曲線)
- 企業為實現淨零排放所做的努力(重工業和交通運輸)
- 歐盟資助:IPCEI、地平線歐洲、CEF、ETS創新基金
- 透過限制北海離岸風力發電的輸出,發電成本幾乎為零。
- 透過將天然氣網路重新用作“氫氣骨幹網路”,可以減少中游資本支出(CAPEX)。
- 市場限制因素
- 在沒有明確的碳價格的情況下,低碳氫化合物(LCOH)和灰氫之間存在巨大的價格差異。
- 大規模電解中可再生能源的供應限制
- 銥/鉑金屬的短缺限制了PEM電解槽的規模化生產。
- 民眾反對藍氫捕集與封存(CCS)基礎設施
- 供應鏈分析
- 政府政策和法規
- 技術趨勢(鹼性型、PEM型、SOEC型、AEM型、SMR-CCS型等)
- 波特五力模型
第5章 市場規模與成長預測
- 來源
- 灰氫
- 藍氫
- 綠氫能
- 綠松石氫
- 粉紅氫
- 透過技術
- 蒸汽甲烷重整(SMR)
- 煤炭氣化
- 自發性熱重組(ATR)
- 部分氧化法(POX)
- 電解法(鹼性電解、質子交換膜電解 (PEM)、固體氧化物電解(SOE))
- 透過使用
- 煉油
- 化學處理(氨、甲醇)
- 鋼(直接還原鐵,H2-BF)
- 運輸燃料(燃料電池電動車、船舶、航空)
- 電力和儲能
- 住宅和商業供暖
- 按地區
- 德國
- 法國
- 英國
- 荷蘭
- 西班牙
- 義大利
- 挪威
- 丹麥
- 波蘭
- 俄羅斯
- 其他歐洲國家
第6章 競爭情勢
- 市場集中度
- 策略趨勢(併購、聯盟、購電協議)
- 市場佔有率分析(主要公司的市場排名和佔有率)
- 公司簡介
- Air Liquide
- Linde plc
- Air Products & Chemicals
- Engie SA
- Plug Power
- Messer Group
- FuelCell Energy
- Enapter AG
- Siemens Energy
- Nel ASA
- McPhy Energy
- thyssenkrupp nucera
- Sunfire GmbH
- ITM Power
- Shell plc
- BP plc
- TotalEnergies SE
- Equinor ASA
- RWE AG
- Iberdrola SA
第7章 市場機會與未來展望
According to Mordor Intelligence, the Europe hydrogen generation market size is estimated at USD 44.59 billion in 2026, and is expected to reach USD 53.44 billion by 2031, at a CAGR of 3.69% during the forecast period (2026-2031).
This report is Segmented by Source (Grey, Blue, Green, Turquoise, and Pink), Technology (SMR, Coal Gasification, ATR, POX, and Electrolysis), Application (Oil Refining, Chemical Processing, Iron and Steel, Transportation Fuel, Power and Energy Storage, and Residential and Commercial Heating), and Geography (Germany, France, United Kingdom, Netherlands, Spain, Italy, Norway, Denmark, and More).
Europe Hydrogen Generation Market Trends and Insights
EU "Fit-for-55" & Green Deal Mandates
Binding EU targets of 10 million tonnes of domestic renewable hydrogen and 10 million tonnes of imports by 2030 elevate demand certainty despite near-term cost headwinds. Germany's 2023 strategy earmarked USD 8.1 billion across electrolysis and import corridors, while France allocated USD 7.9 billion through 2030 for industrial decarbonization. July 2025 RFNBO rules introduced additionality and hourly matching, deliberately slowing deployment yet locking in carbon integrity that derisks private capital. Member-state auctions, H2Global in Germany and France's "Hydrogene decarbone" tenders, guarantee offtake prices for ten years, narrowing the grey-green cost gap. Collectively, these measures push the European Hydrogen Generation Market toward structurally lower emissions pathways while providing bankability for first-mover projects.
Electrolyser Cost Decline (Scale & Learning Curves)
Alkaline system prices fell from EUR 1,300 per kW in 2020 to EUR 600-800 per kW by late 2025 as gigafactories came online, achieving parity with imported Chinese stacks. thyssenkrupp nucera's 20 MW modules and Nel's 3.5 MW stacks now ship at sub-EUR 700 per kW, while Sunfire's SOEC pilots show 10-15 percentage-point efficiency gains, albeit at higher capex. Learning curves of 18-22% per capacity doubling suggest that announced gigafactories in Hungary and Berlin will drive alkaline costs below EUR 400 per kW by 2029, positioning green hydrogen for parity in wind-rich zones. Falling equipment prices translate directly into project-level levelized cost reductions, compressing the time needed for the European Hydrogen Generation Market to decouple from subsidies.
High LCOH Gap vs. Grey H2 Without Robust Carbon Price
Green hydrogen averaged EUR 4.50-6.50 kg in 2025 against EUR 1.80-2.30 kg for grey, leaving a EUR 2.70-4.20 gap that sub-EUR 75 t ETS prices do not yet close. Germany's 2024 carbon contracts-for-difference pay a EUR 4.00 kg strike price but covered only 1.2 GW in the first auction, well below the 10 GW 2030 target. The European Hydrogen Bank's fixed-premium auctions offer EUR 0.40-0.48 kg for ten years; while helpful, reliance on public finance exposes projects to shifting fiscal priorities after 2027. Until EUA prices clear EUR 90-110 t, merchants will hedge but delay large free-market purchases, capping the expansion speed of the European Hydrogen Generation Market.
Other drivers and restraints analyzed in the detailed report include:
- Corporate Net-Zero Commitments (Heavy Industry & Mobility)
- EU Funding: IPCEI, Horizon Europe, CEF, ETS Innovation Fund
- Renewable-Power Availability Constraints for Large-Scale Electrolysis
For complete list of drivers and restraints, kindly check the Table Of Contents.
Segment Analysis
Europe's hydrogen generation market size for grey hydrogen equaled USD 31.0 billion in 2025, representing 70.1% of volume, but its share slips below 55% by 2031 as renewable-powered routes outpace legacy. Green output grows 25.5% a year, leveraging falling capex and Fit-for-55 demand guarantees; this surge elevates green hydrogen value to USD 12.6 billion by 2031, translating into notable Europe hydrogen generation market share gains for electrolytic producers. Blue hydrogen rises modestly on projects with >=90% CO2 capture but remains capped by public resistance to CCS infrastructure, while turquoise and pink routes fill niche needs in polymer and nuclear-anchored clusters. Altogether, the shifting source mix confirms a managed glidepath rather than an abrupt switch, smoothing cash-flow risk for incumbent gas suppliers yet opening room for new entrants with RFNBO-compliant volumes.
Second-order effects appear in gas-market hedging and ammonia trade flows. Refiners sign three- to five-year bridge contracts for blue hydrogen while awaiting green parity, whereas chemical majors lean into green-ammonia exports that monetize RFNBO premium credits. As a result, optionality across source routes becomes a hedge strategy, allowing corporate buyers to straddle compliance deadlines without disrupting core operations.
Complete Report Scope:
- By Source
- Grey Hydrogen
- Blue Hydrogen
- Green Hydrogen
- Turquoise Hydrogen
- Pink Hydrogen
- By Technology
- Steam Methane Reforming (SMR)
- Coal Gasification
- Auto-Thermal Reforming (ATR)
- Partial Oxidation (POX)
- Electrolysis (Alkaline Electrolysis, Proton Exchange Membrane (PEM), Solid Oxide Electrolysis (SOE))
- By Application
- Oil Refining
- Chemical Processing (Ammonia, Methanol)
- Iron and Steel (DRI, H2-BF)
- Transportation Fuel (FCEV, Marine, Aviation)
- Power and Energy Storage
- Residential and Commercial Heating
- By Geography
- Germany
- France
- United Kingdom
- Netherlands
- Spain
- Italy
- Norway
- Denmark
- Poland
- Russia
- Rest of Europe
List of Companies Covered in this Report:
- Air Liquide
- Linde plc
- Air Products & Chemicals
- Engie SA
- Plug Power
- Messer Group
- FuelCell Energy
- Enapter AG
- Siemens Energy
- Nel ASA
- McPhy Energy
- thyssenkrupp nucera
- Sunfire GmbH
- ITM Power
- Shell plc
- BP plc
- TotalEnergies SE
- Equinor ASA
- RWE AG
- Iberdrola SA
Additional Benefits:
- The market estimate (ME) sheet in Excel format
- 3 months of analyst support
TABLE OF CONTENTS
1 Introduction
- 1.1 Study Assumptions & Market Definition
- 1.2 Scope of the Study
2 Research Methodology
3 Executive Summary
4 Market Landscape
- 4.1 Market Overview
- 4.2 Market Drivers
- 4.2.1 EU "Fit-for-55" & Green Deal mandates
- 4.2.2 Electrolyser cost decline (scale & learning curves)
- 4.2.3 Corporate net-zero commitments (heavy industry & mobility)
- 4.2.4 EU funding: IPCEI, Horizon Europe, CEF, ETS Innovation Fund
- 4.2.5 North-Sea offshore-wind curtailment creating near-zero-cost power
- 4.2.6 Repurposing gas grid into "Hydrogen Backbone" lowers mid-stream CAPEX
- 4.3 Market Restraints
- 4.3.1 High LCOH gap vs. grey H2 without robust carbon price
- 4.3.2 Renewable-power availability constraints for large-scale electrolysis
- 4.3.3 Iridium/Pt metal shortages limit PEM electrolyser scaling
- 4.3.4 Public opposition to CCS infrastructure for blue hydrogen
- 4.4 Supply-Chain Analysis
- 4.5 Government Policies & Regulations
- 4.6 Technological Outlook (Alkaline, PEM, SOEC, AEM, SMR-CCS etc.)
- 4.7 Porter's Five Forces
- 4.7.1 Bargaining Power of Suppliers
- 4.7.2 Bargaining Power of Buyers
- 4.7.3 Threat of New Entrants
- 4.7.4 Threat of Substitutes
- 4.7.5 Intensity of Rivalry
5 Market Size & Growth Forecasts
- 5.1 By Source
- 5.1.1 Grey Hydrogen
- 5.1.2 Blue Hydrogen
- 5.1.3 Green Hydrogen
- 5.1.4 Turquoise Hydrogen
- 5.1.5 Pink Hydrogen
- 5.2 By Technology
- 5.2.1 Steam Methane Reforming (SMR)
- 5.2.2 Coal Gasification
- 5.2.3 Auto-Thermal Reforming (ATR)
- 5.2.4 Partial Oxidation (POX)
- 5.2.5 Electrolysis (Alkaline Electrolysis, Proton Exchange Membrane (PEM), Solid Oxide Electrolysis (SOE))
- 5.3 By Application
- 5.3.1 Oil Refining
- 5.3.2 Chemical Processing (Ammonia, Methanol)
- 5.3.3 Iron and Steel (DRI, H2-BF)
- 5.3.4 Transportation Fuel (FCEV, Marine, Aviation)
- 5.3.5 Power and Energy Storage
- 5.3.6 Residential and Commercial Heating
- 5.4 By Geography
- 5.4.1 Germany
- 5.4.2 France
- 5.4.3 United Kingdom
- 5.4.4 Netherlands
- 5.4.5 Spain
- 5.4.6 Italy
- 5.4.7 Norway
- 5.4.8 Denmark
- 5.4.9 Poland
- 5.4.10 Russia
- 5.4.11 Rest of Europe
6 Competitive Landscape
- 6.1 Market Concentration
- 6.2 Strategic Moves (M&A, Partnerships, PPAs)
- 6.3 Market Share Analysis (Market Rank/Share for key companies)
- 6.4 Company Profiles (includes Global level Overview, Market level overview, Core Segments, Financials as available, Strategic Information, Products & Services, and Recent Developments)
- 6.4.1 Air Liquide
- 6.4.2 Linde plc
- 6.4.3 Air Products & Chemicals
- 6.4.4 Engie SA
- 6.4.5 Plug Power
- 6.4.6 Messer Group
- 6.4.7 FuelCell Energy
- 6.4.8 Enapter AG
- 6.4.9 Siemens Energy
- 6.4.10 Nel ASA
- 6.4.11 McPhy Energy
- 6.4.12 thyssenkrupp nucera
- 6.4.13 Sunfire GmbH
- 6.4.14 ITM Power
- 6.4.15 Shell plc
- 6.4.16 BP plc
- 6.4.17 TotalEnergies SE
- 6.4.18 Equinor ASA
- 6.4.19 RWE AG
- 6.4.20 Iberdrola SA
7 Market Opportunities & Future Outlook
- 7.1 White-Space & Unmet-Need Assessment

 下一代水處理膜市場分析與預測(至2035年):按類型、產品、技術、組件、應用、材料類型、製程、最終用戶、功能和安裝配置分類
 美國氫氣生產:市場佔有率分析、行業趨勢和統計數據以及成長預測(2026-2031 年)
 氫氣生產市場:按類型、生產方法、原料、產品、應用和終端用戶產業分類-2026-2032年全球市場預測
 綠色氫能和電能轉氣市場預測至2034年-按技術、應用、最終用戶和地區分類的全球分析
 石油煉製領域自產氫氣市場-全球產業規模、佔有率、趨勢、機會和預測:按製造流程、應用、類型、最終用途產業、地區和競爭格局專屬式,2021-2031年蒸汽甲烷重整(SMR)市場-全球產業規模、佔有率、趨勢、機會、預測:依原料、轉化技術、應用、區域、競爭格局分類,2021-2031年可再生氫市場預測至2034年-全球分析(依再生能源來源、技術、生產規模、純度、儲存與運輸、分銷通路、應用、終端用戶產業及地區分類)生質能衍生綠色氫氣生產市場預測至 2034 年—按製程類型、原料類型、技術、應用、最終用戶和地區進行全球分析。蒸汽甲烷重整氫氣市場預測至2034年:全球產能、技術、應用與區域分析高溫氫電解系統市場預測至2034年-全球分析(按電解槽類型、組件、動作溫度、系統容量、應用、最終用戶和地區分類)